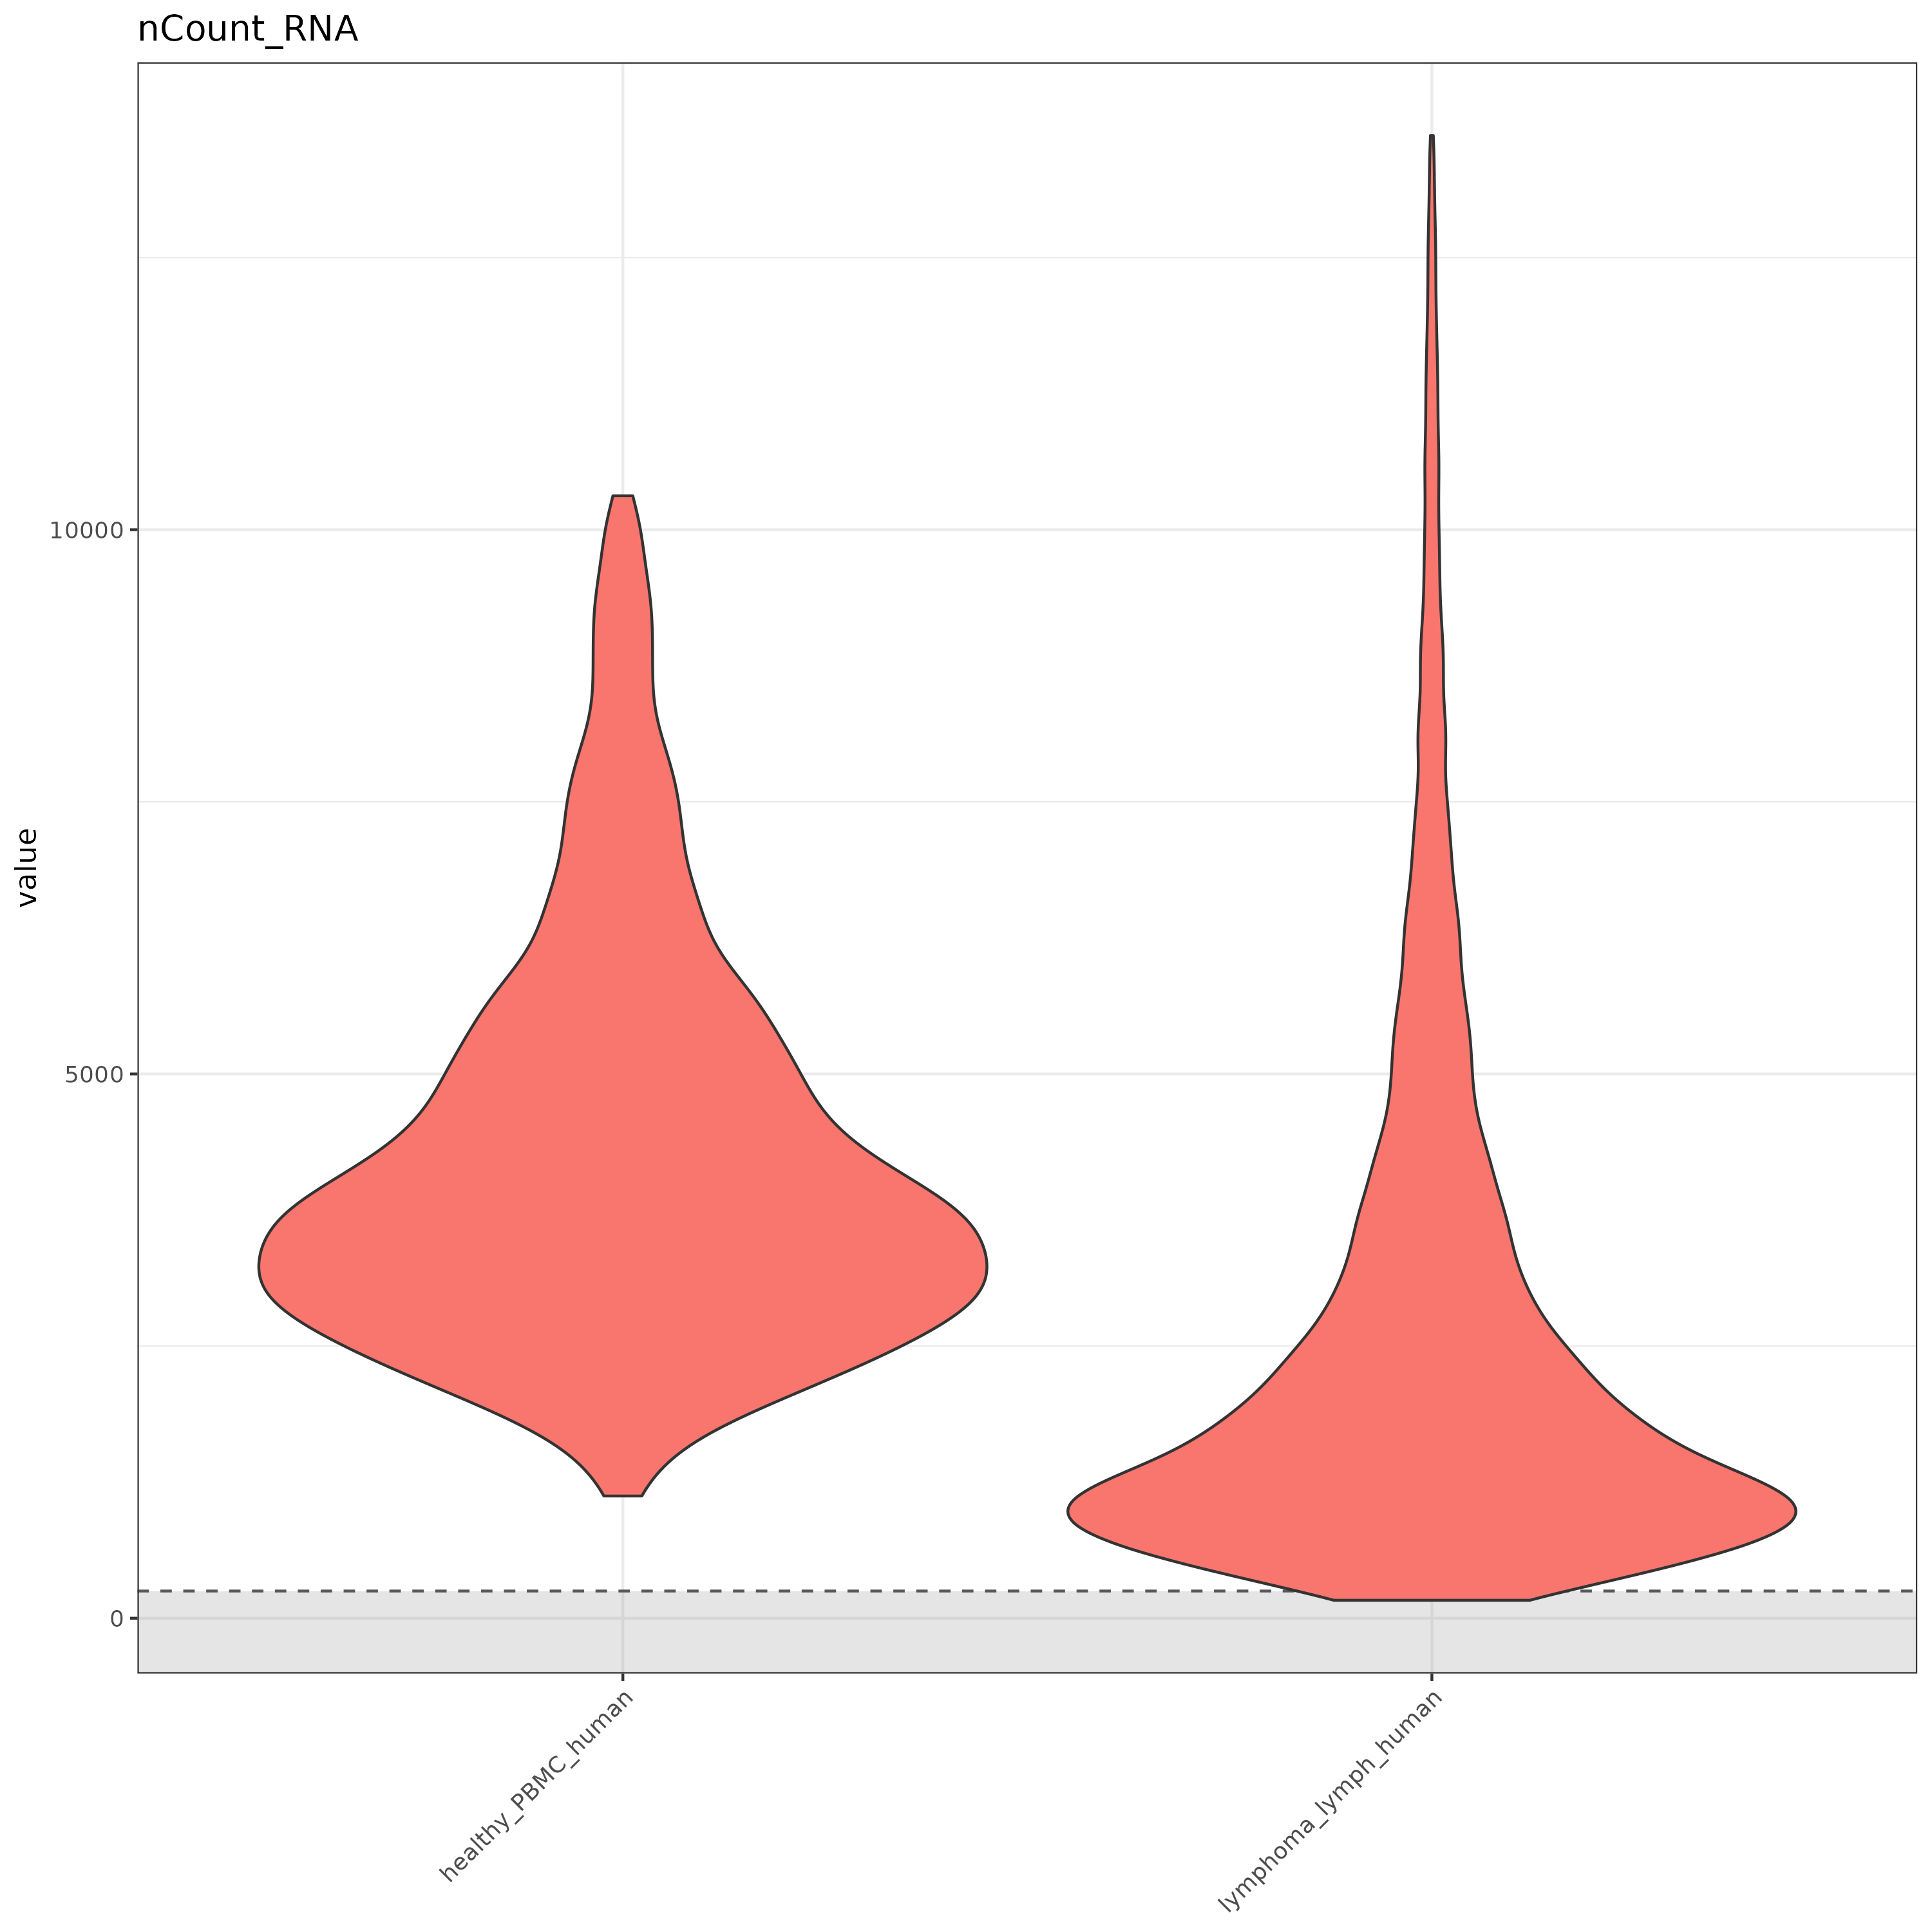
RNA count distributions
Compares Cell Ranger-called RNA count distributions across the two demo GEM wells before custom QC filters are applied.
per_dataset_QC_violins.immune_human_dataset
These documentation snapshots show representative outputs from the public immune_human_2x configuration with its two active GEM wells. The cards follow the numbered reviews in the adaptation guide. Each card names the target that generated the displayed demo result; click an image to open it at full resolution.
To reproduce these plot families, install and run the demo, then request the broader review checkpoints. The endpoint-only quickstart does not build every gallery plot; inspect its local outputs to see the distinction.
Unfiltered distributions used to choose per-GEM-well QC expressions.
RNA count distributions
Compares Cell Ranger-called RNA count distributions across the two demo GEM wells before custom QC filters are applied.
per_dataset_QC_violins.immune_human_dataset
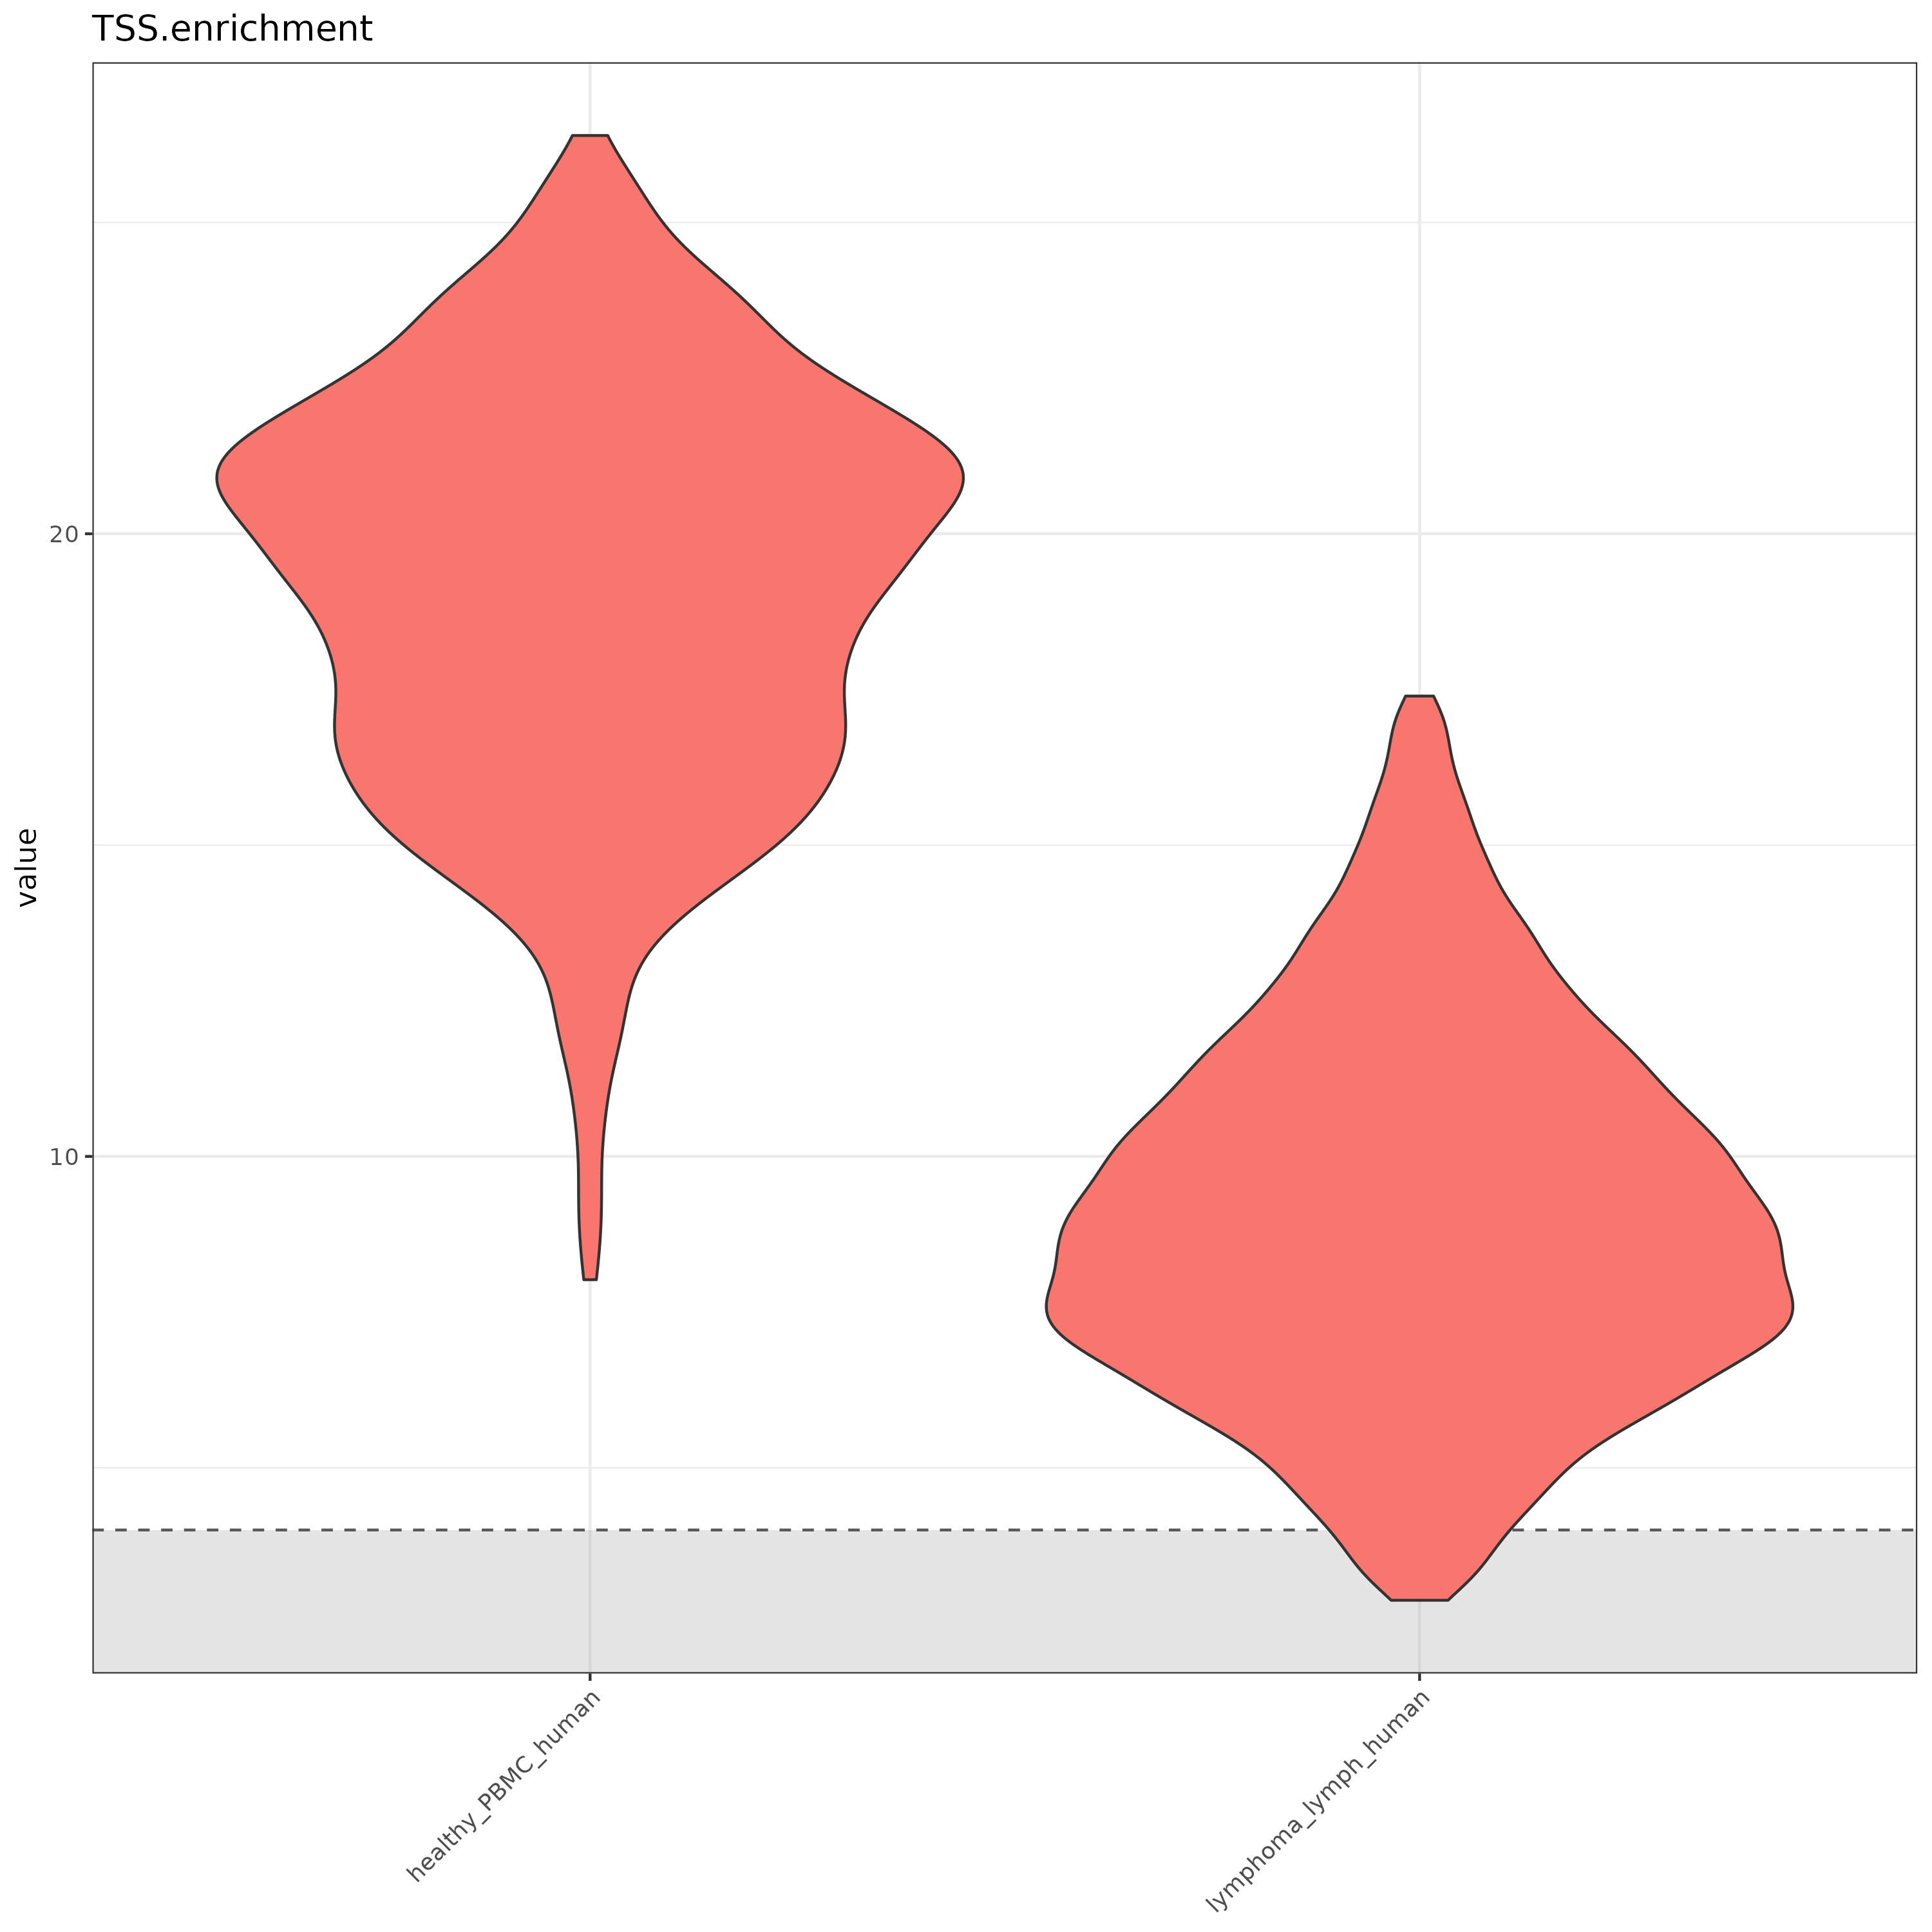
TSS enrichment distributions
Compares TSS enrichment across the two demo GEM wells before custom QC filters are applied.
per_dataset_QC_violins.immune_human_dataset
Applied per-GEM-well filters and the cells retained for GEX.
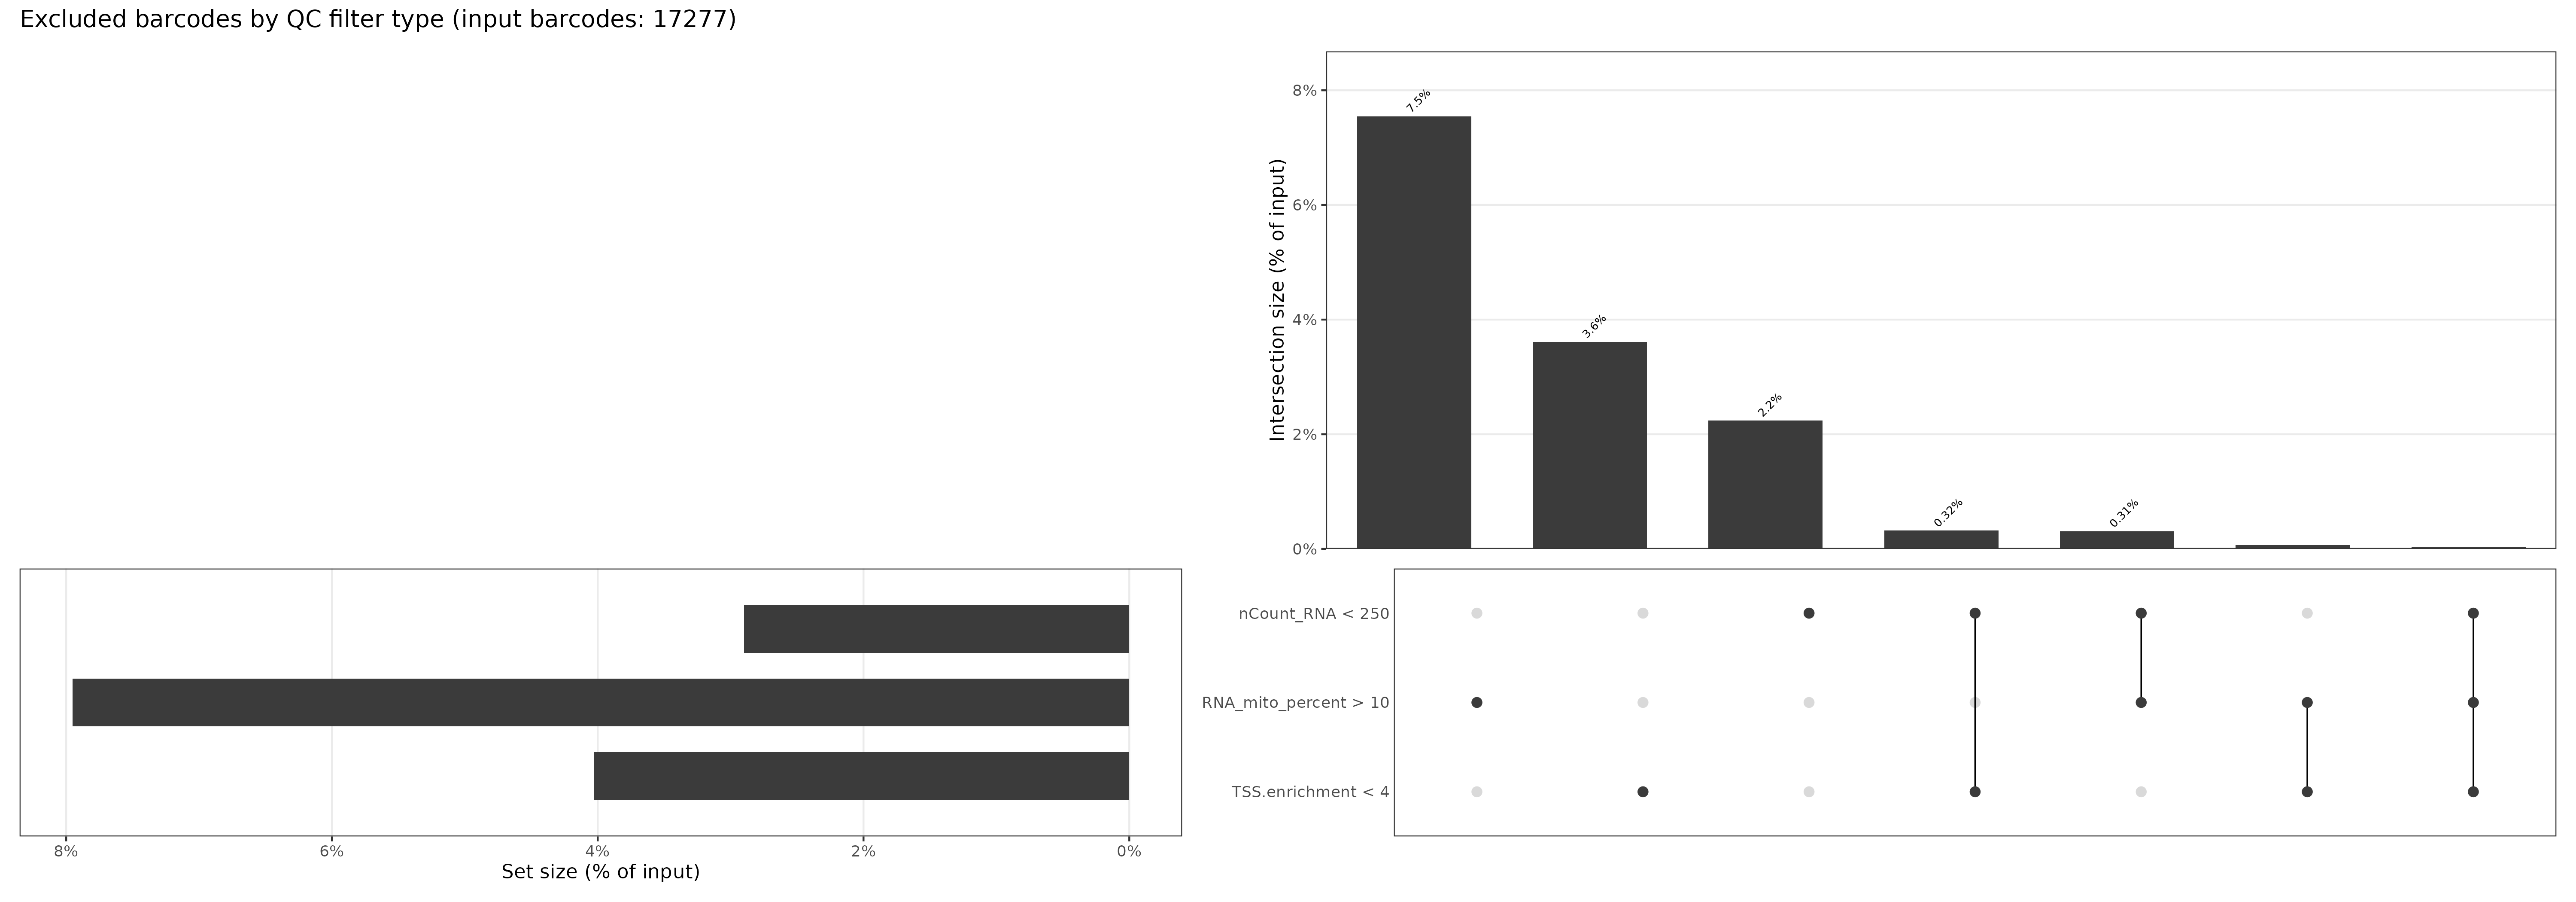
GEM-well QC exclusion overlaps
Shows the overlap between pre-aggregation filters among Cell Ranger-called cells entering the two-GEM-well aggregation.
aggregation_excluded_cellranger_only_barcodes_by_type_upset.immune_human_2x
Aggregation-level RNA dimension-reduction and cell-type review outputs.
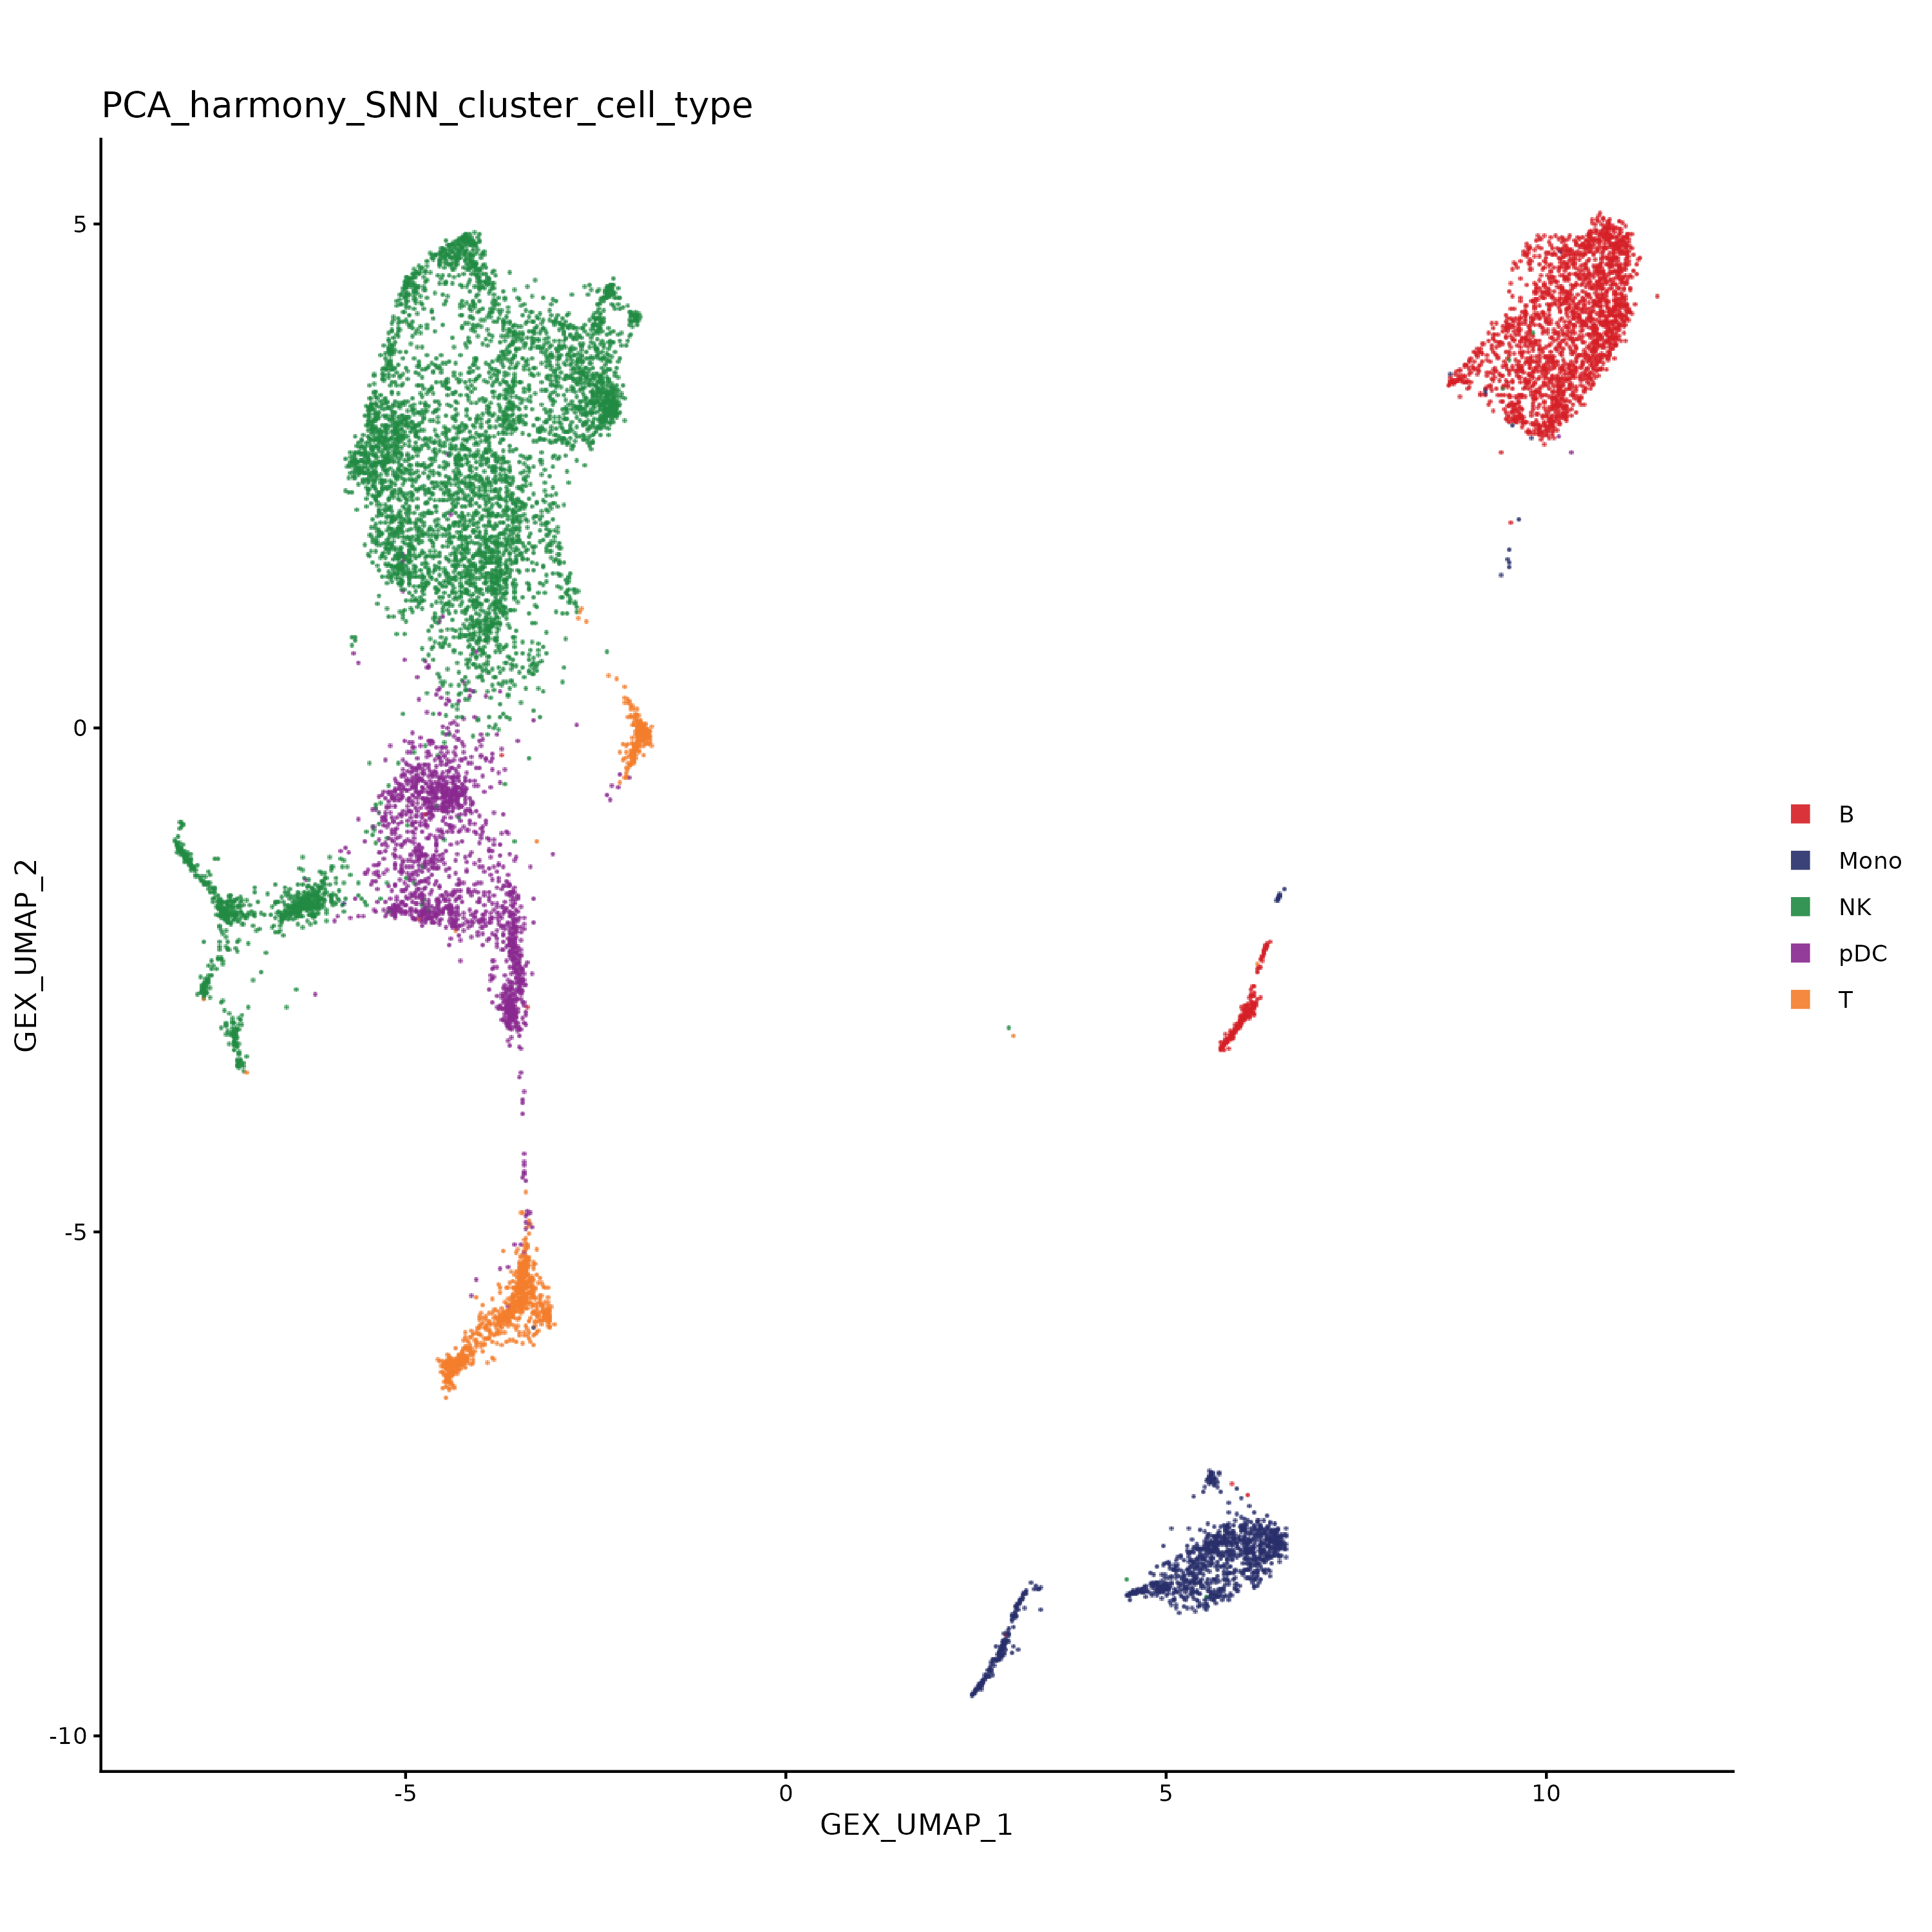
Harmony UMAP
Shows the gene-expression embedding and accepted cell-type labels for the two-GEM-well aggregation.
harmony.categorical.UMAPs.GEX.immune_human_2x
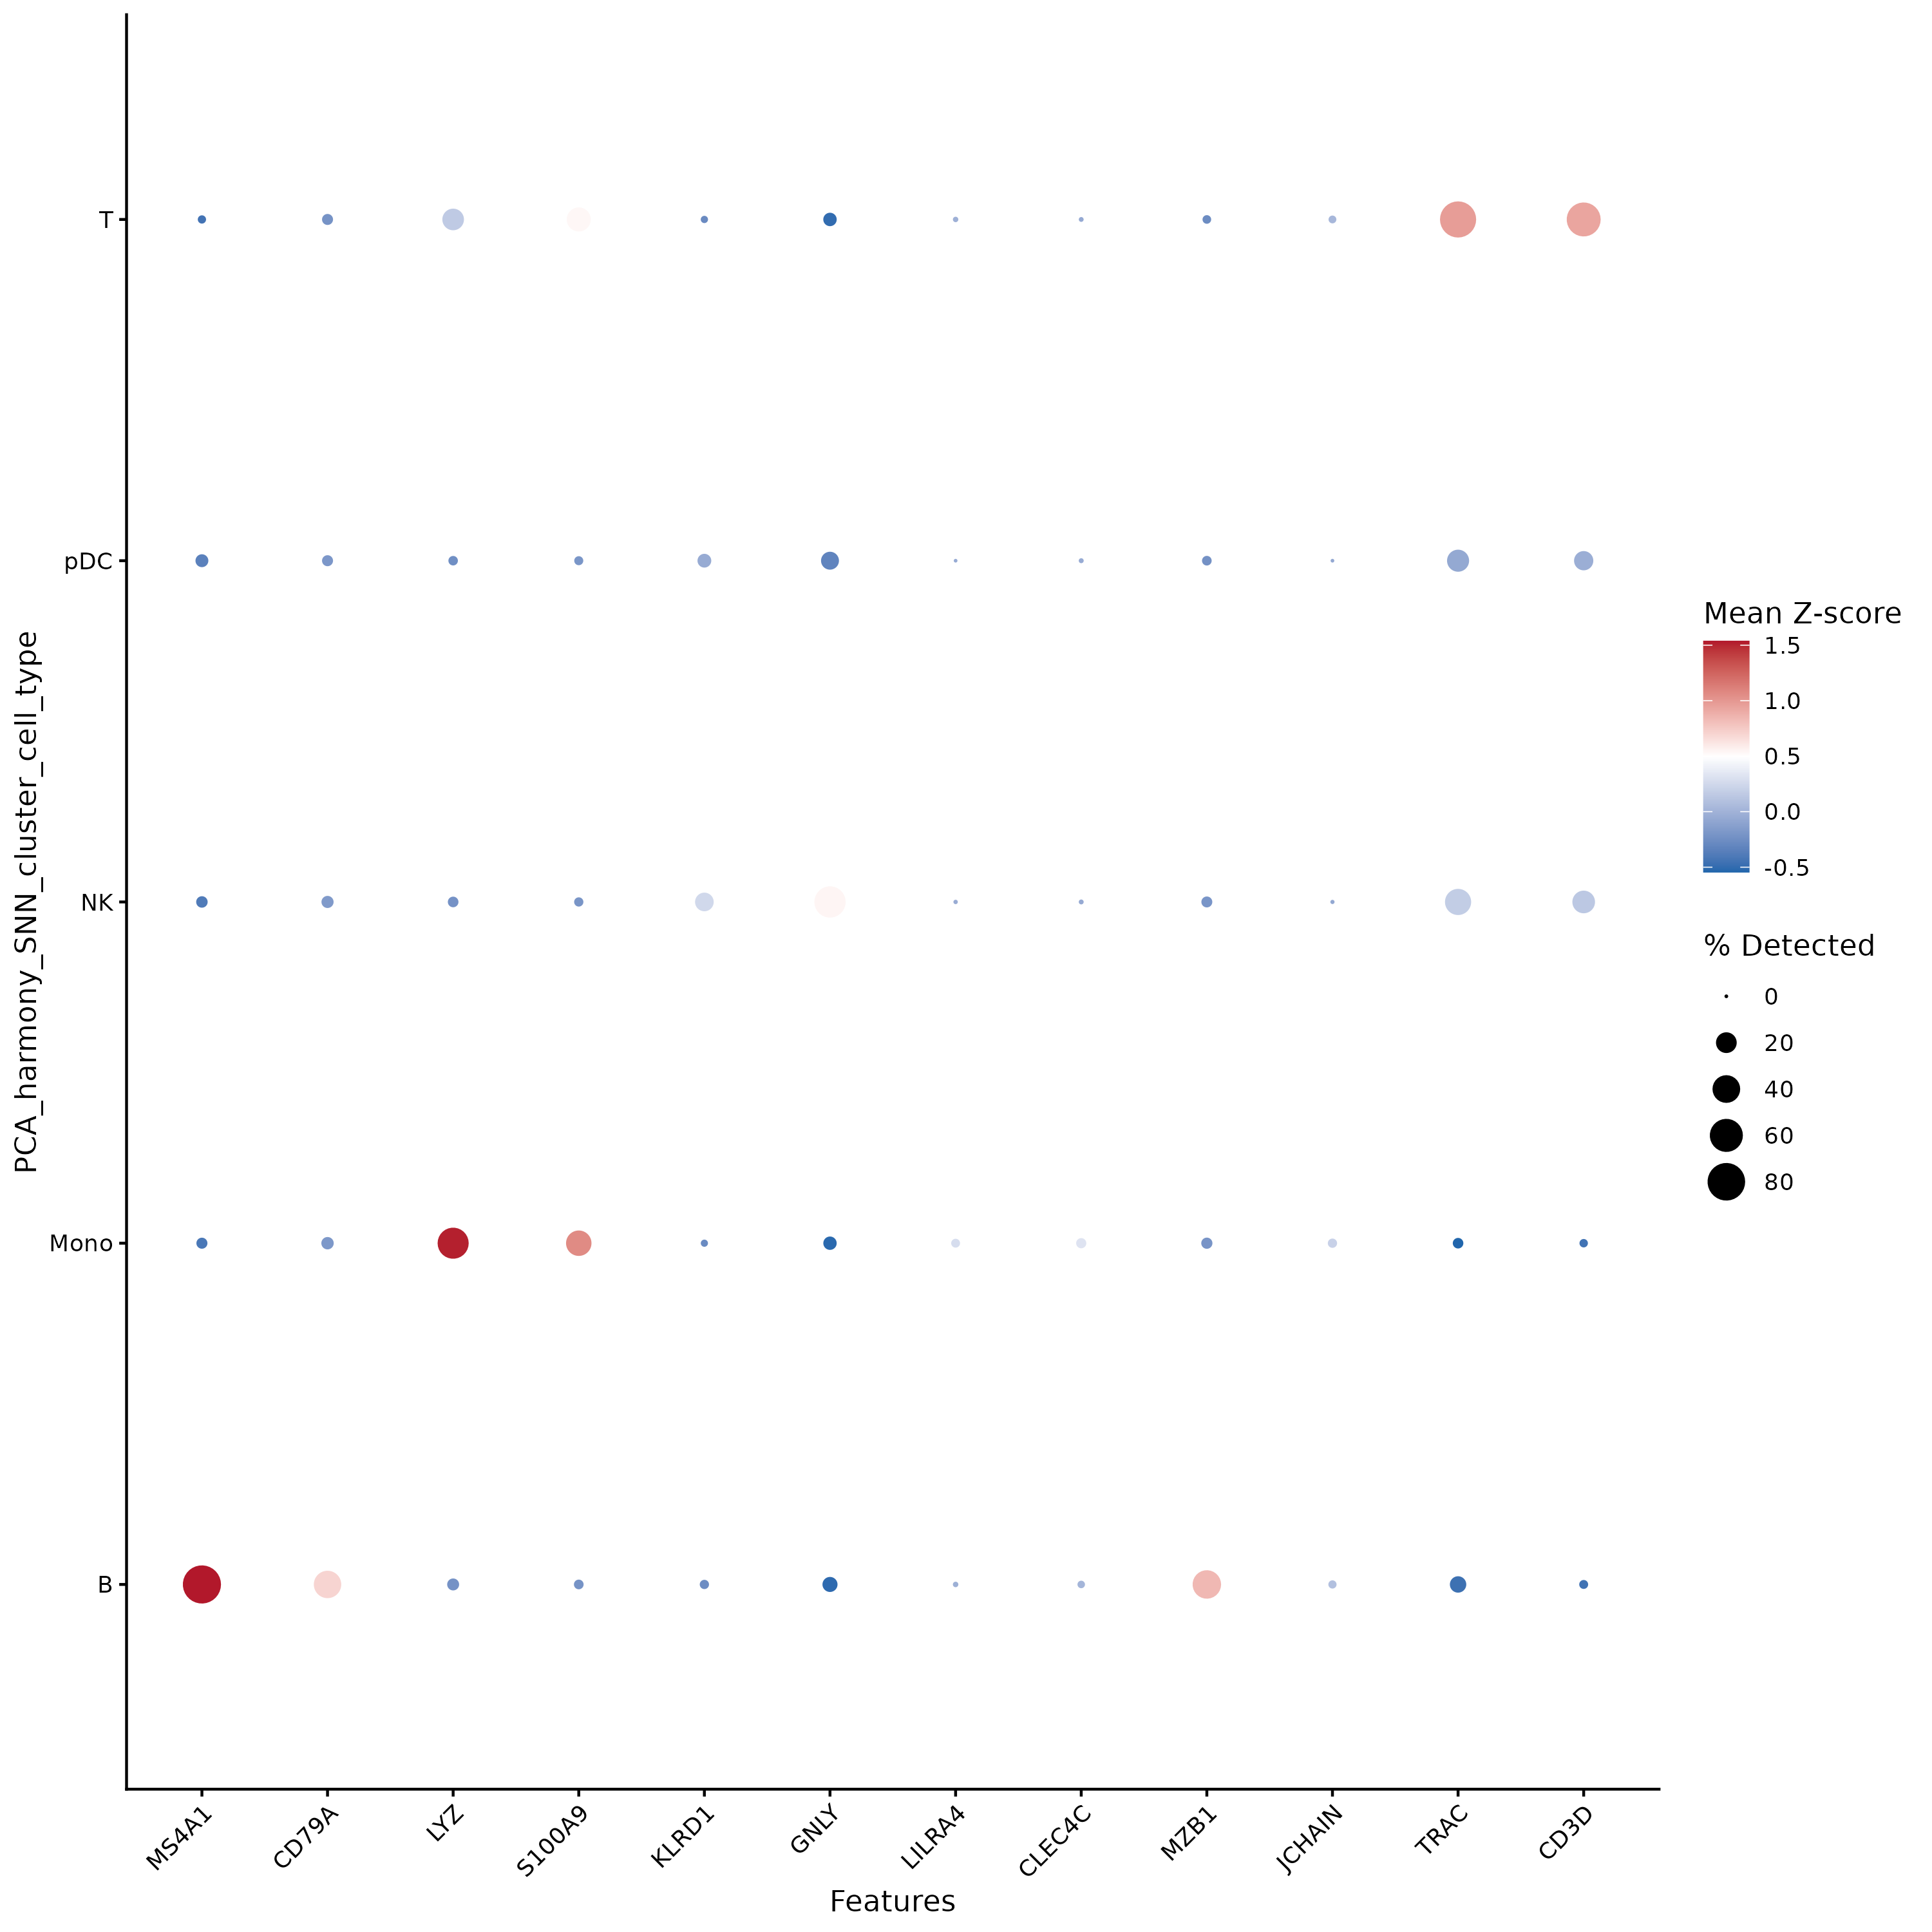
Marker dot plot
Highlights marker gene patterns used to evaluate the inferred GEX cell types.
markers_dot_plot.GEX.immune_human_2x
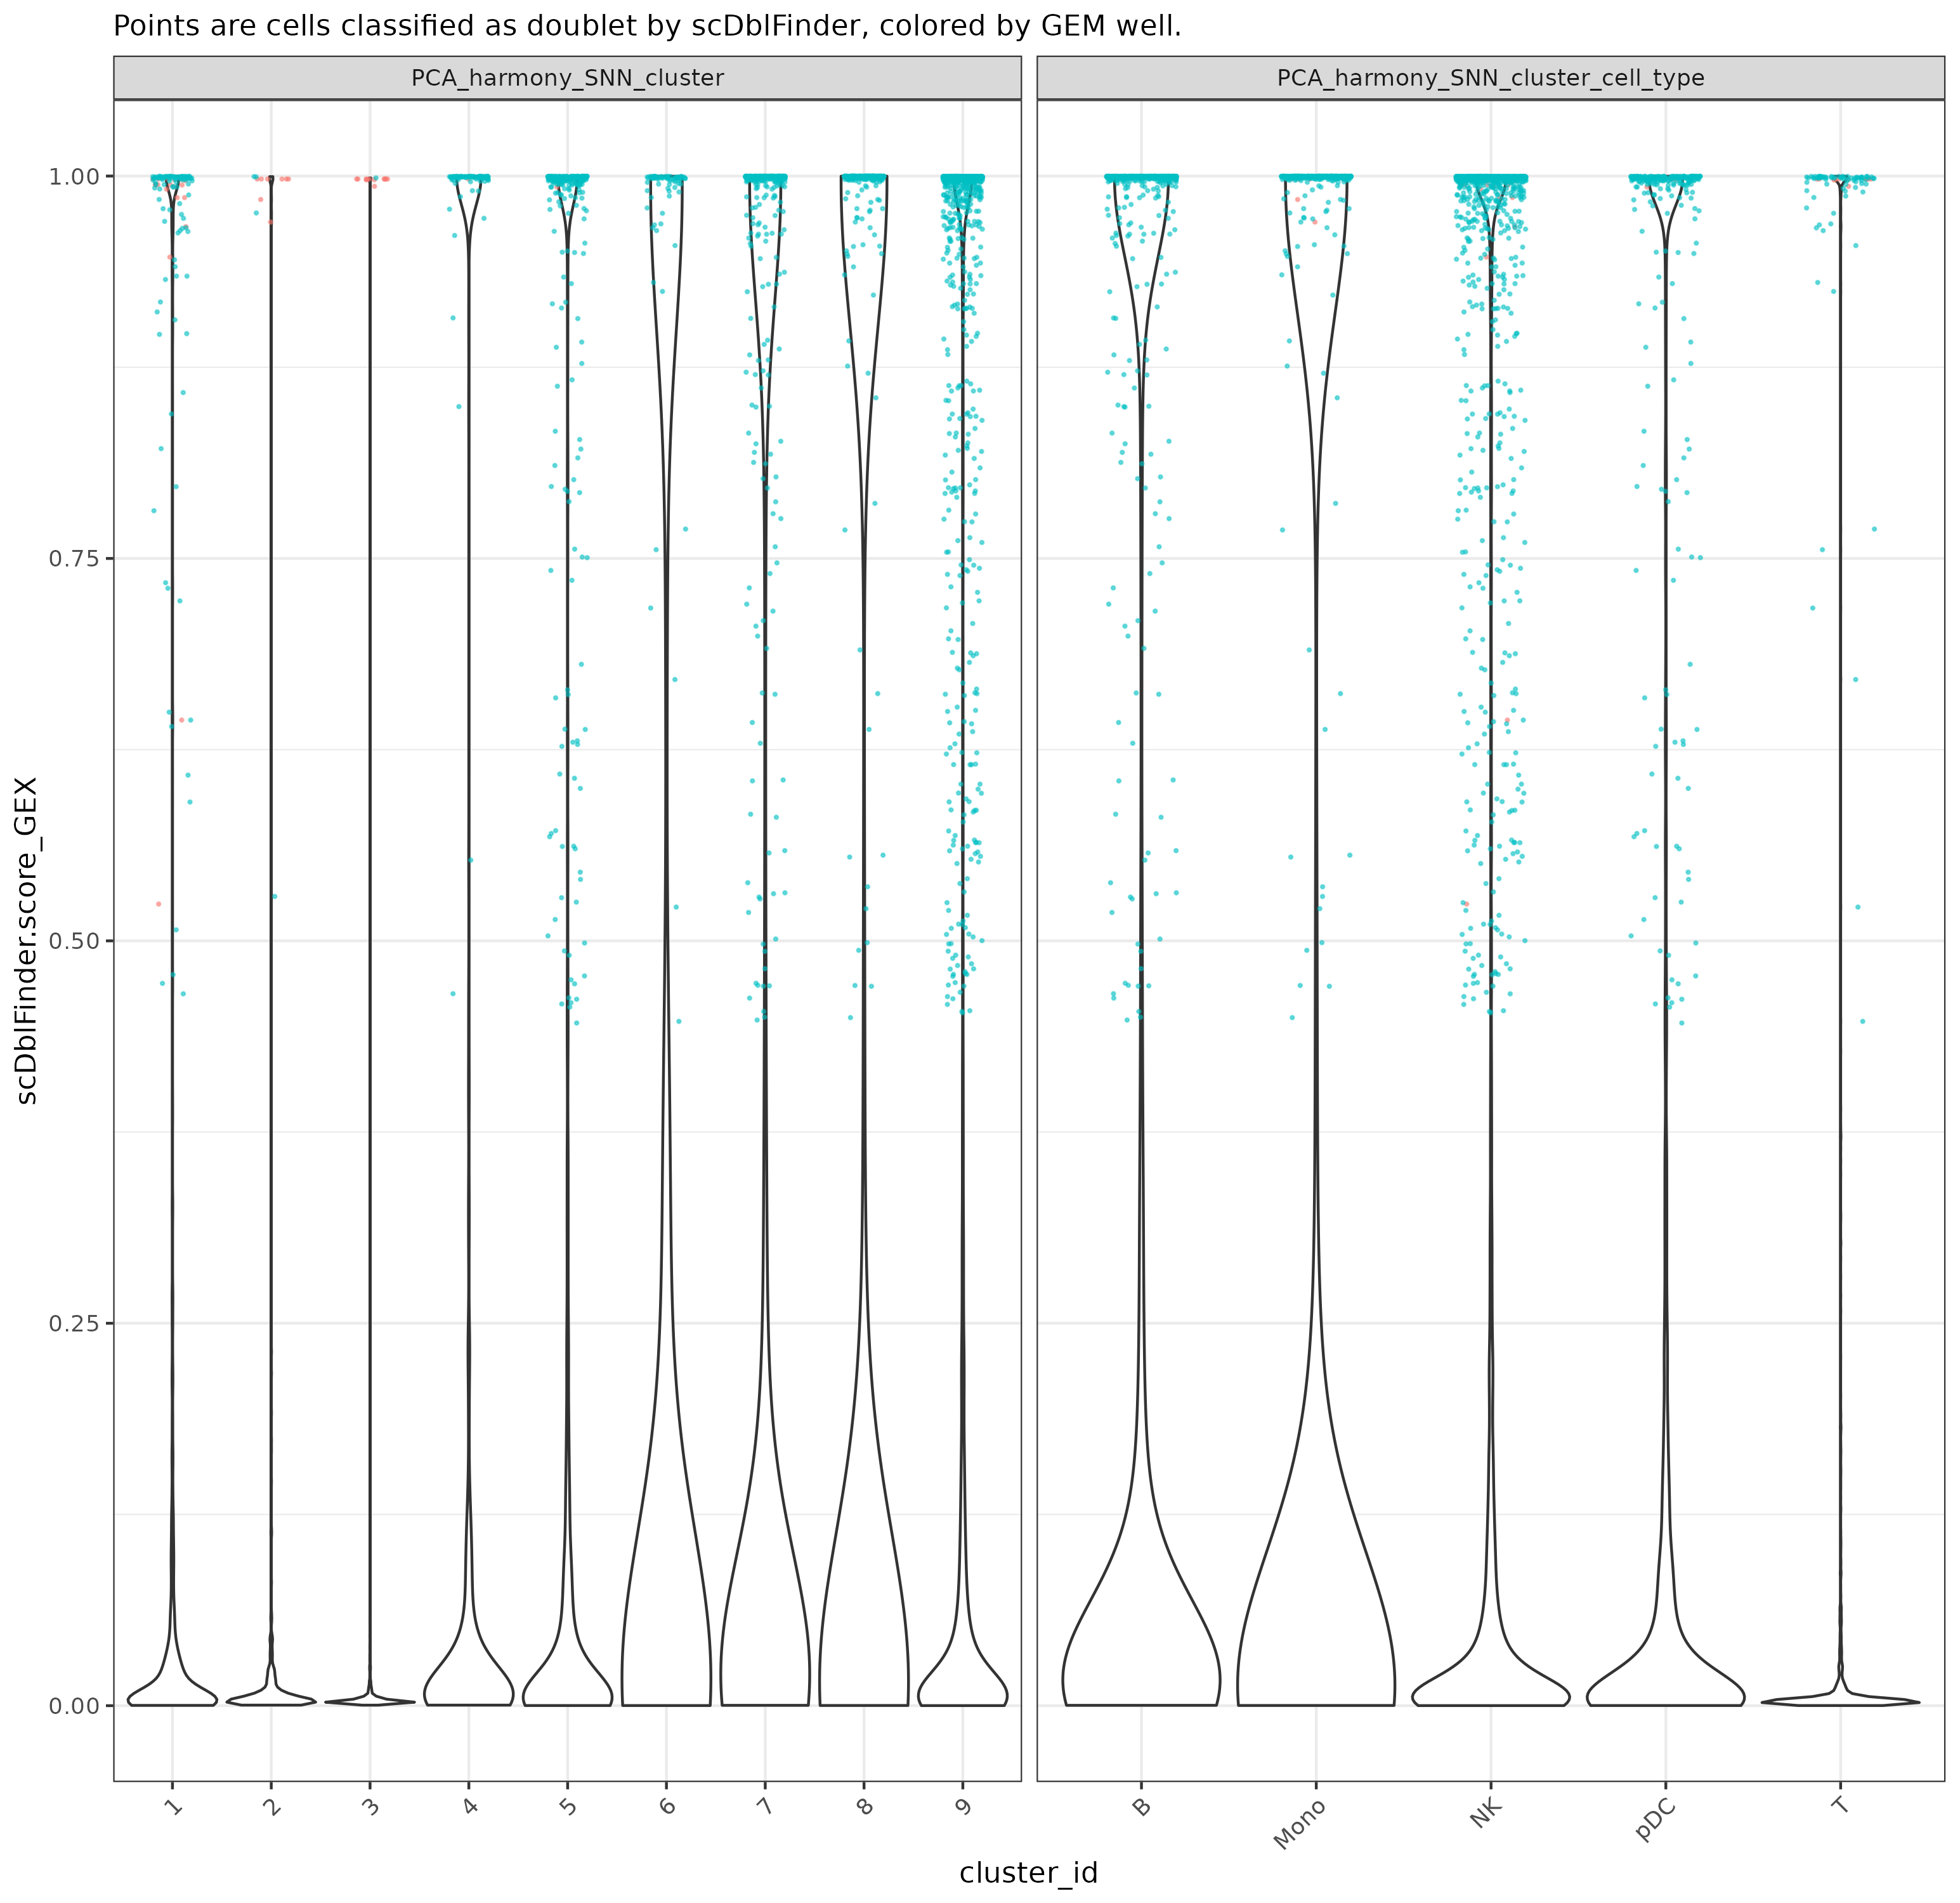
scDblFinder scores
Compares GEX doublet scores and calls across clusters and cell types before choosing a removal policy.
scDblFinder_score_violins_plot.GEX.immune_human_2x
Peak-based ATAC distributions used to choose aggregation-level QC expressions.
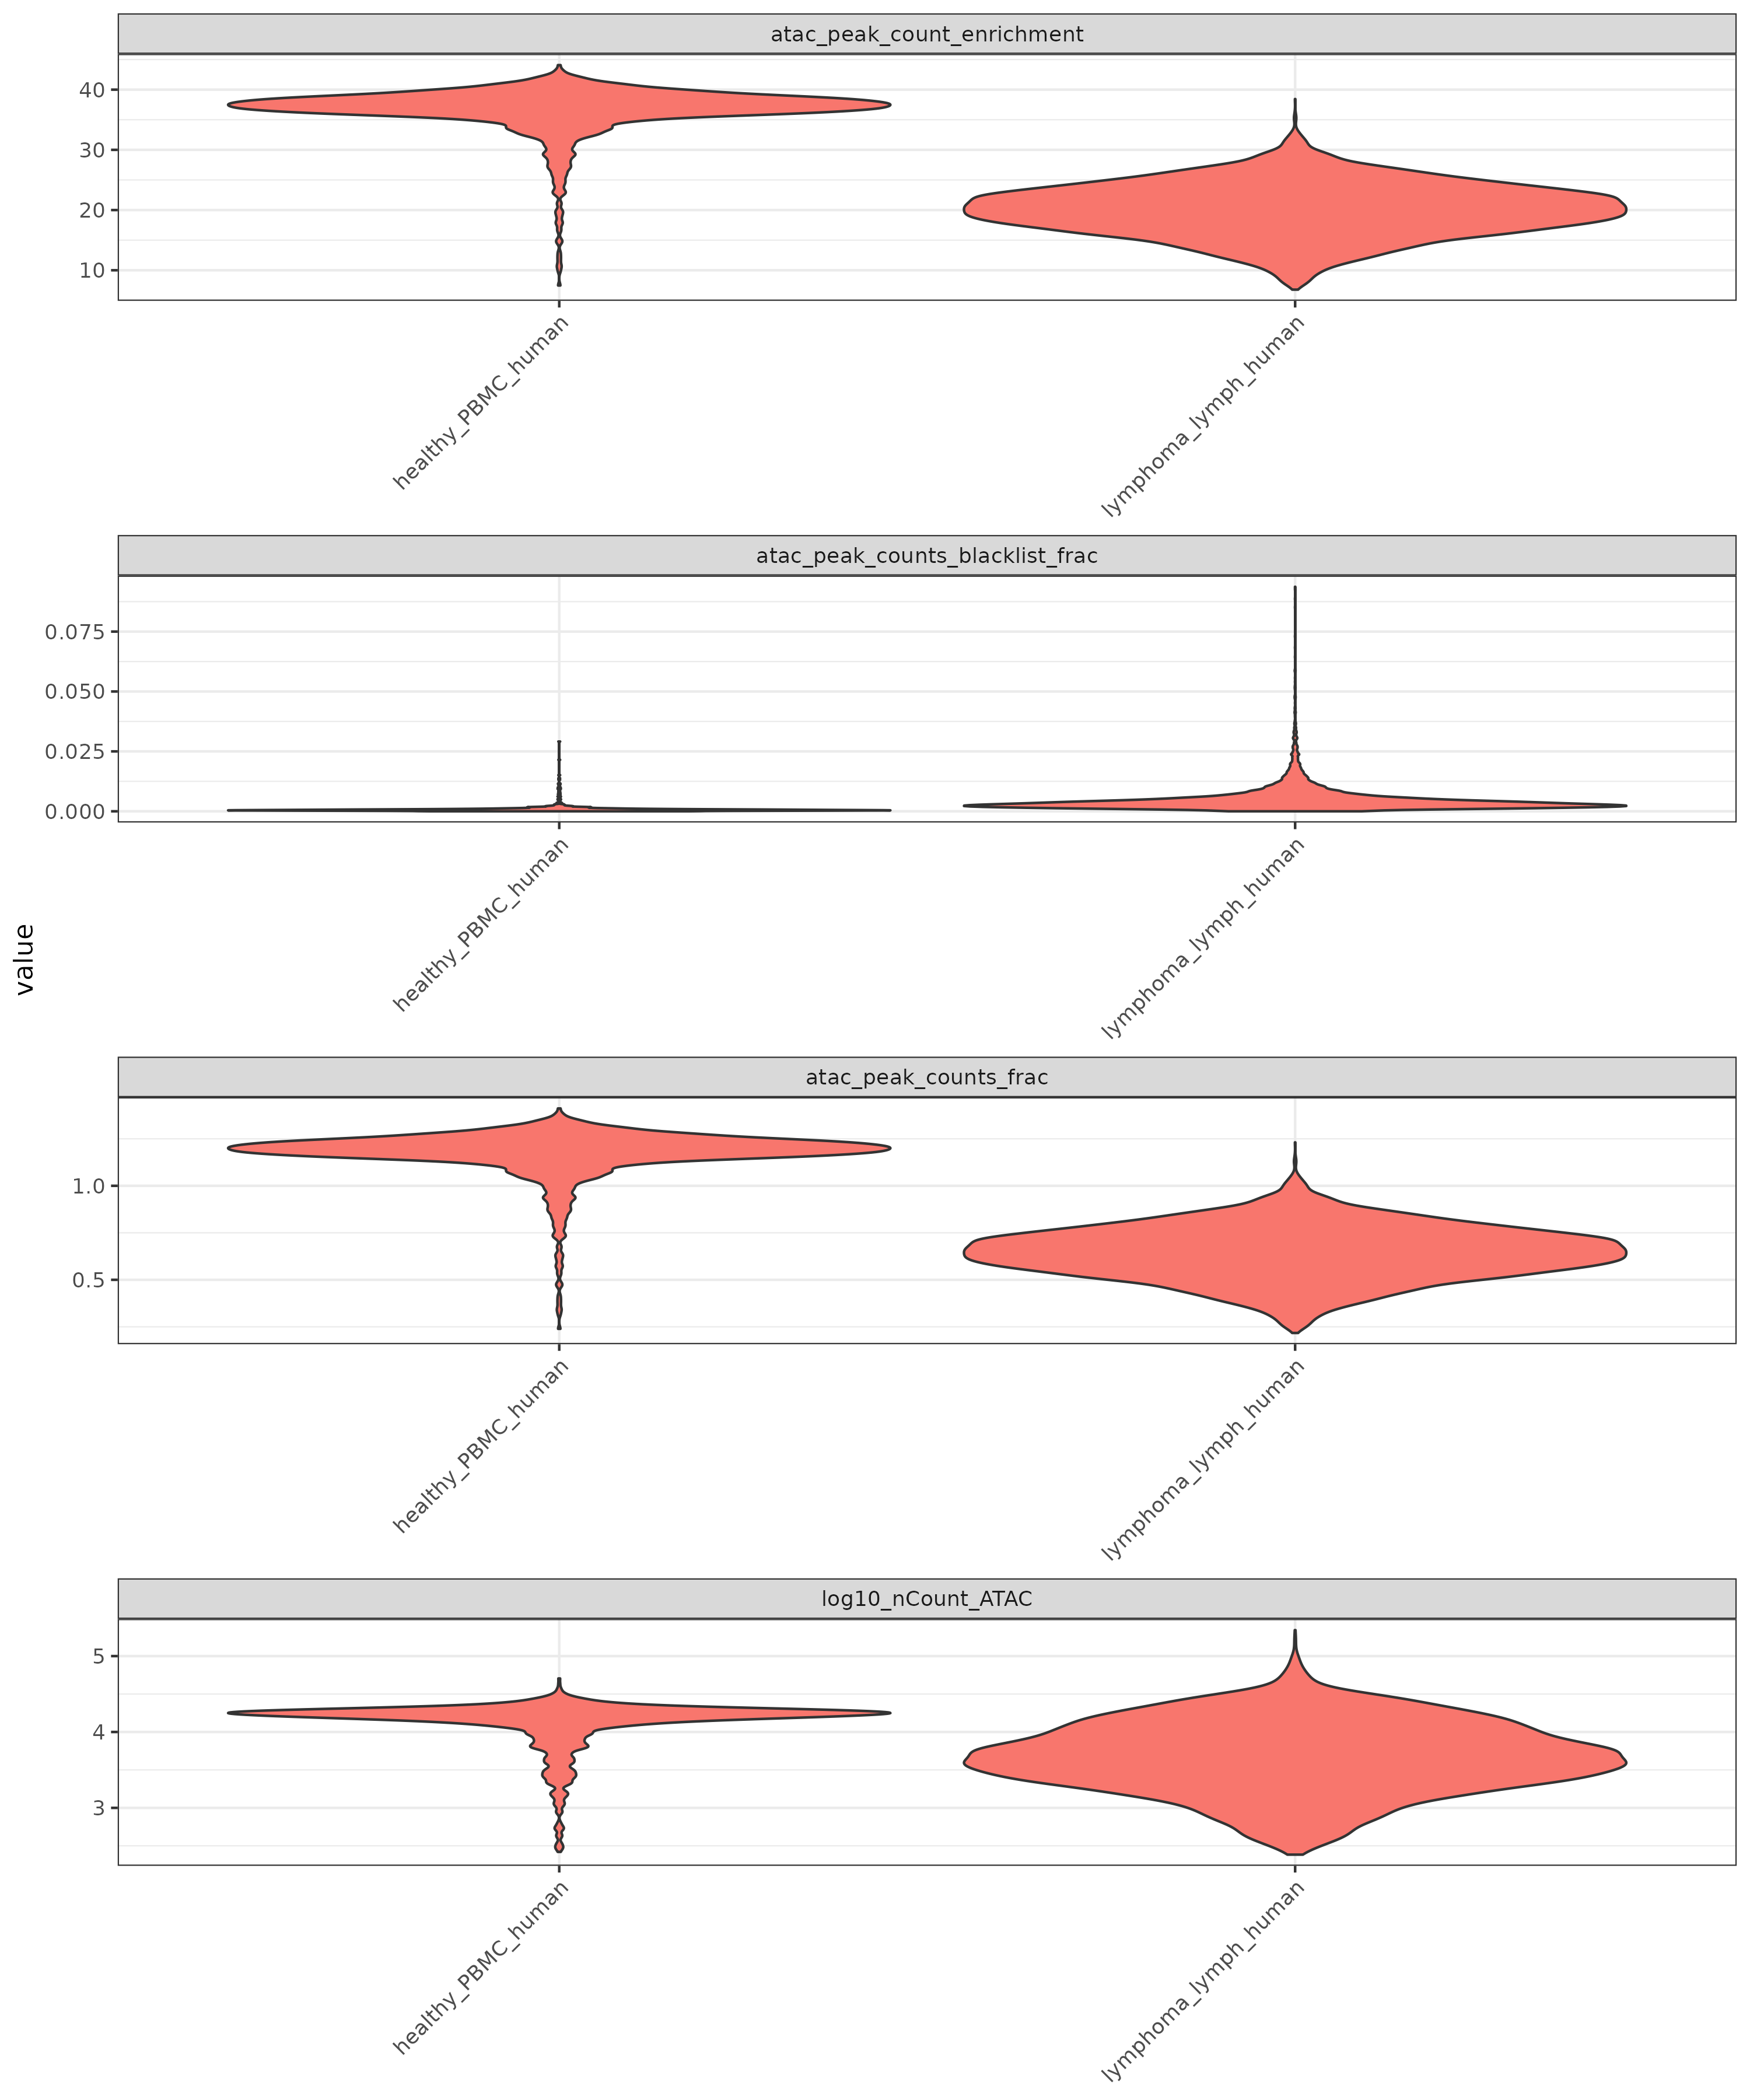
Peak-based QC distributions
Compares peak enrichment, blacklist fraction, peak fraction, and ATAC counts across the two demo GEM wells before peak-based filtering.
peaks_QC_violins_plot.ATAC.immune_human_2x
Applied peak-based filters and the cells retained for ATAC dimensionality reduction.
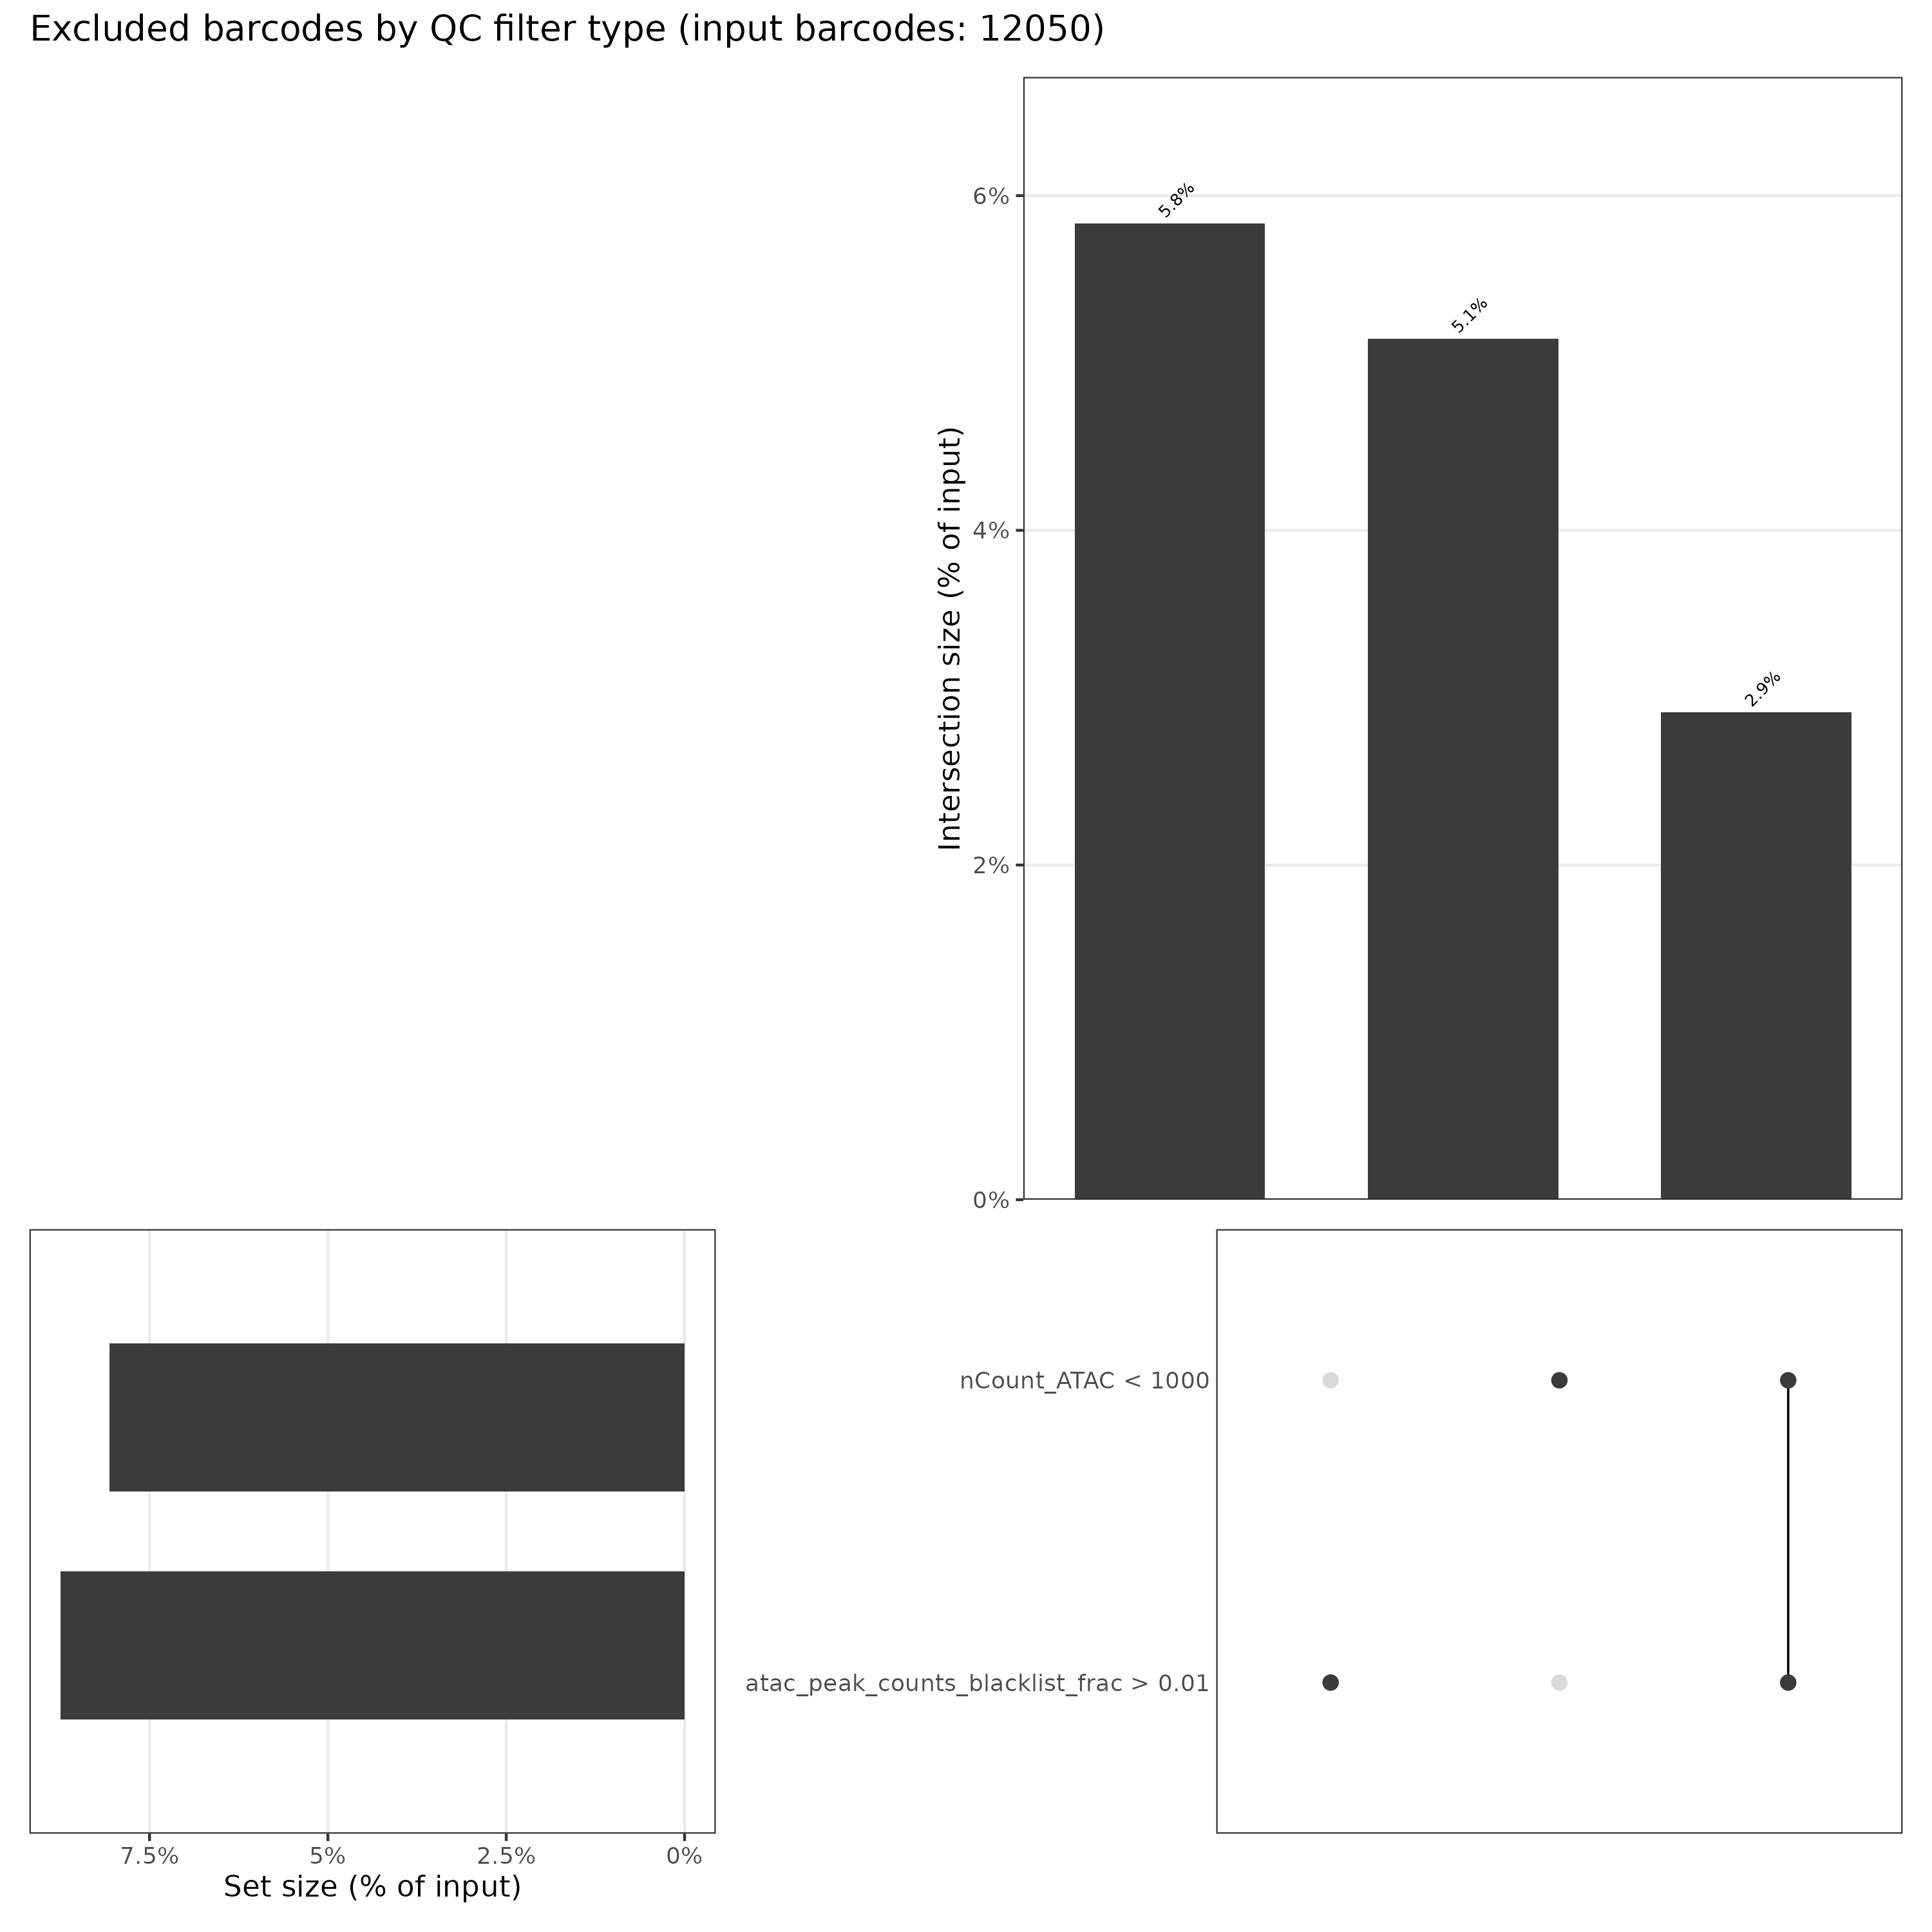
Peak-QC exclusion overlaps
Shows the overlap between aggregation-level peak-QC filters before LSI and ATAC clustering.
QC_excluded_upset_plot.ATAC.immune_human_2x
Aggregation-level chromatin-accessibility dimension-reduction outputs.
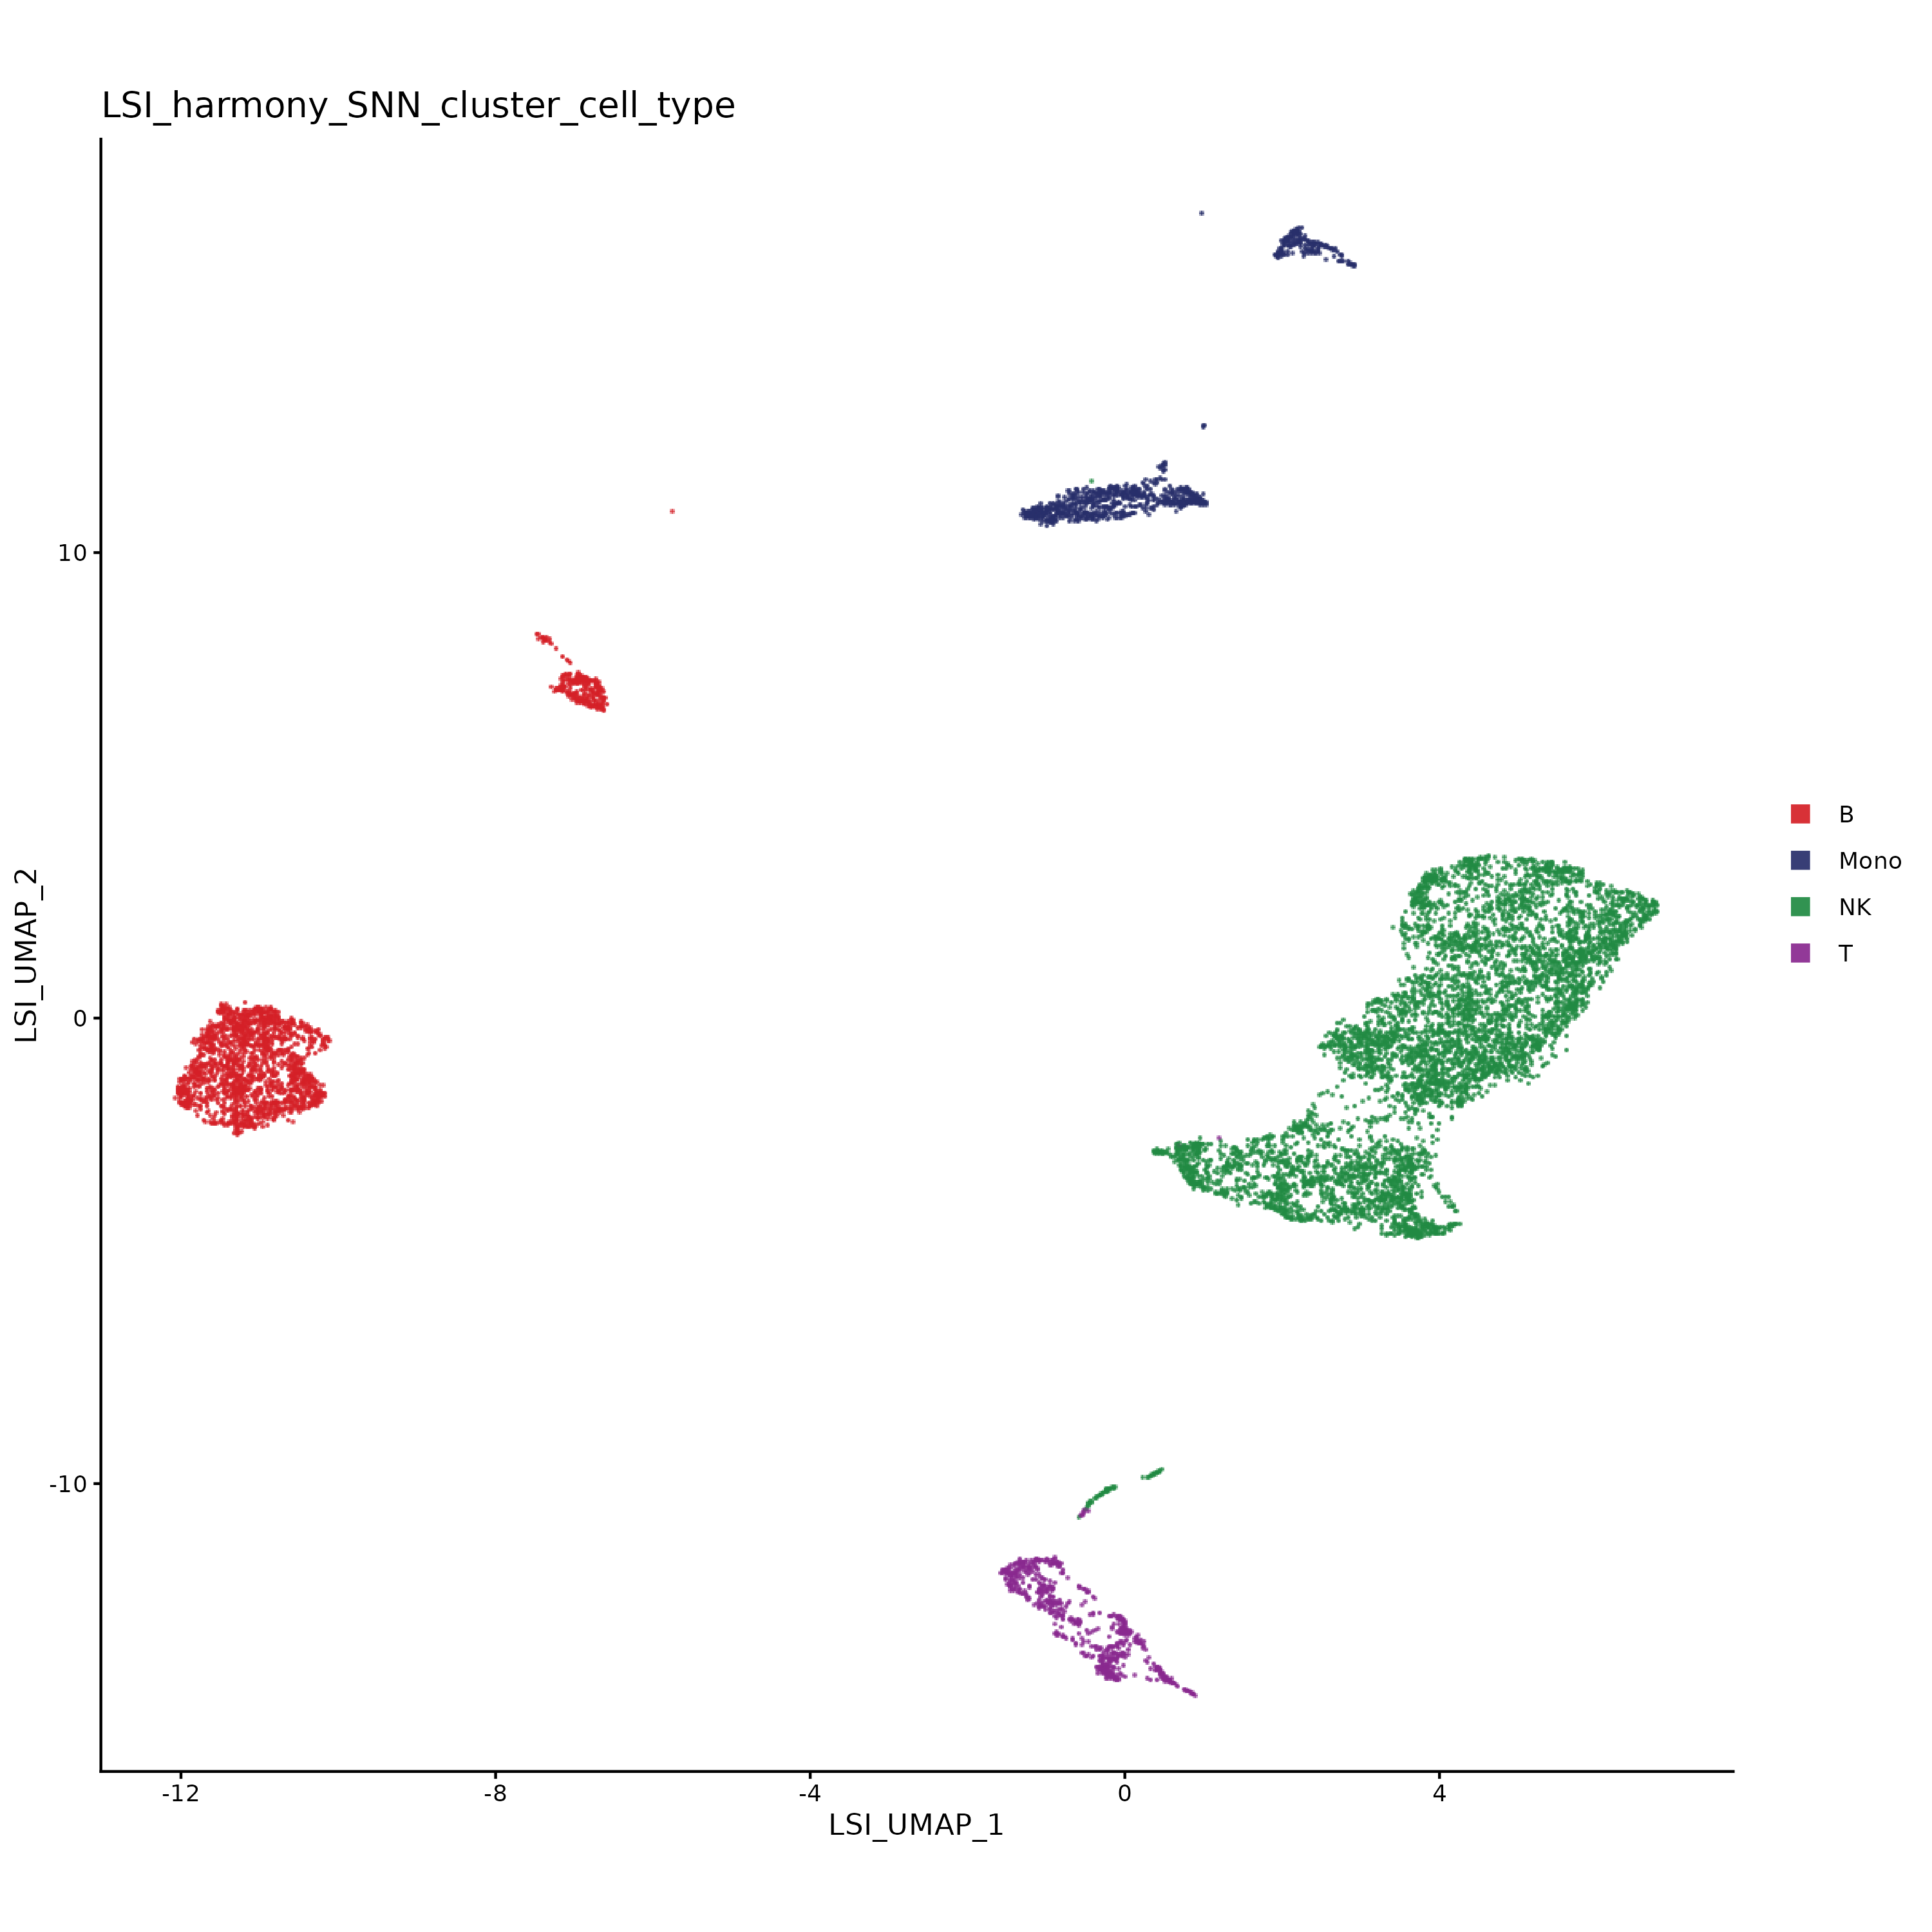
Harmony UMAP
Shows the chromatin-accessibility embedding and accepted cell-type labels for the two-GEM-well aggregation.
categorical.UMAPs.ATAC.immune_human_2x
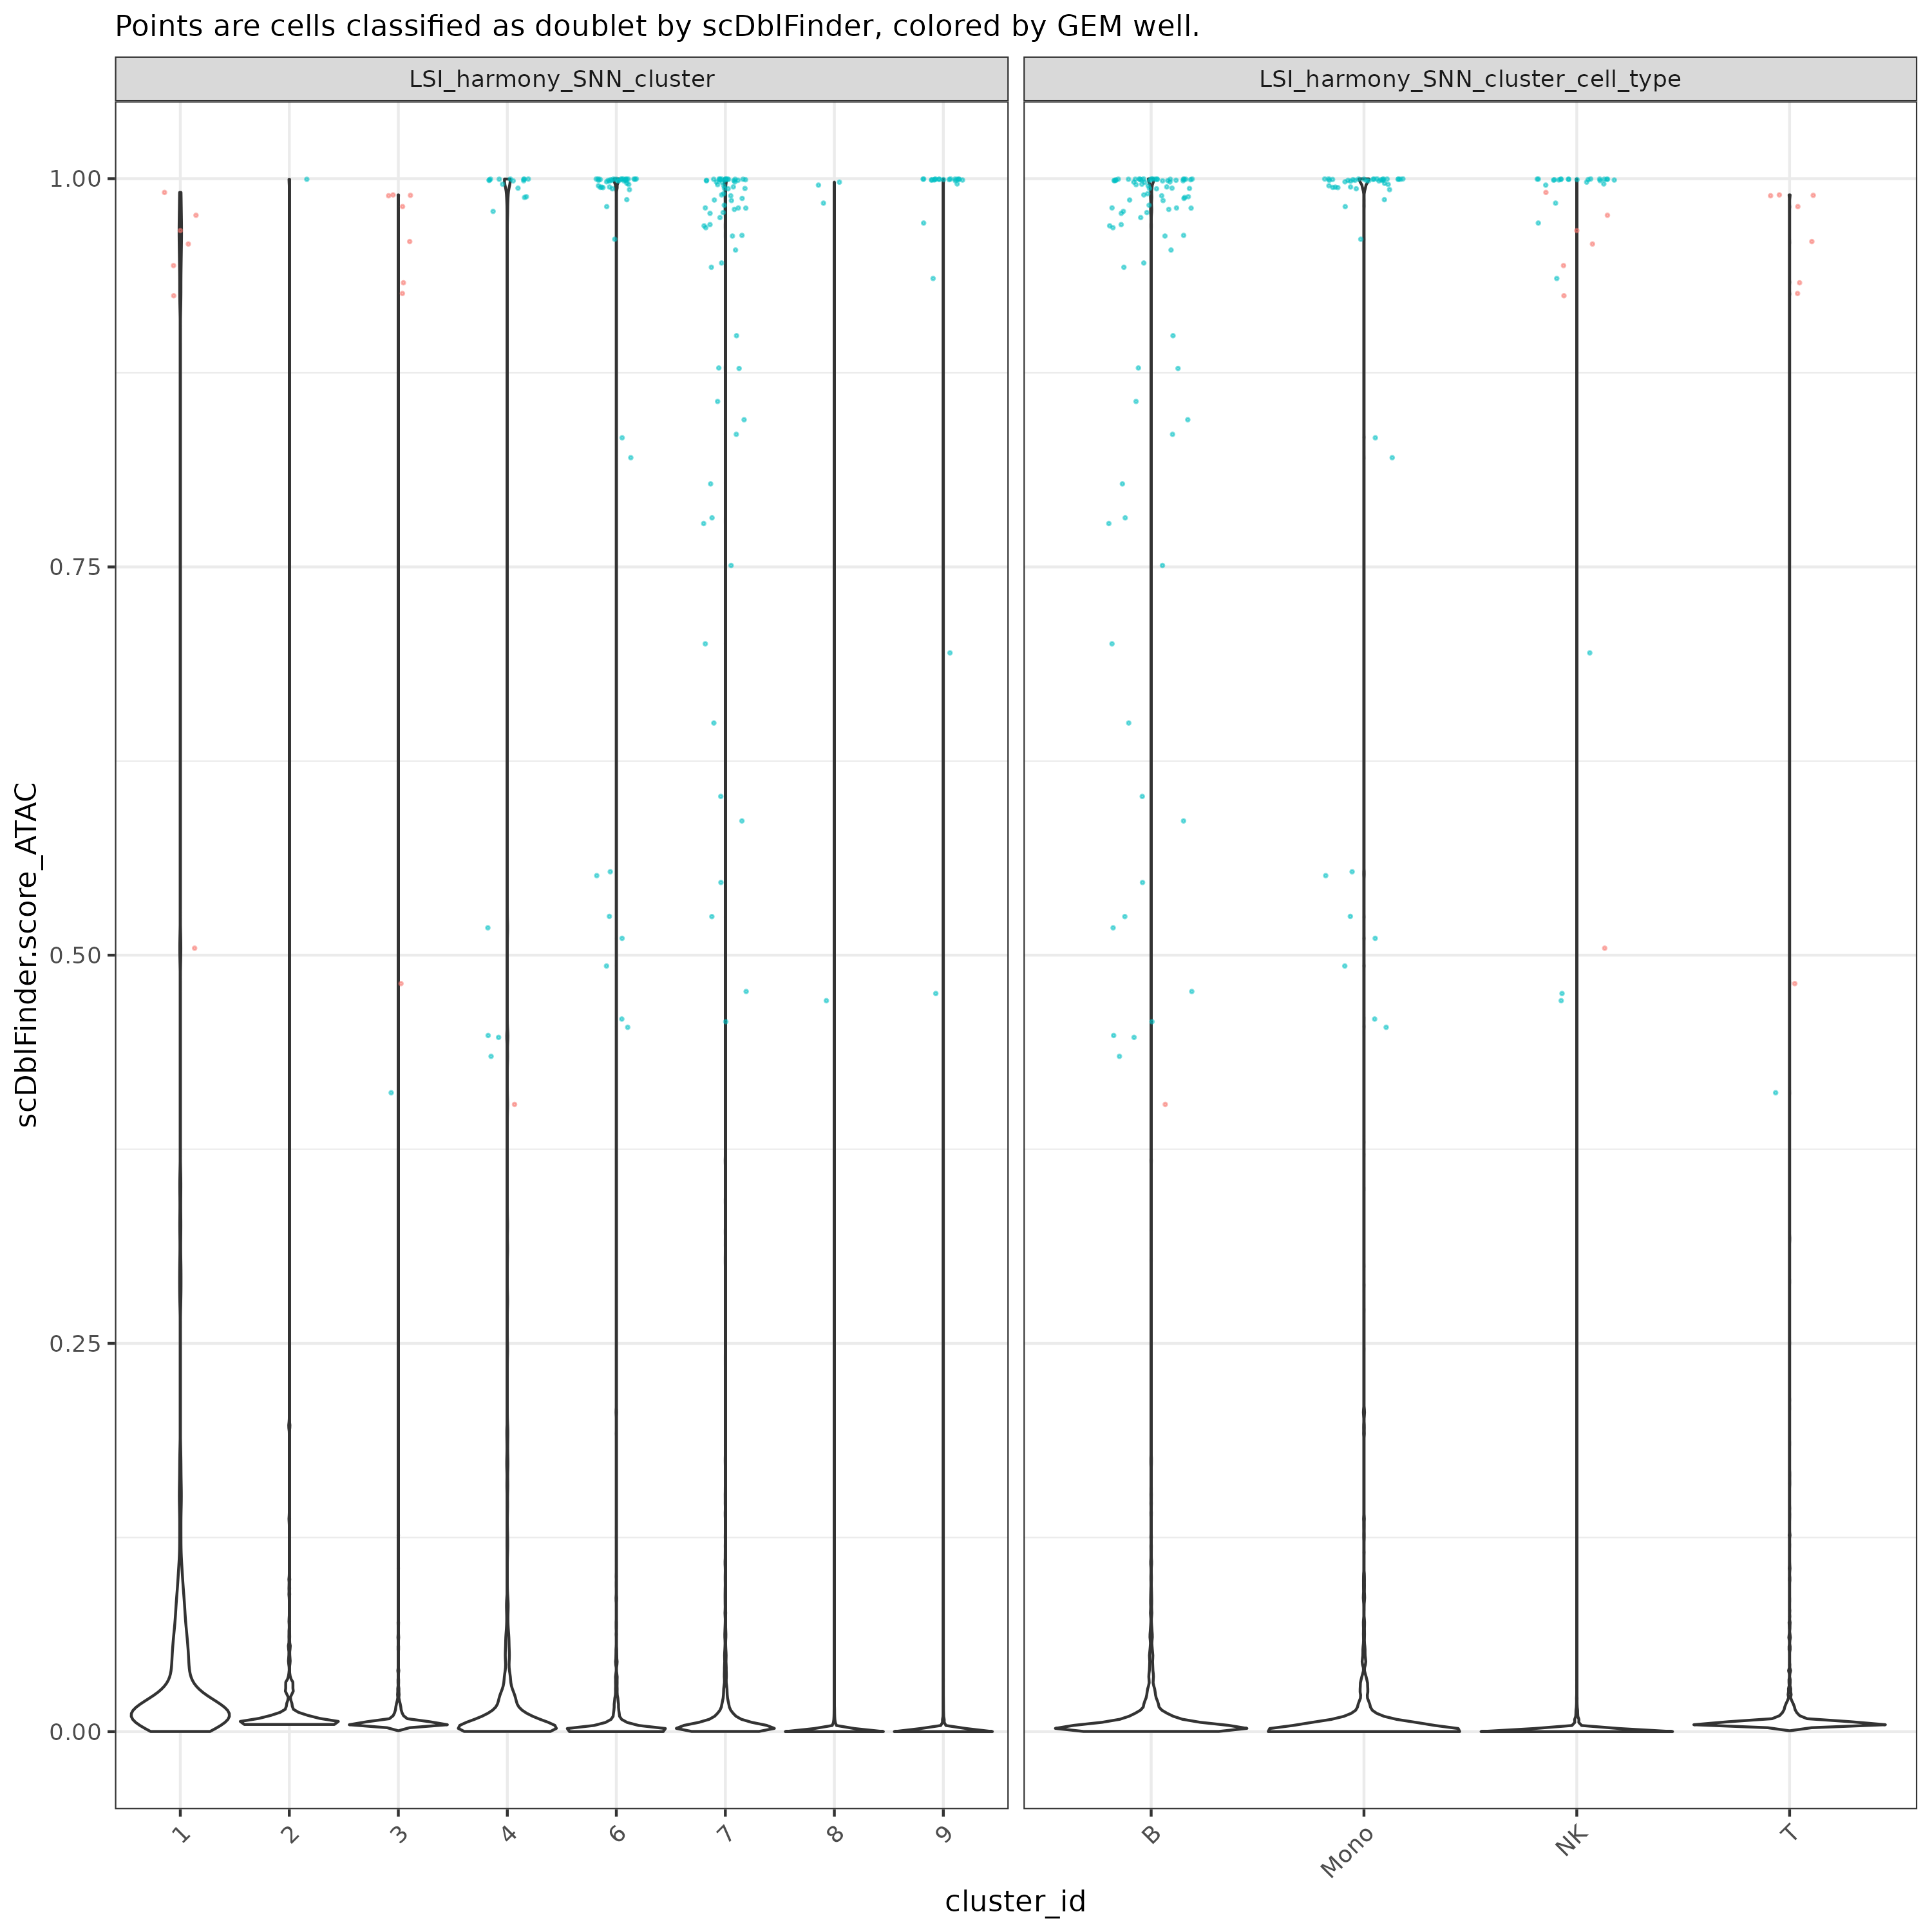
scDblFinder scores
Compares ATAC doublet scores and calls across clusters and cell types before choosing a removal policy.
scDblFinder_score_violins_plot.ATAC.immune_human_2x
Integrated multimodal structure and modality-contribution outputs.
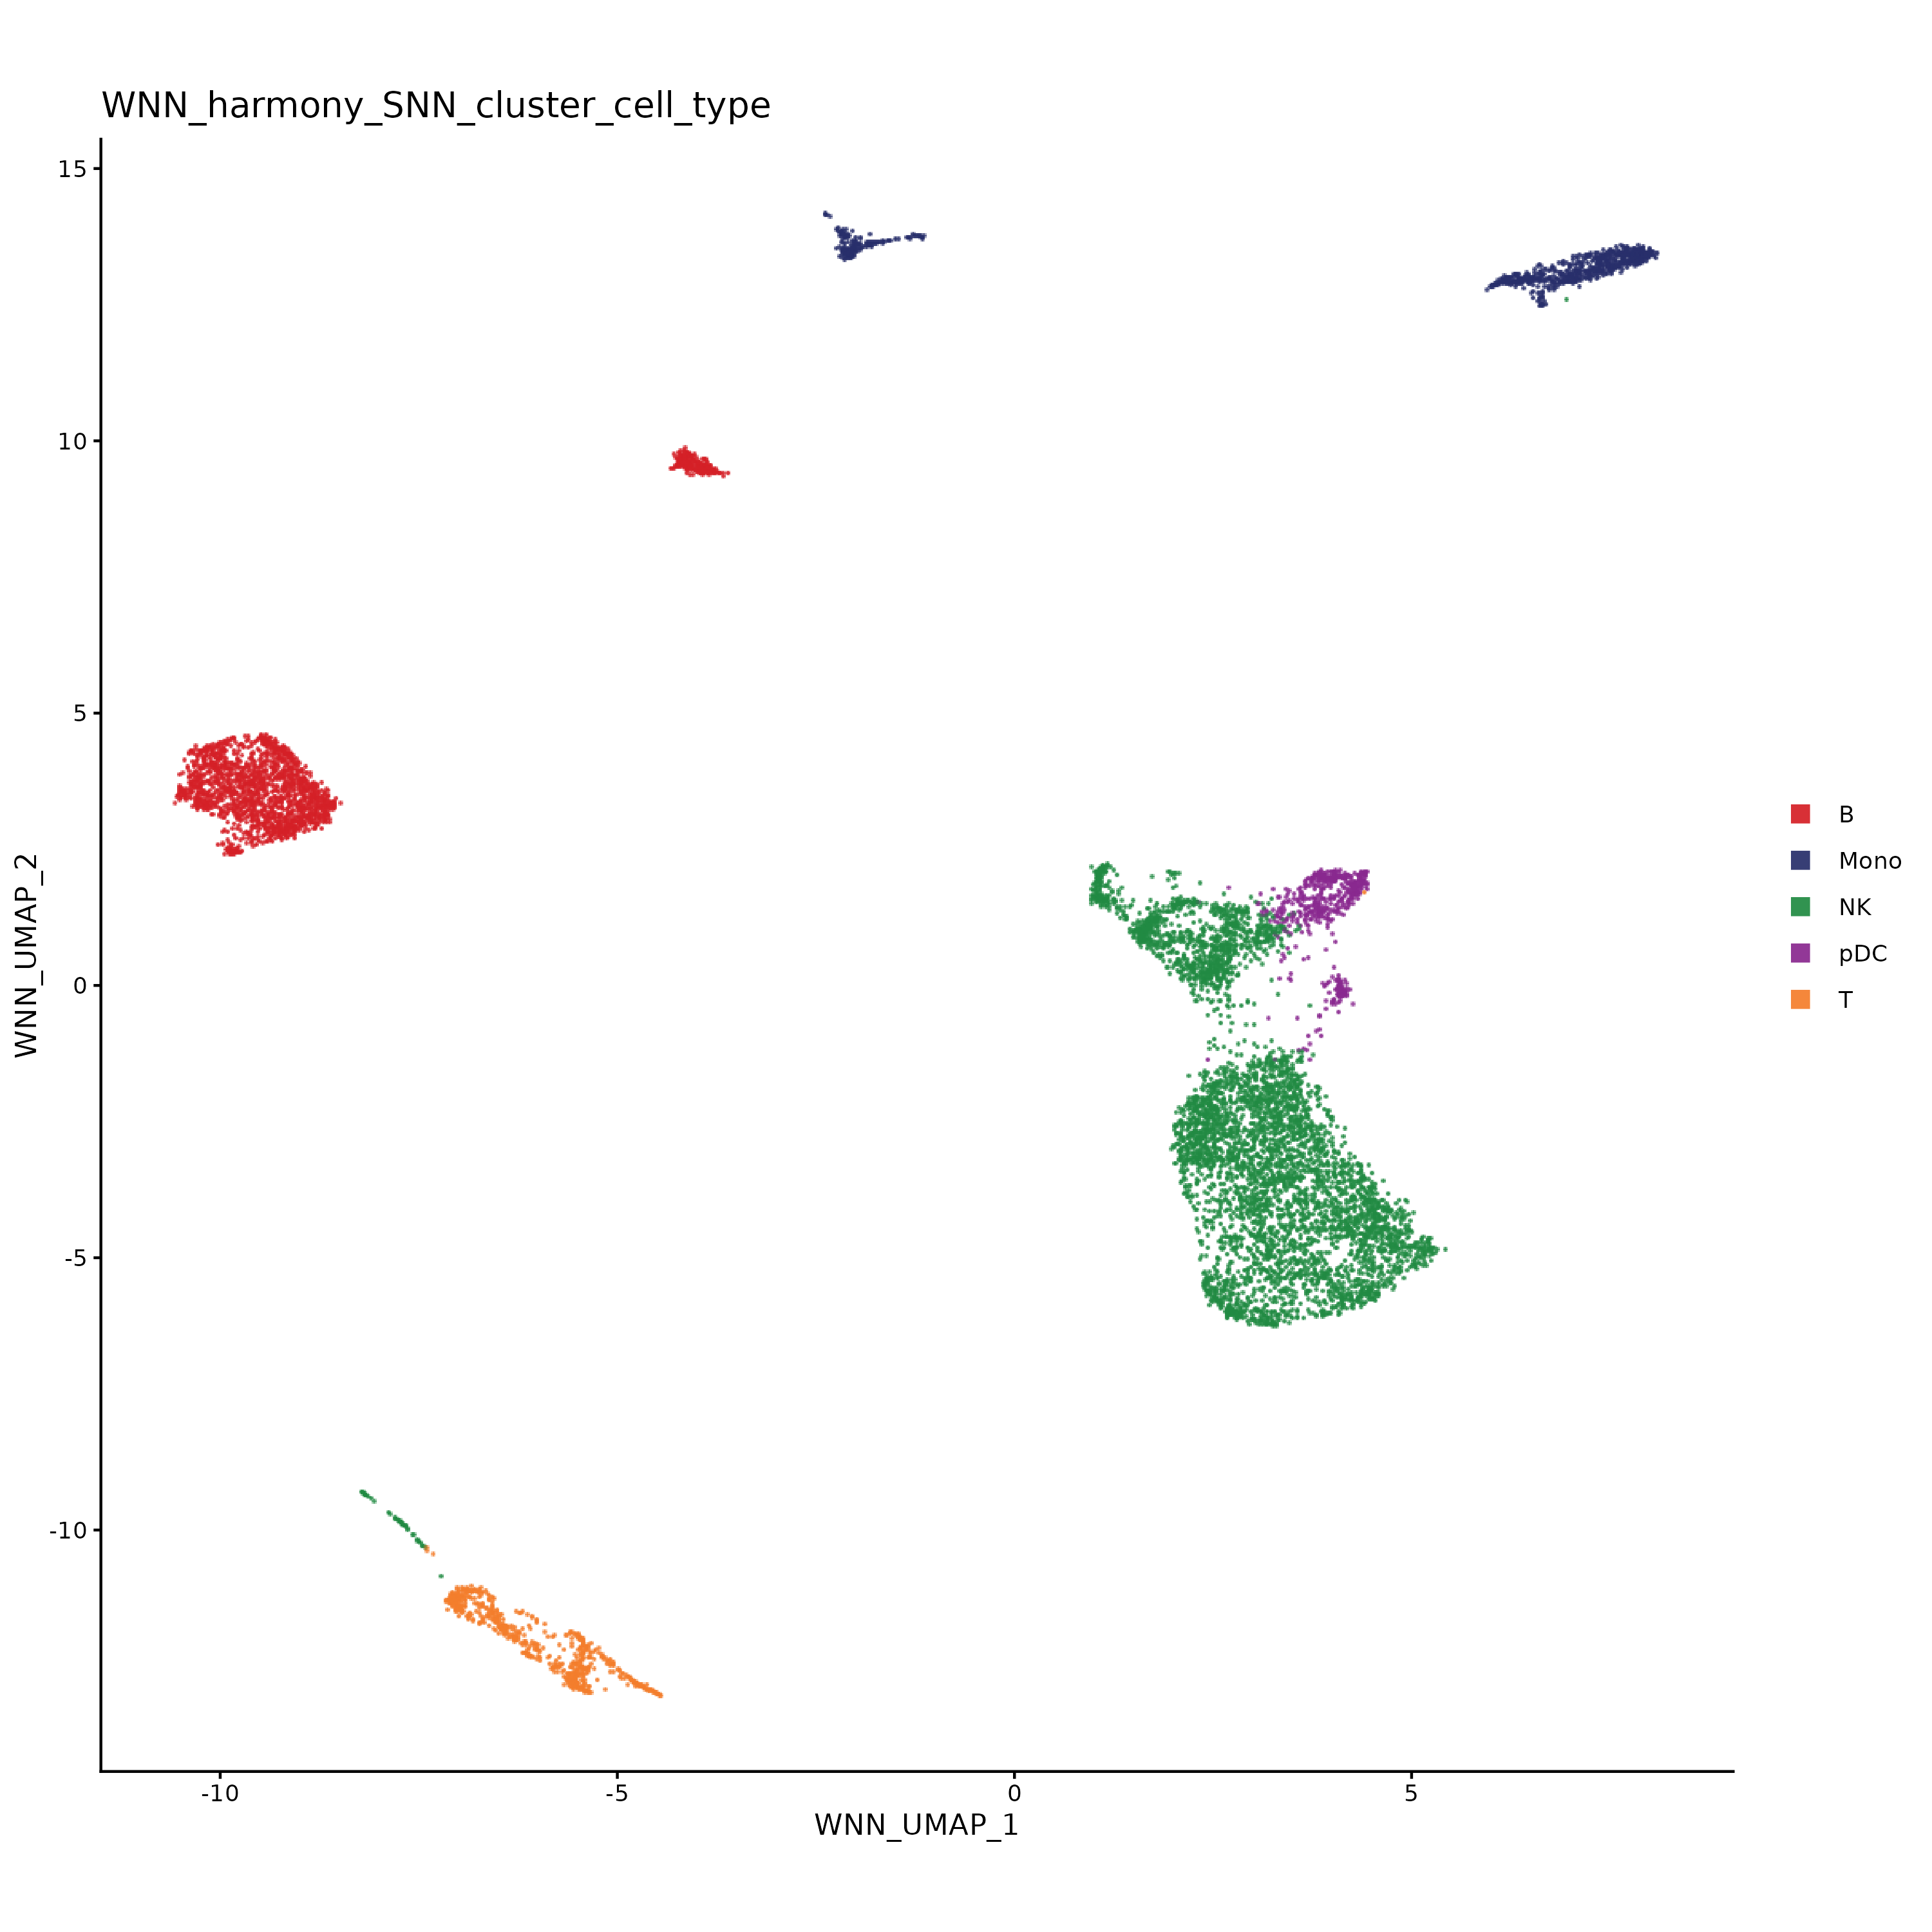
Integrated UMAP
Shows the integrated multimodal cell-state structure and accepted cell-type labels for the two-GEM-well aggregation.
categorical.UMAPs.WNN.immune_human_2x
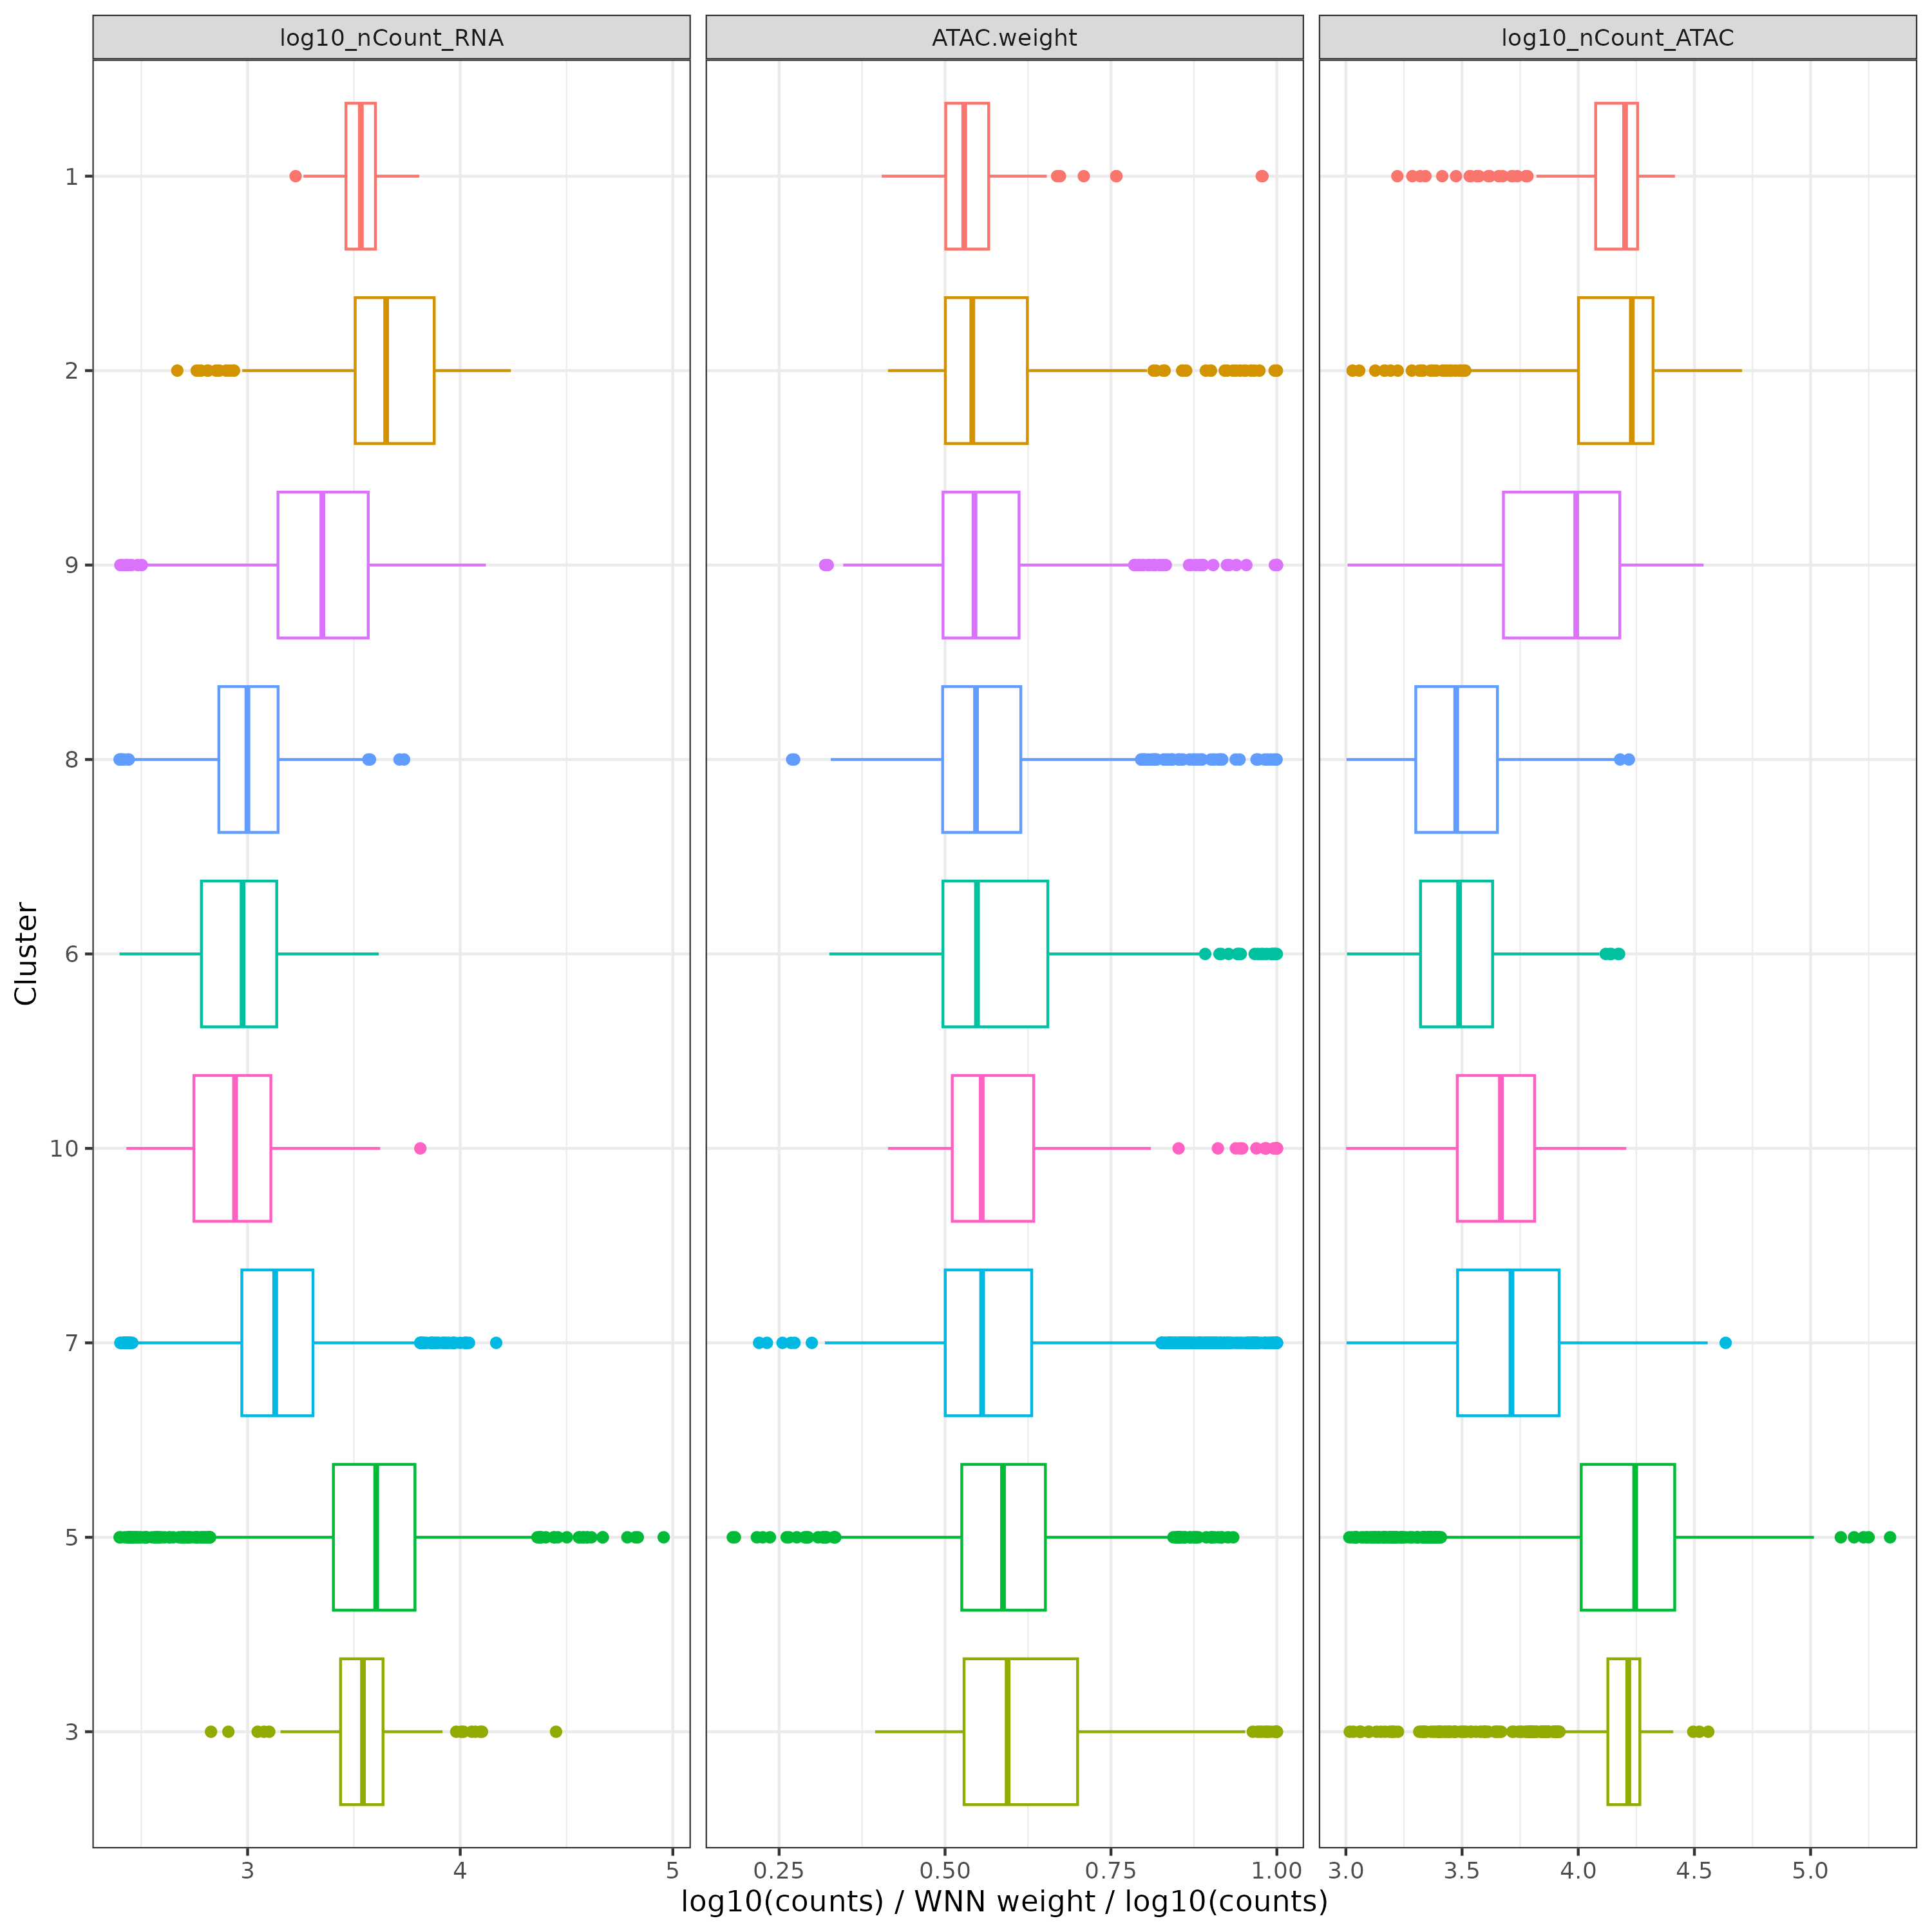
Modality weights
Shows how RNA and ATAC evidence contribute differently across cell groups in the two-GEM-well aggregation.
ATAC_vs_RNA_weight_boxplots_plot.WNN.immune_human_2x