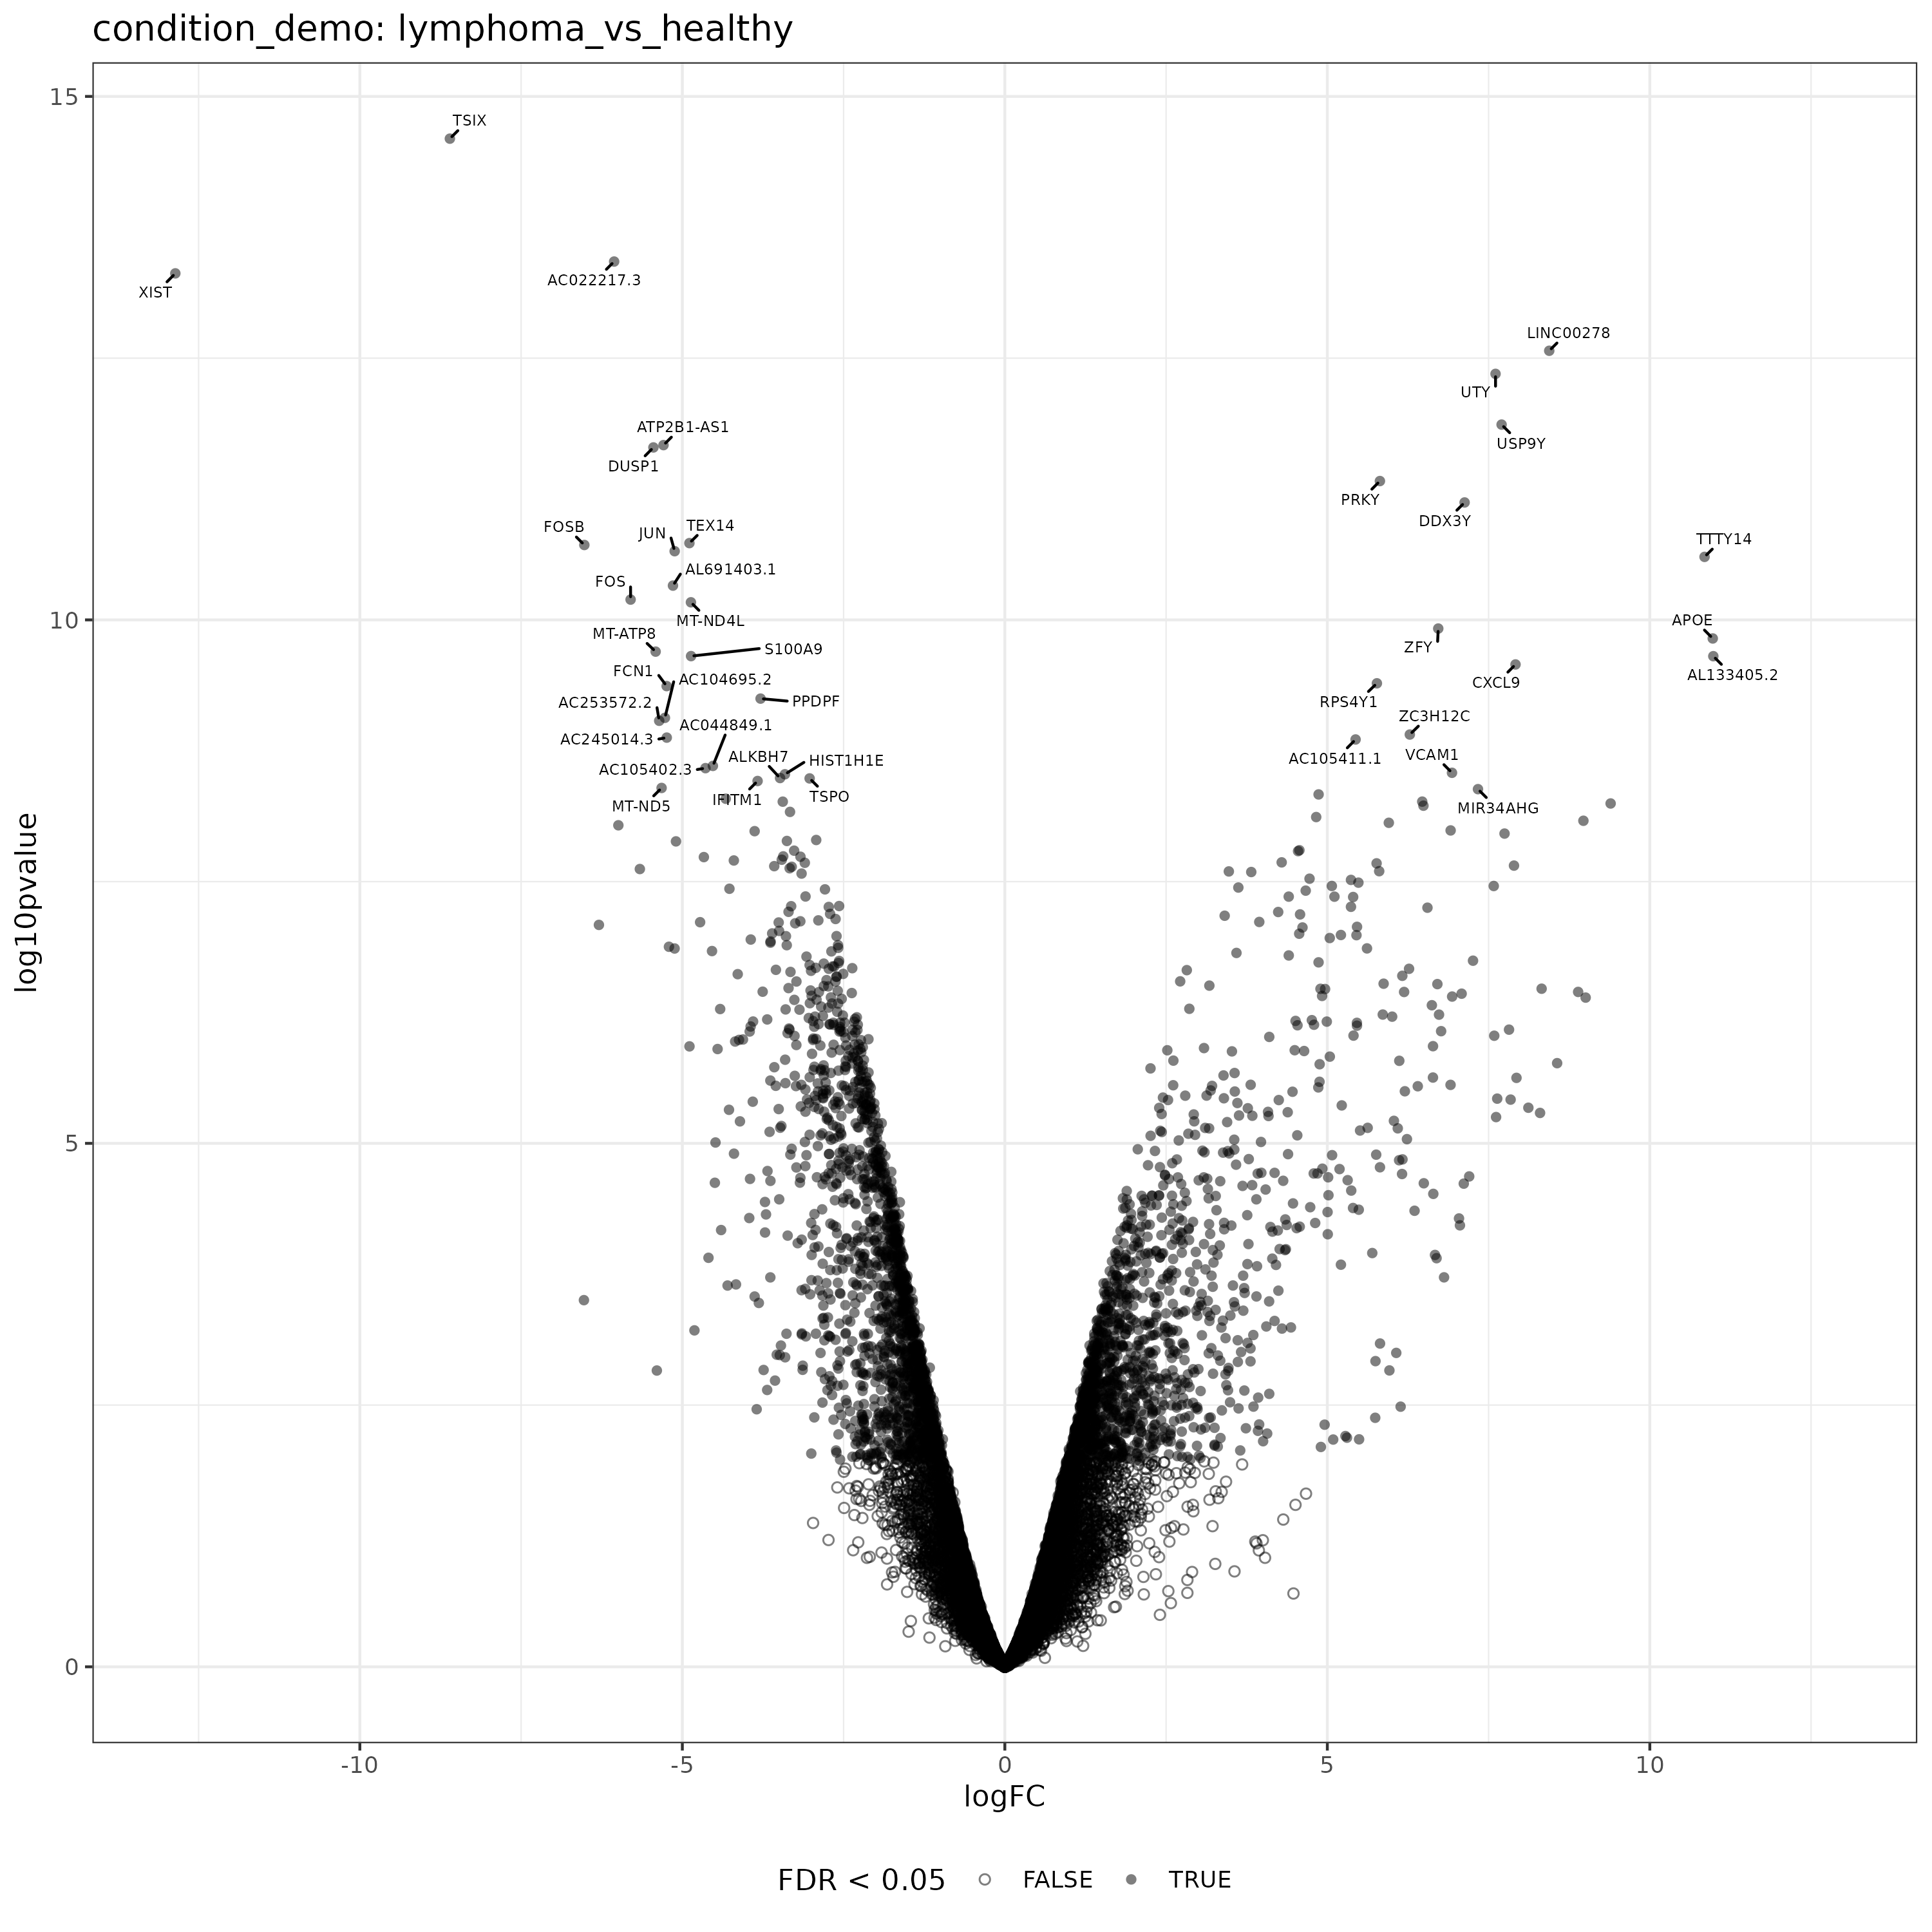
Volcano plot
Highlights genes with the strongest expression differences for one comparison.
volcano_plots_files.DGE.differential_analyses.immune_human_2x
These cards are a curated subset from the public immune_human_2x configuration. They illustrate diagnostics, not acceptable effect sizes or significance patterns for another study. See Differential analyses for prerequisites, models, and the module run command.
The full module additionally produces expression-derived CollecTRI activity results and a CollecTRI-DTFA concordance plot. They are not shown below until stable public example assets are available.
Pseudobulk differential gene-expression results across configured models and contrasts.
Volcano plot
Highlights genes with the strongest expression differences for one comparison.
volcano_plots_files.DGE.differential_analyses.immune_human_2x
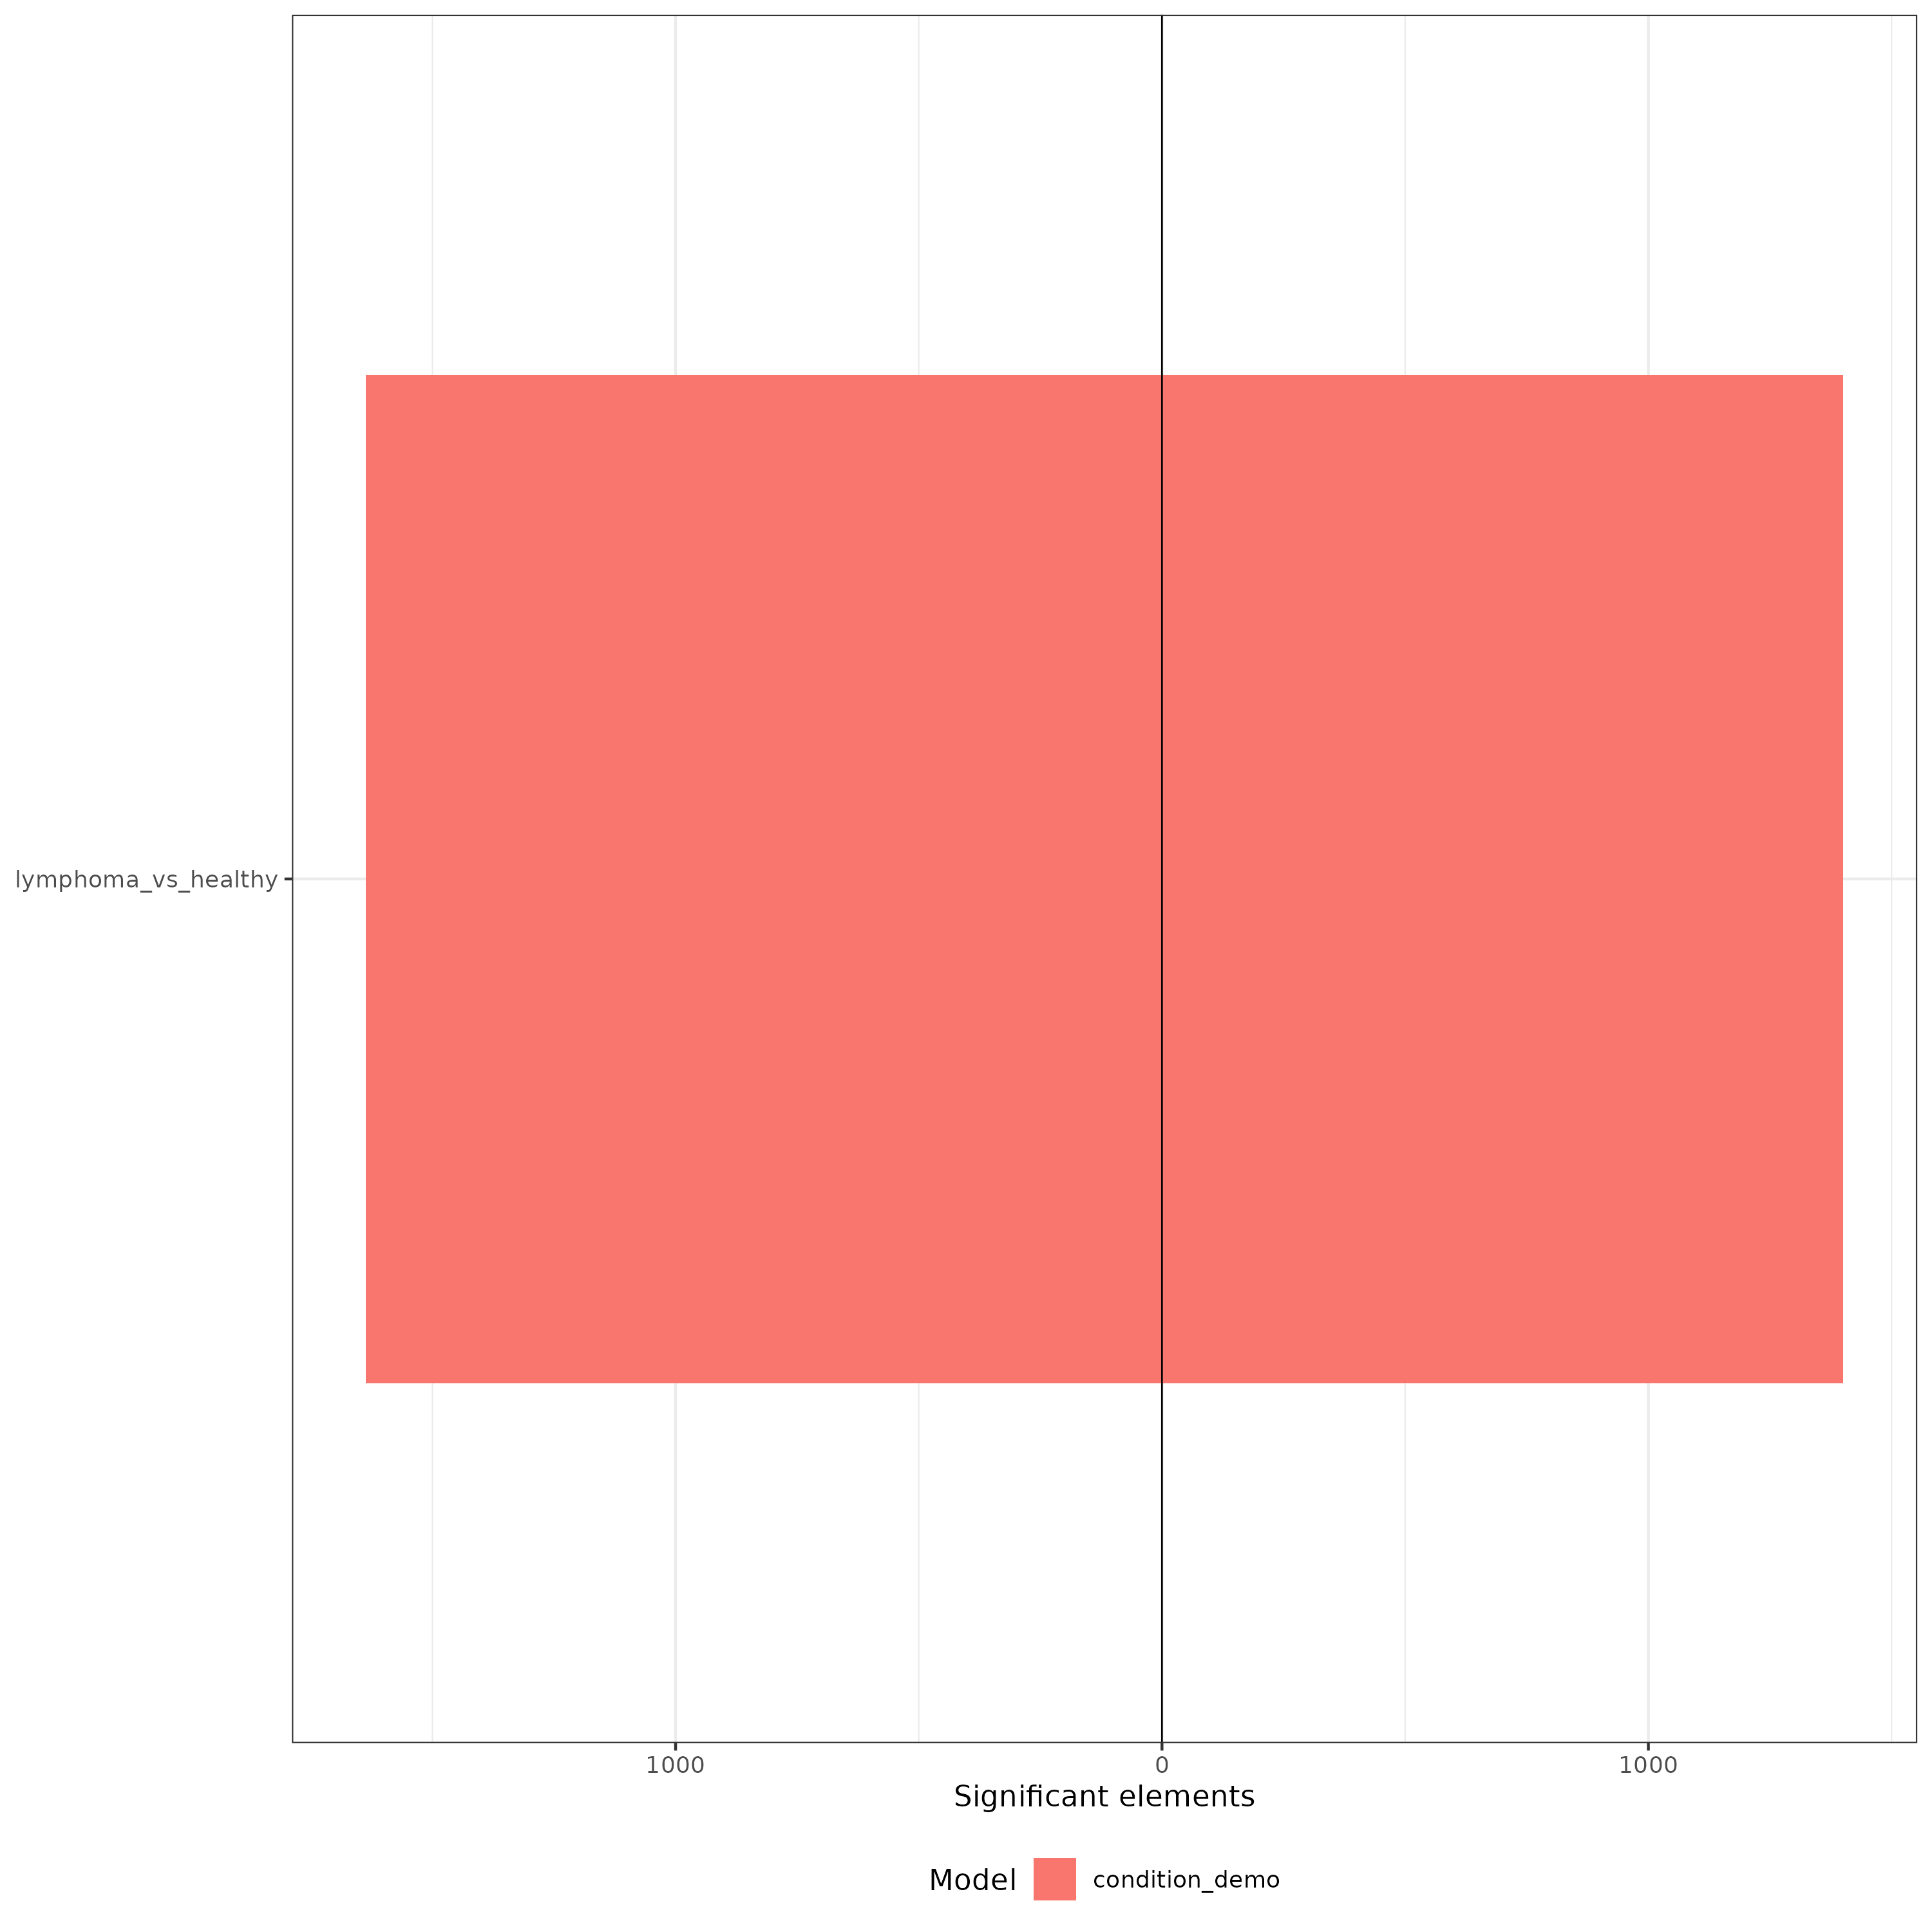
Significant-elements summary
Summarizes the number and direction of significant expression changes across comparisons.
significant_elements_plot.DGE.differential_analyses.immune_human_2x
Pseudobulk differential accessibility of consensus-peak features.
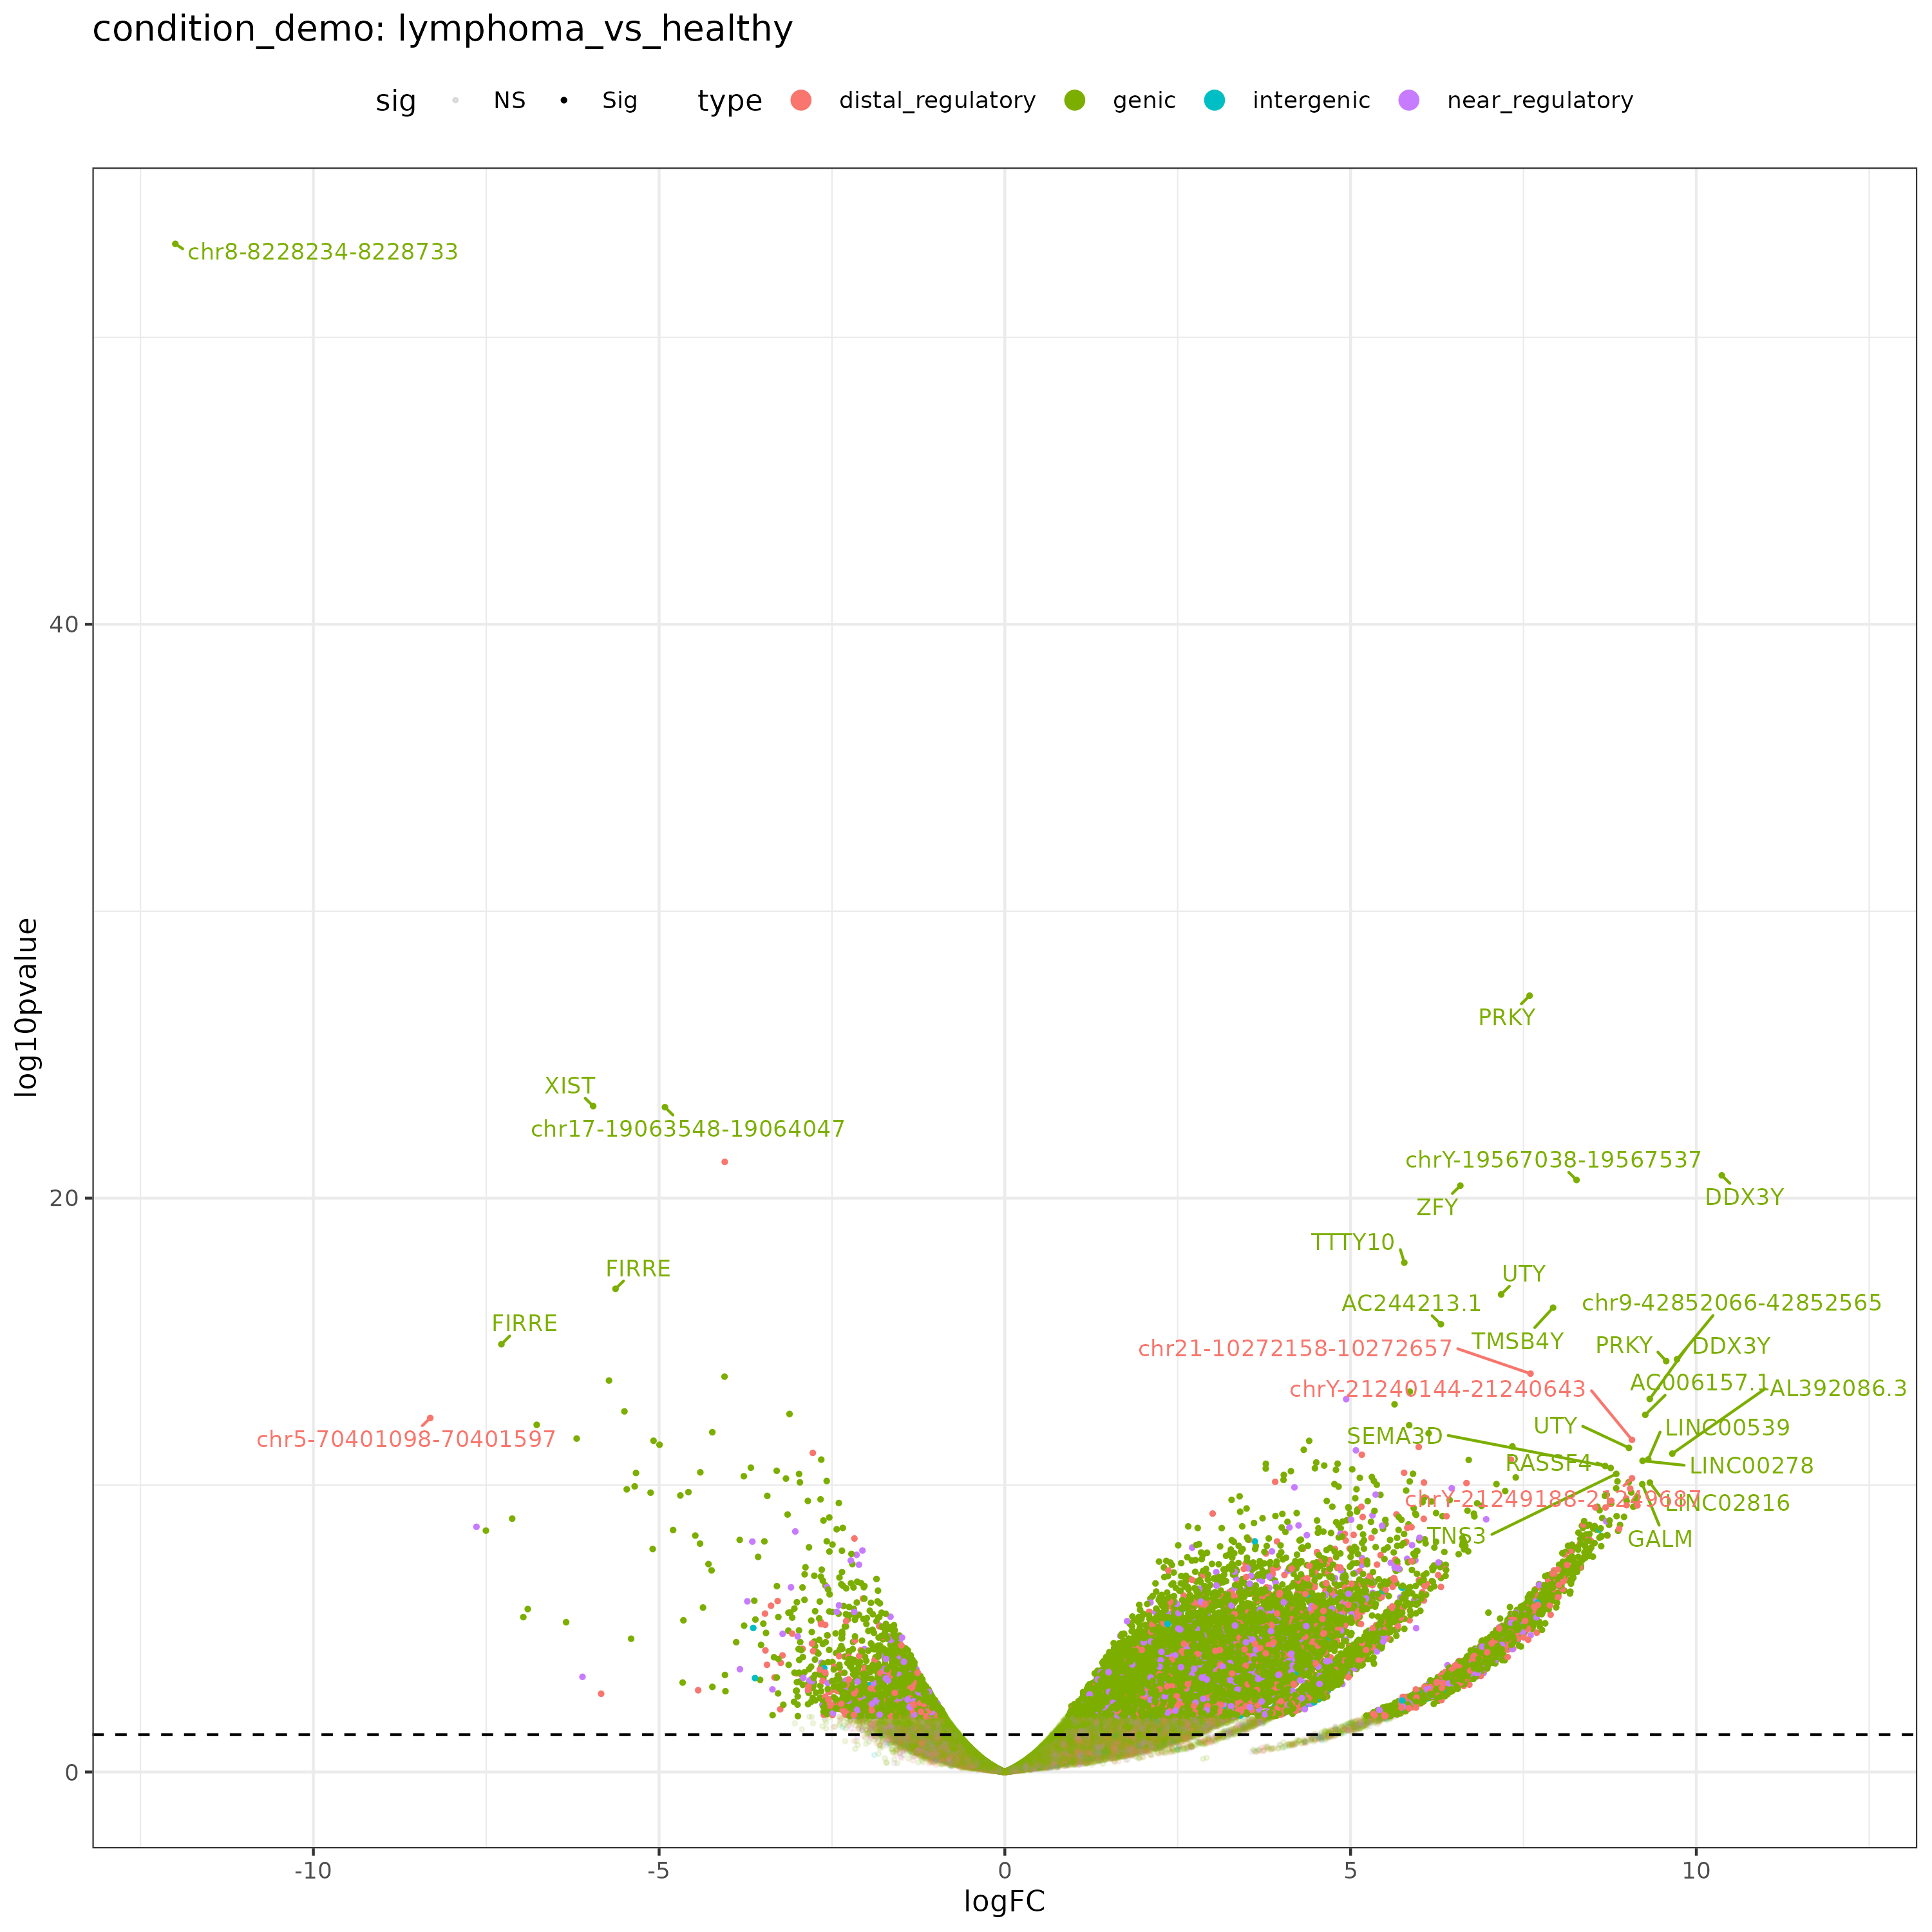
Volcano plot
Highlights regulatory regions with the strongest accessibility differences for one comparison.
volcano_plots_files.DCA.differential_analyses.immune_human_2x
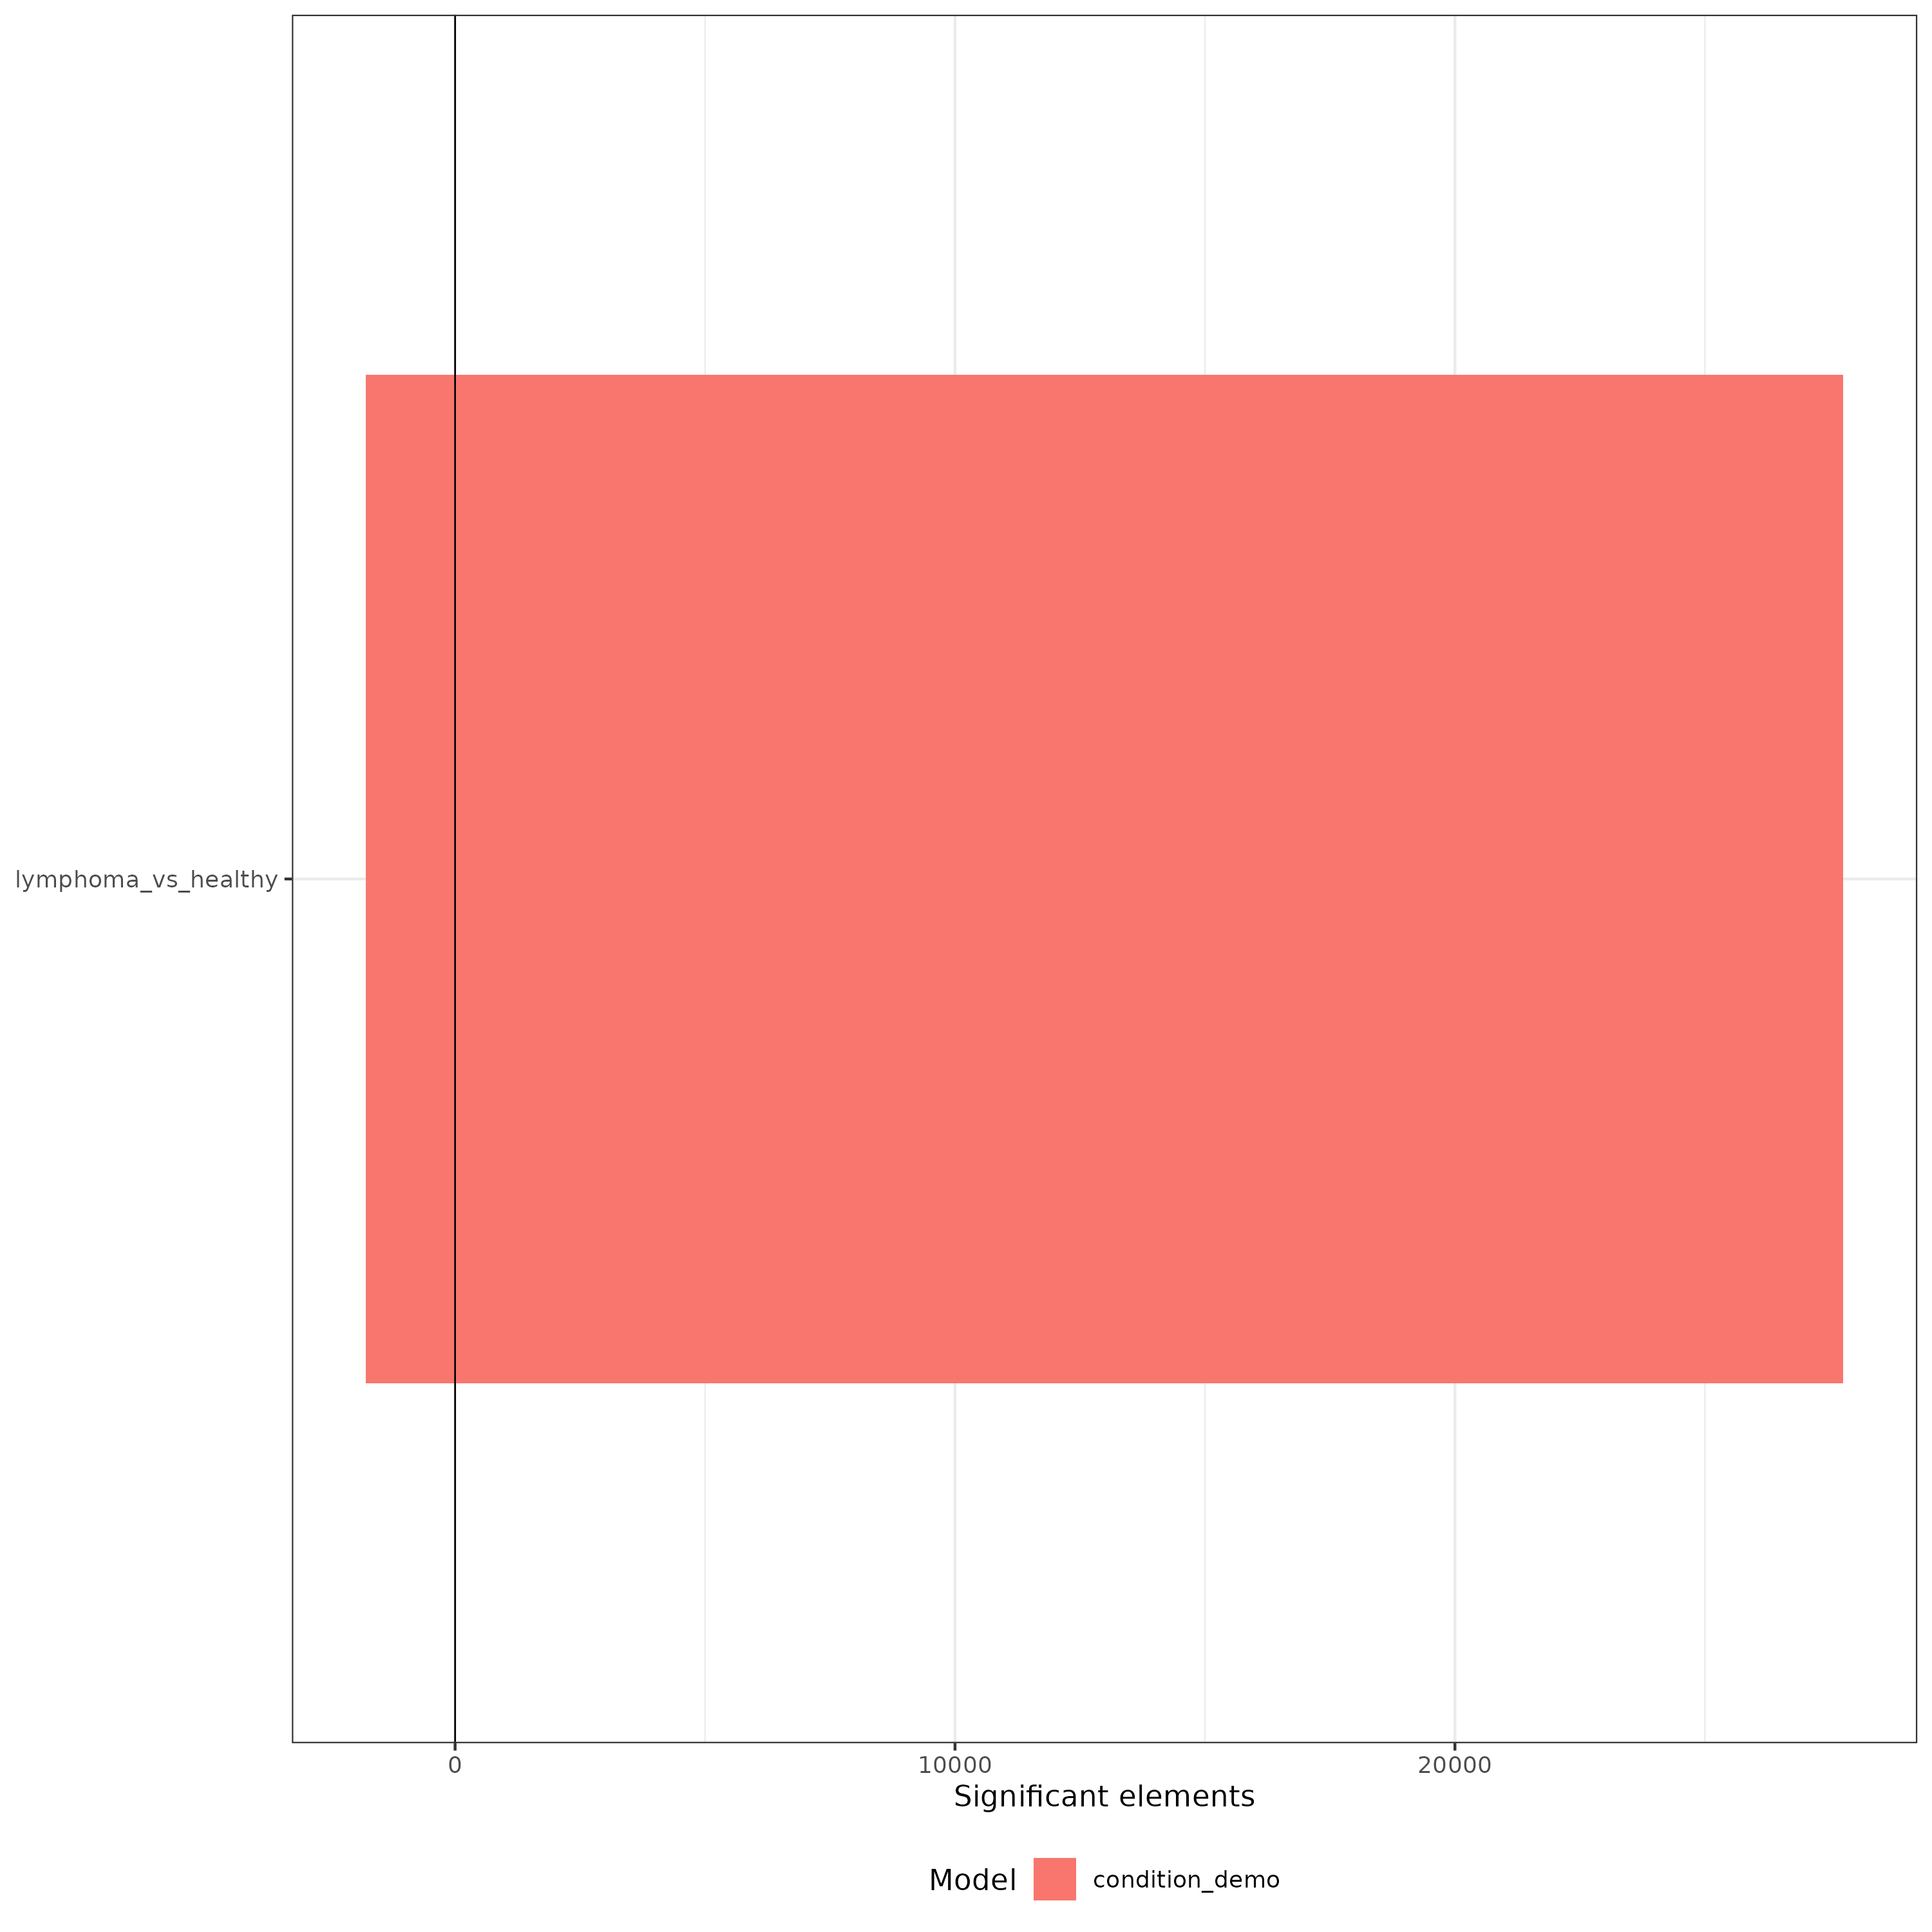
Significant-elements summary
Summarizes the number and direction of significant accessibility changes across comparisons.
significant_elements_plot.DCA.differential_analyses.immune_human_2x
Pseudobulk differential accessibility results for JASPAR motif families derived from ATAC data.
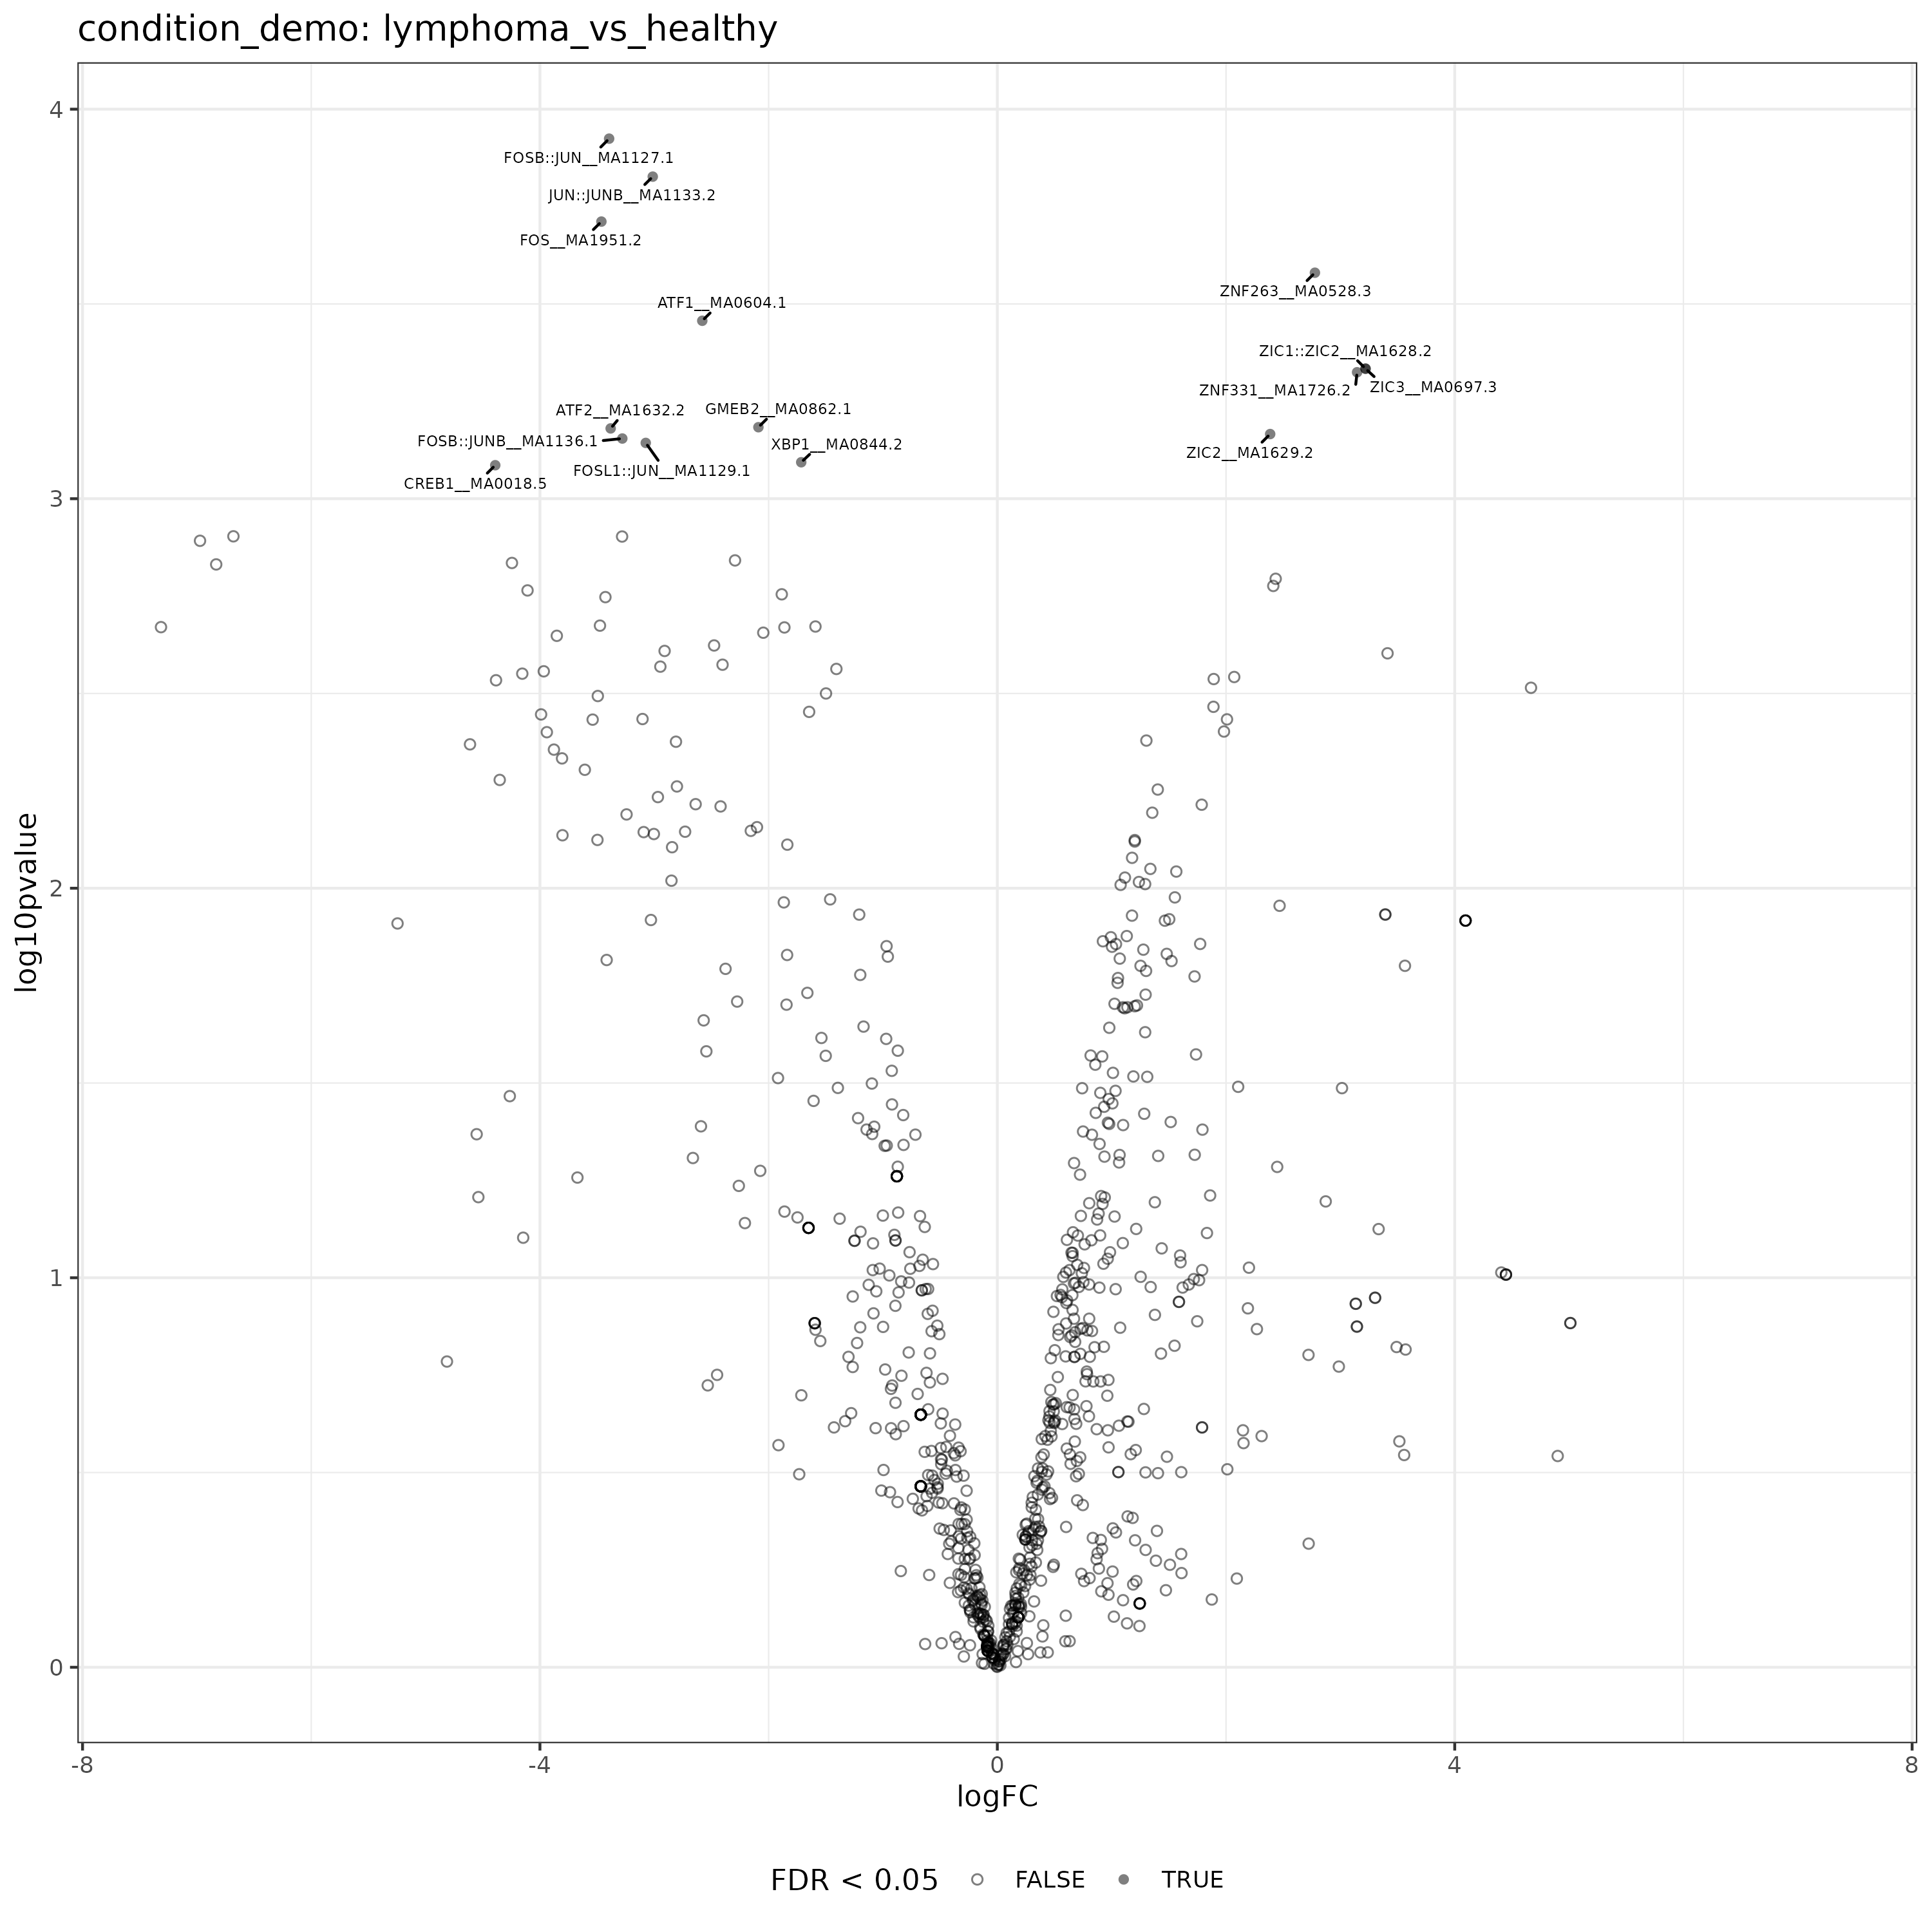
Volcano plot
Highlights JASPAR motif families with the strongest accessibility differences for one comparison.
volcano_plots_files.DTFA.differential_analyses.immune_human_2x
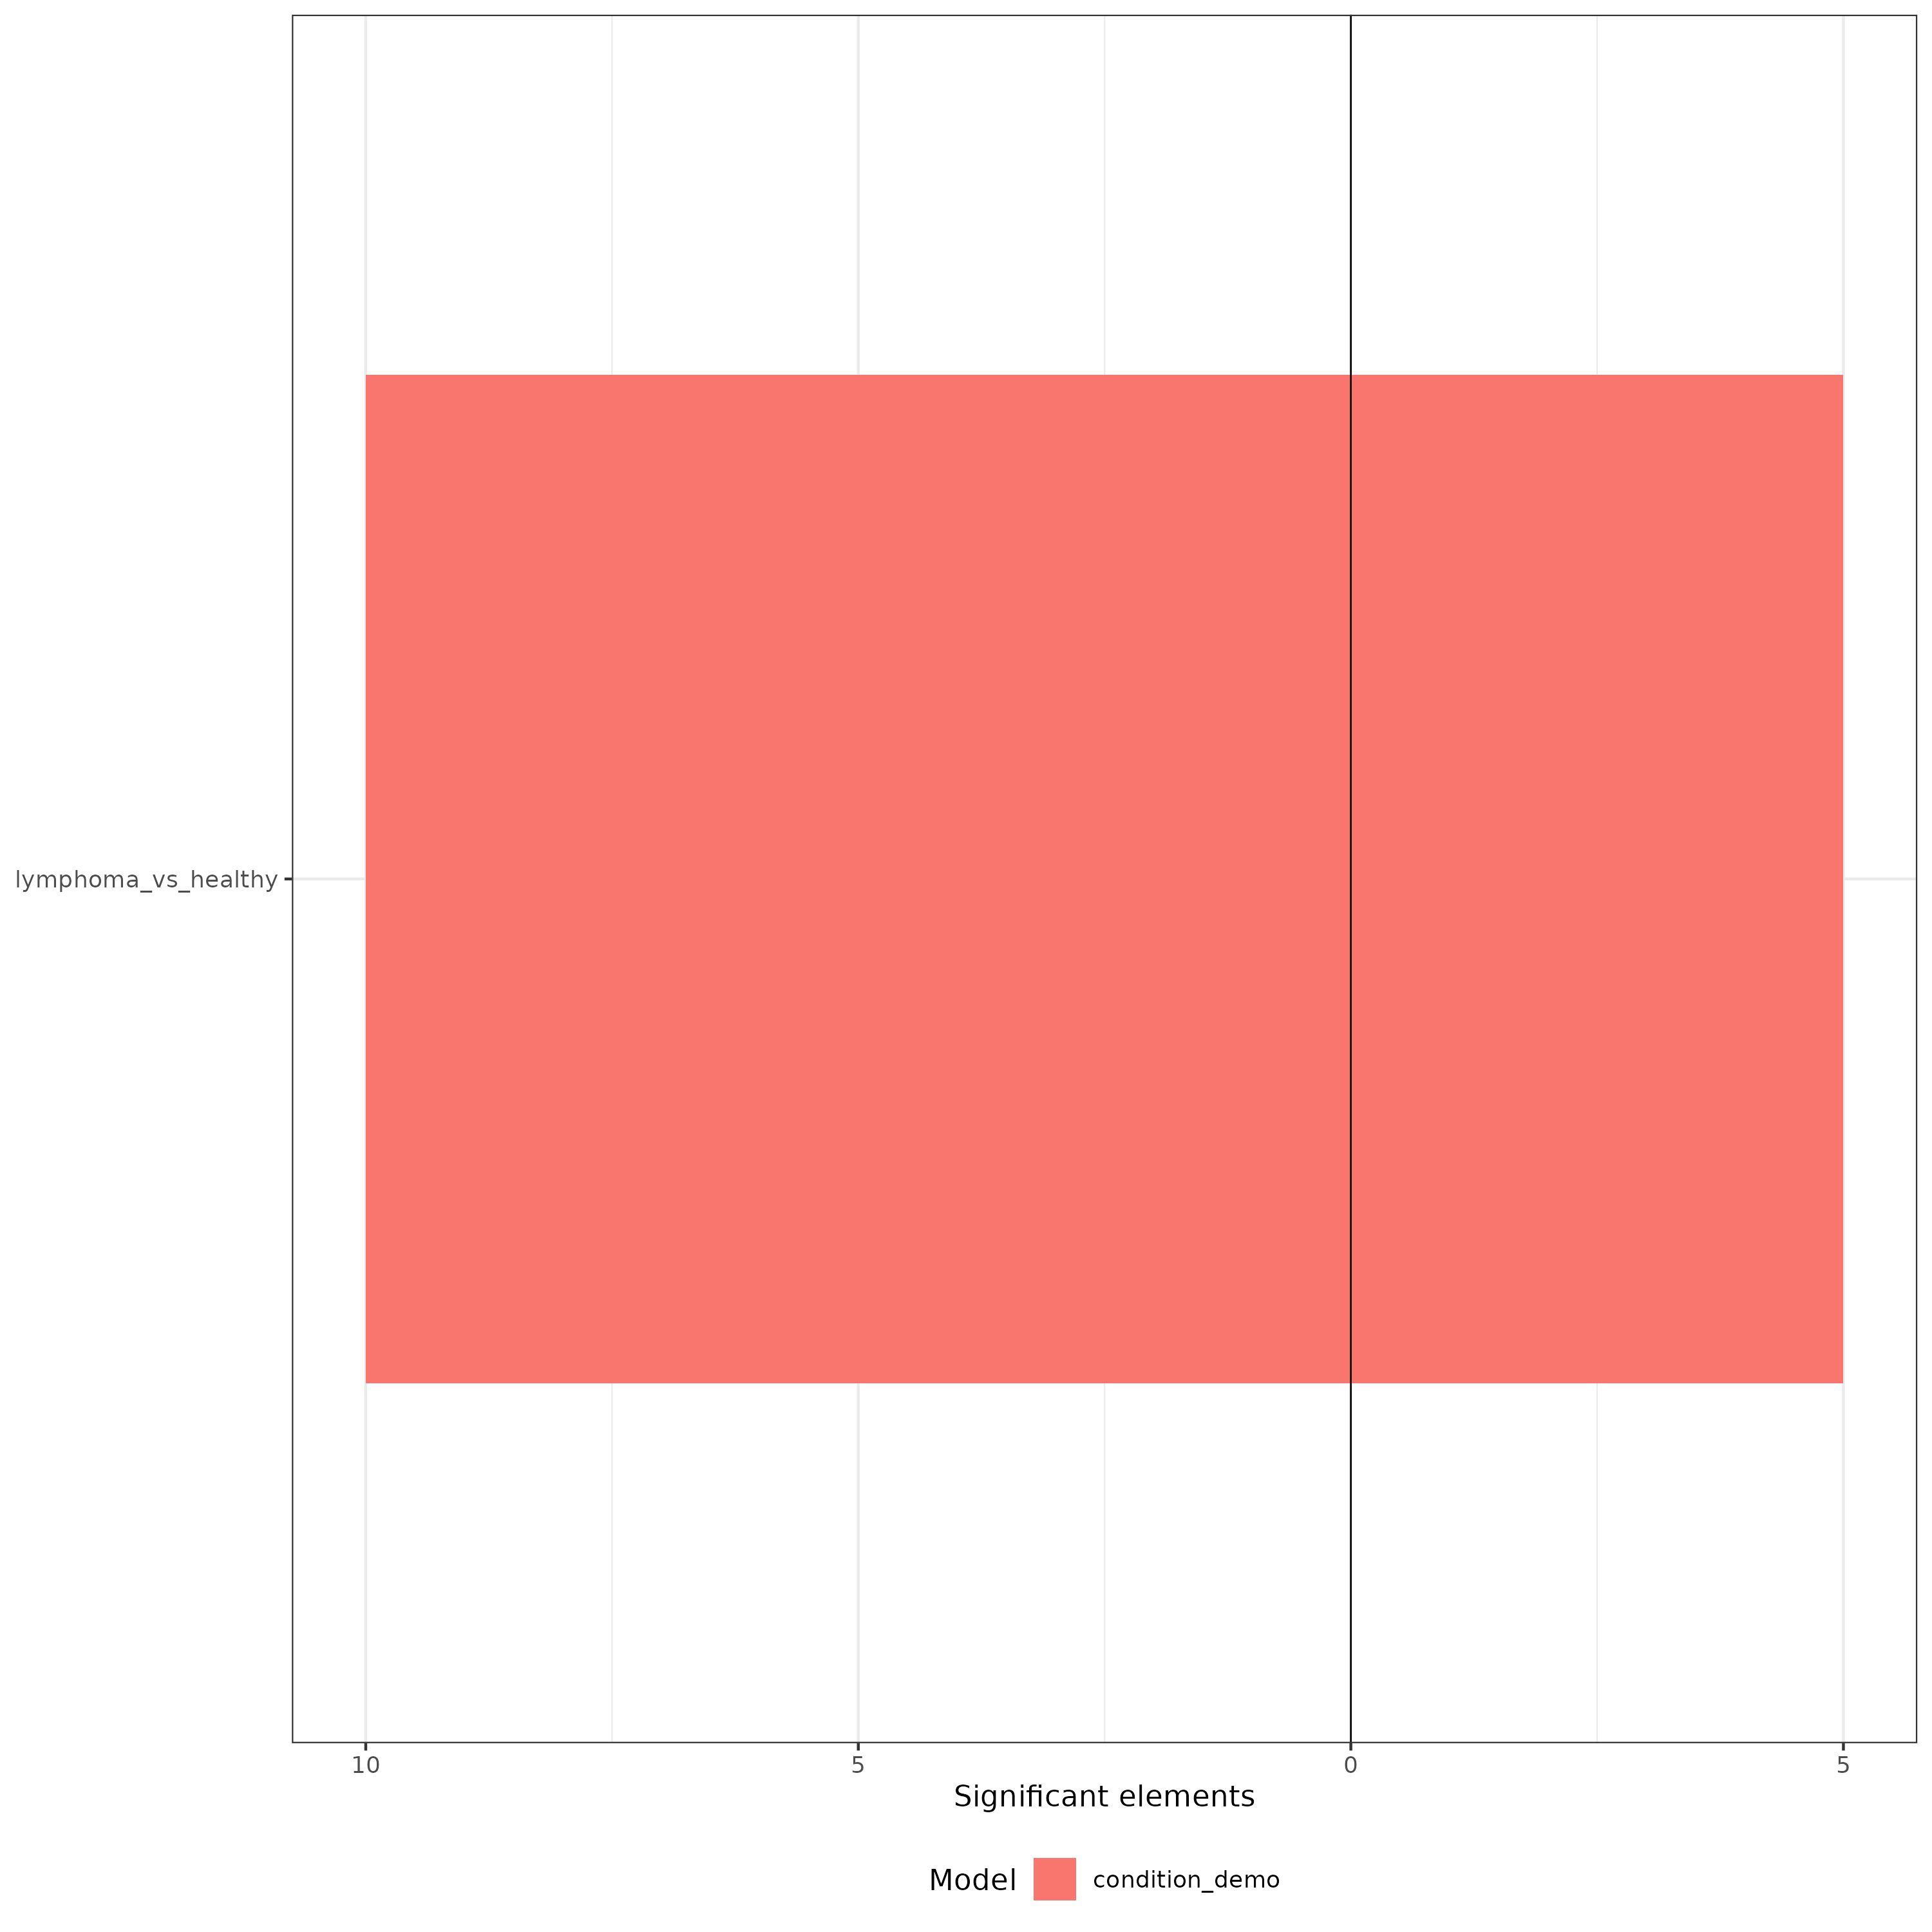
Significant-elements summary
Summarizes the number and direction of significant motif-family accessibility changes across comparisons.
significant_elements_plot.DTFA.differential_analyses.immune_human_2x
Donor-level composition models with effect and uncertainty summaries.
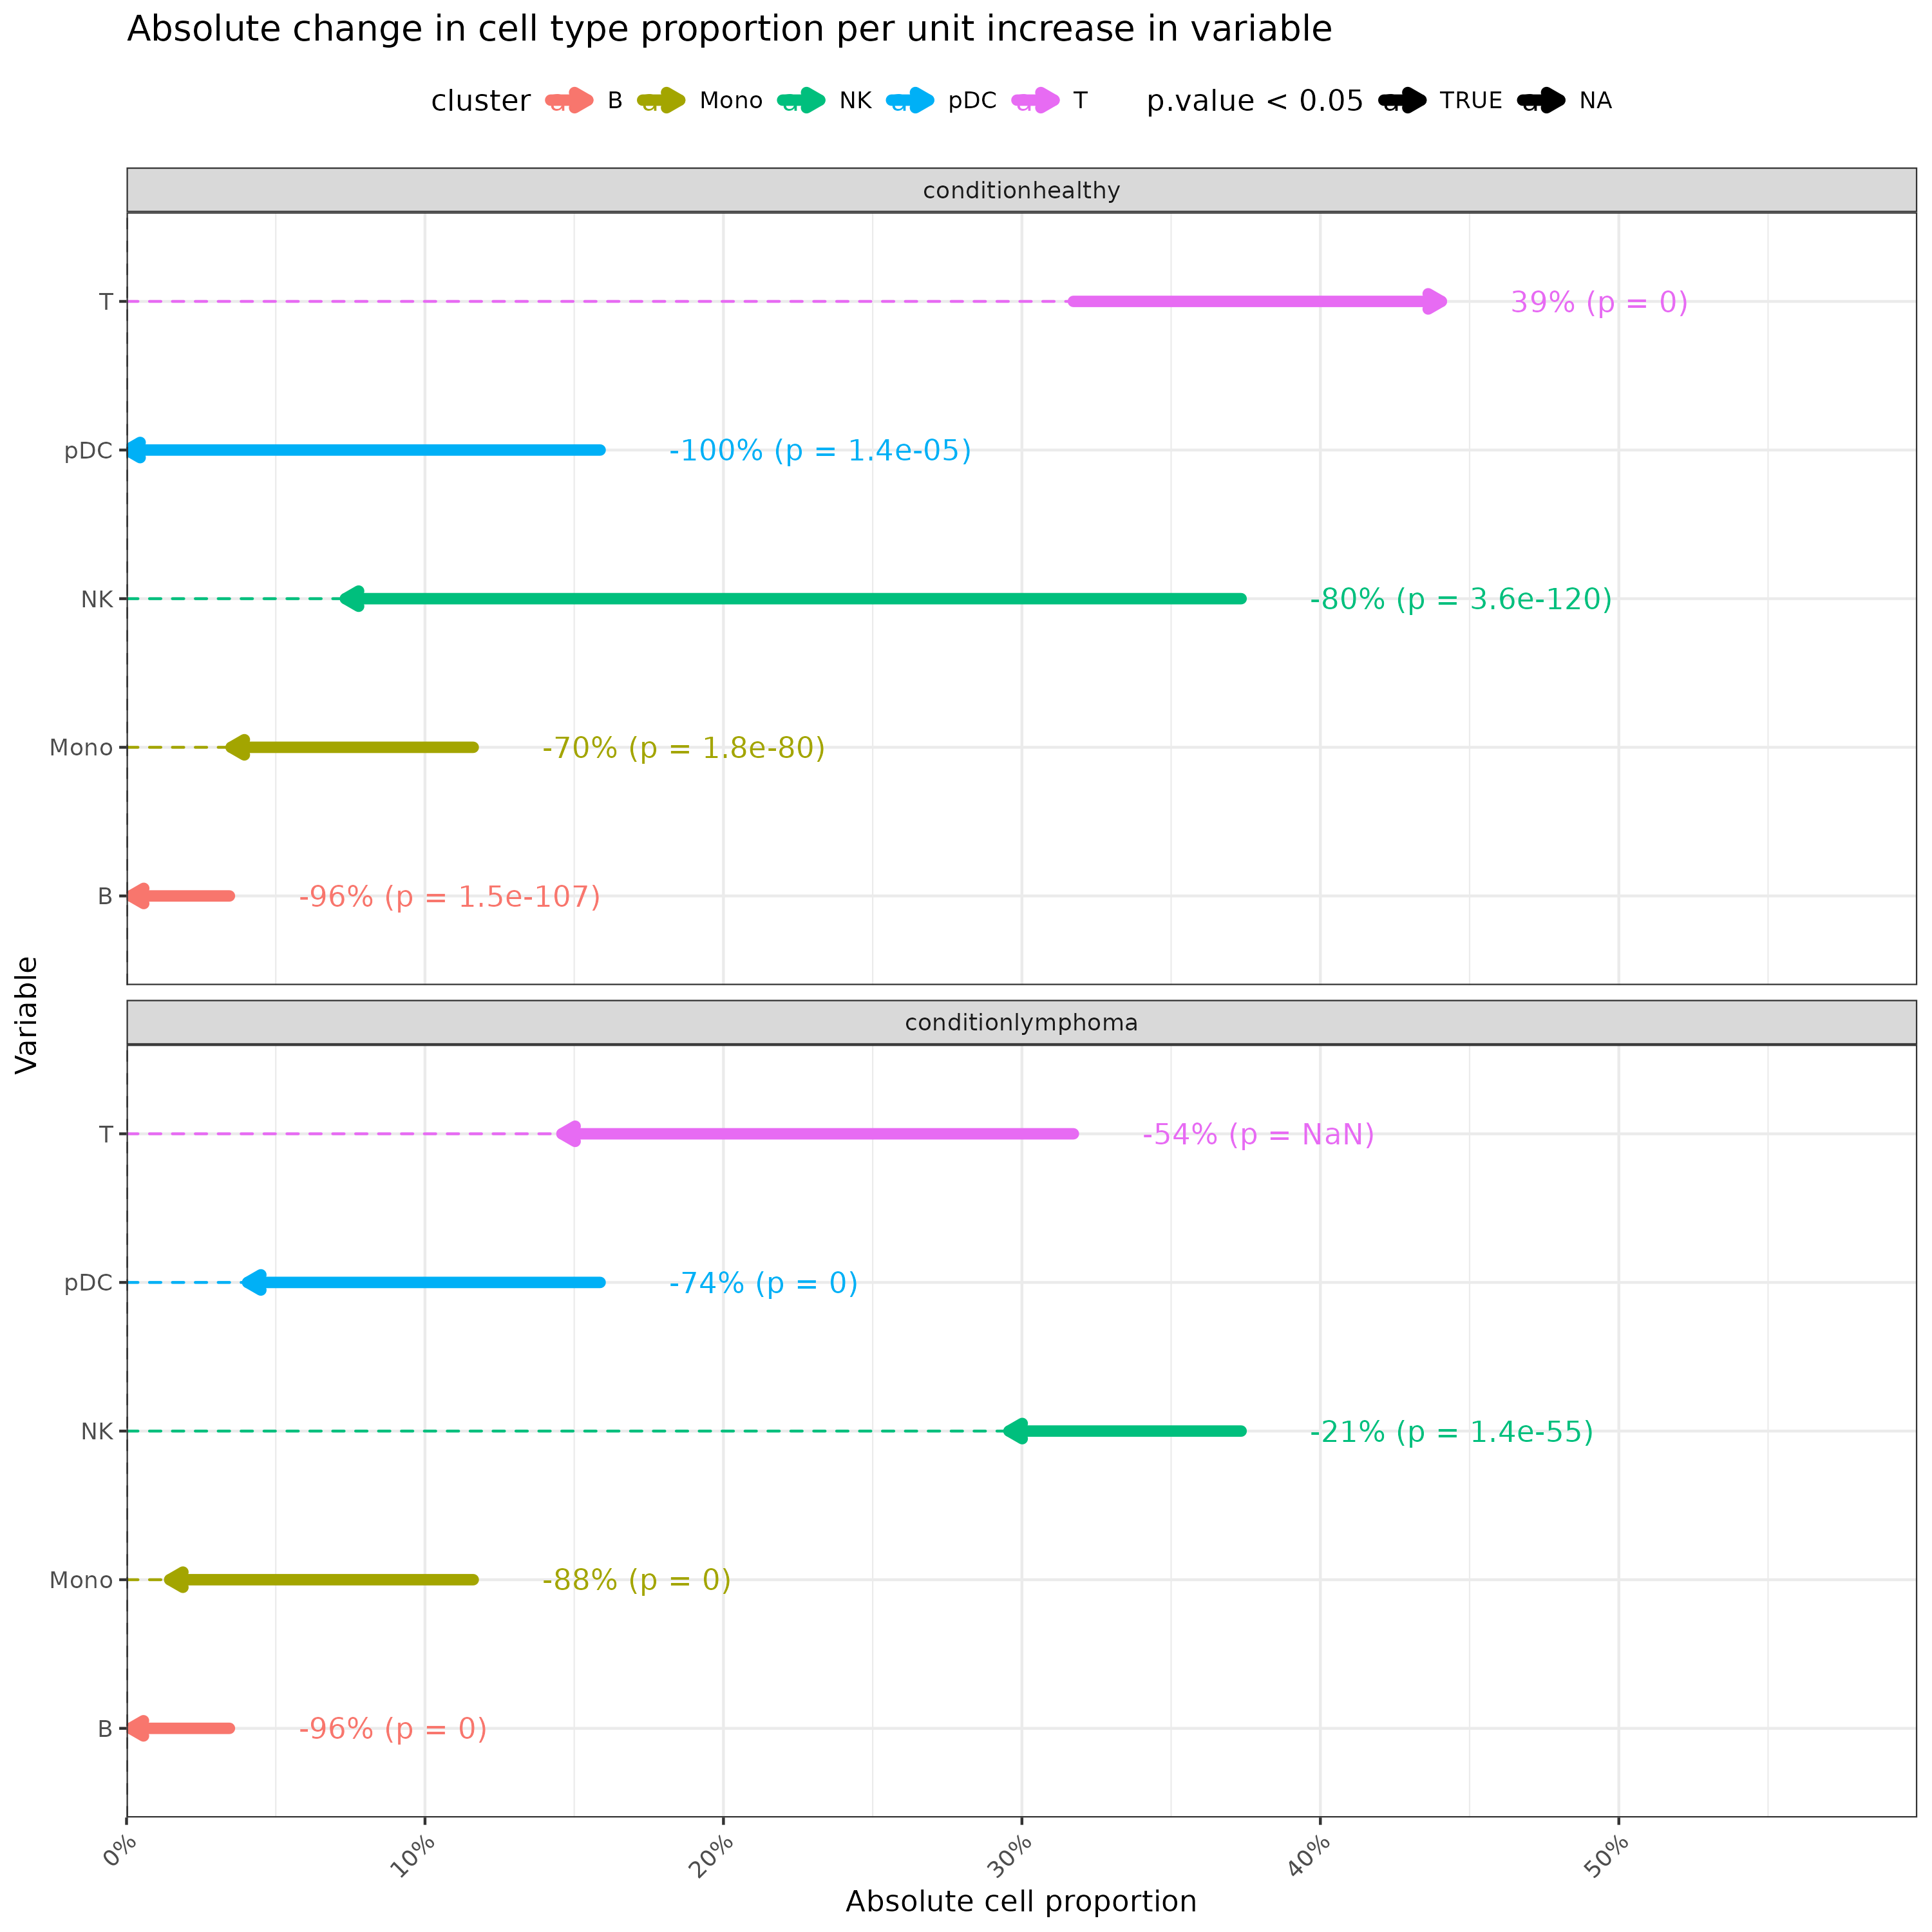
Modelled composition change
Shows how cell-type proportions vary with sample-level conditions or phenotypes.
model_change_per_unit_plot.DCTC.differential_analyses.immune_human_2x
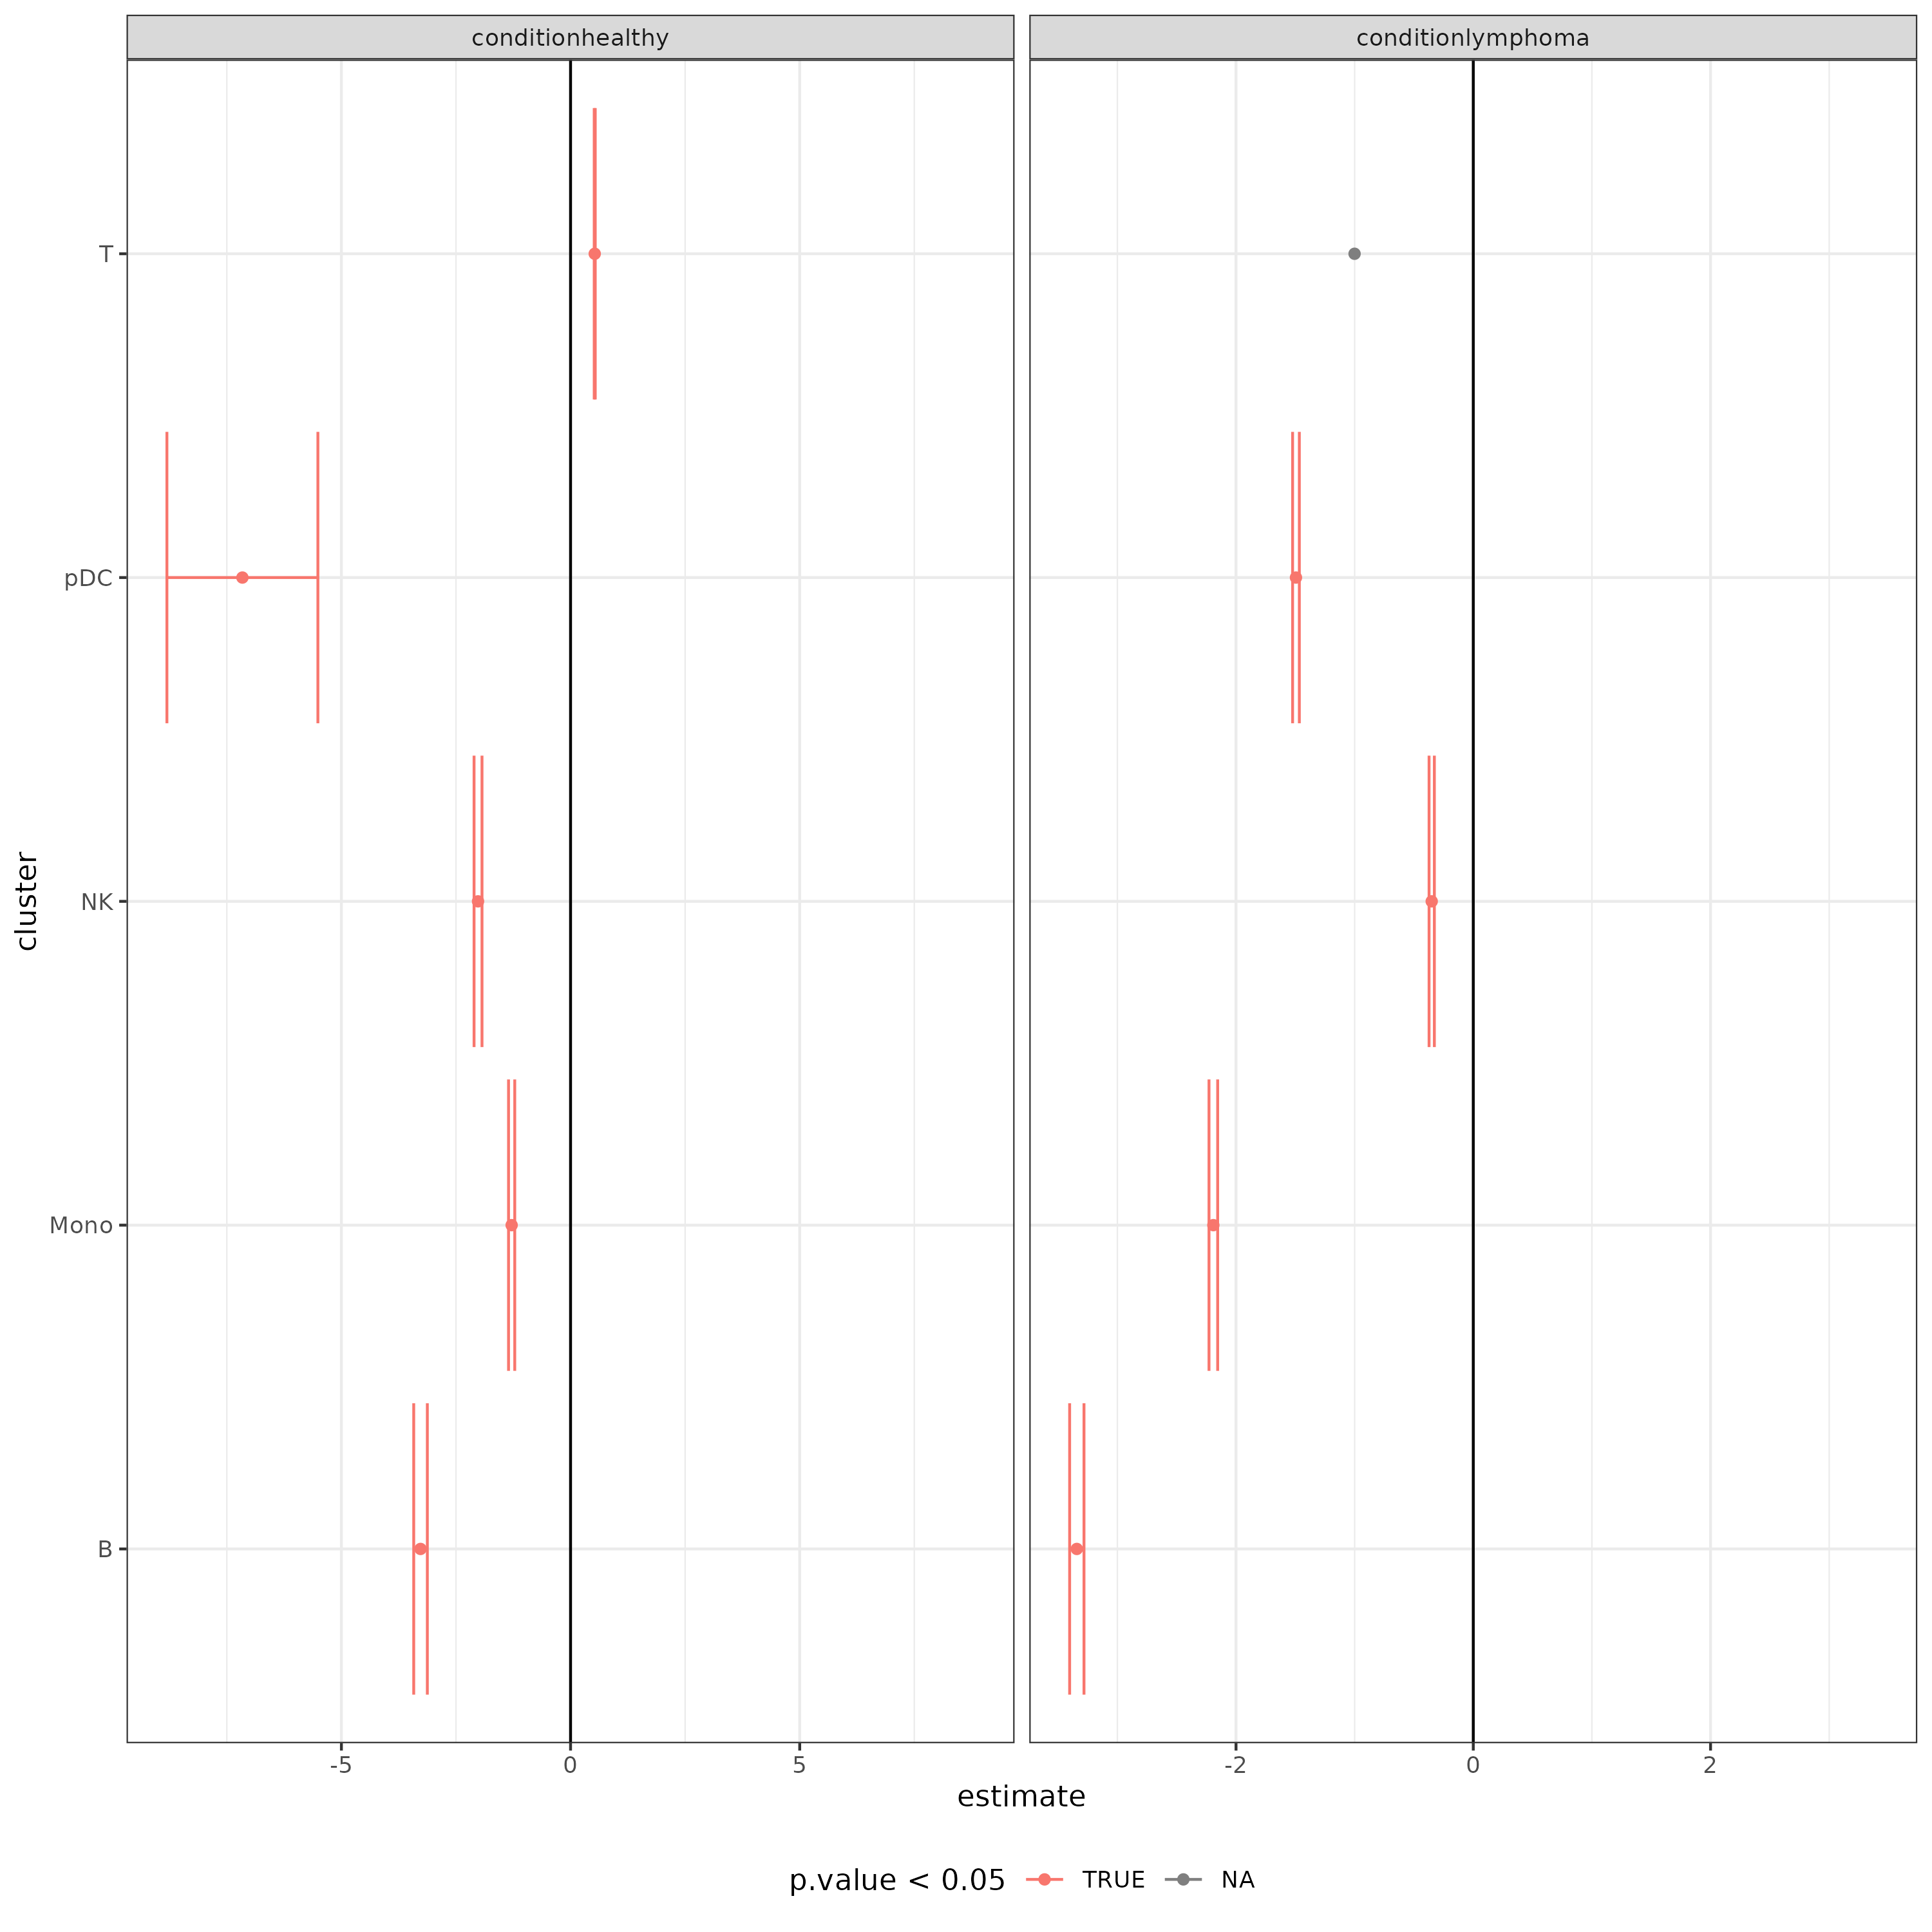
Coefficient forest
Displays effect estimates and uncertainty for cell-type composition changes.
model_coefs_forest.DCTC.differential_analyses.immune_human_2x