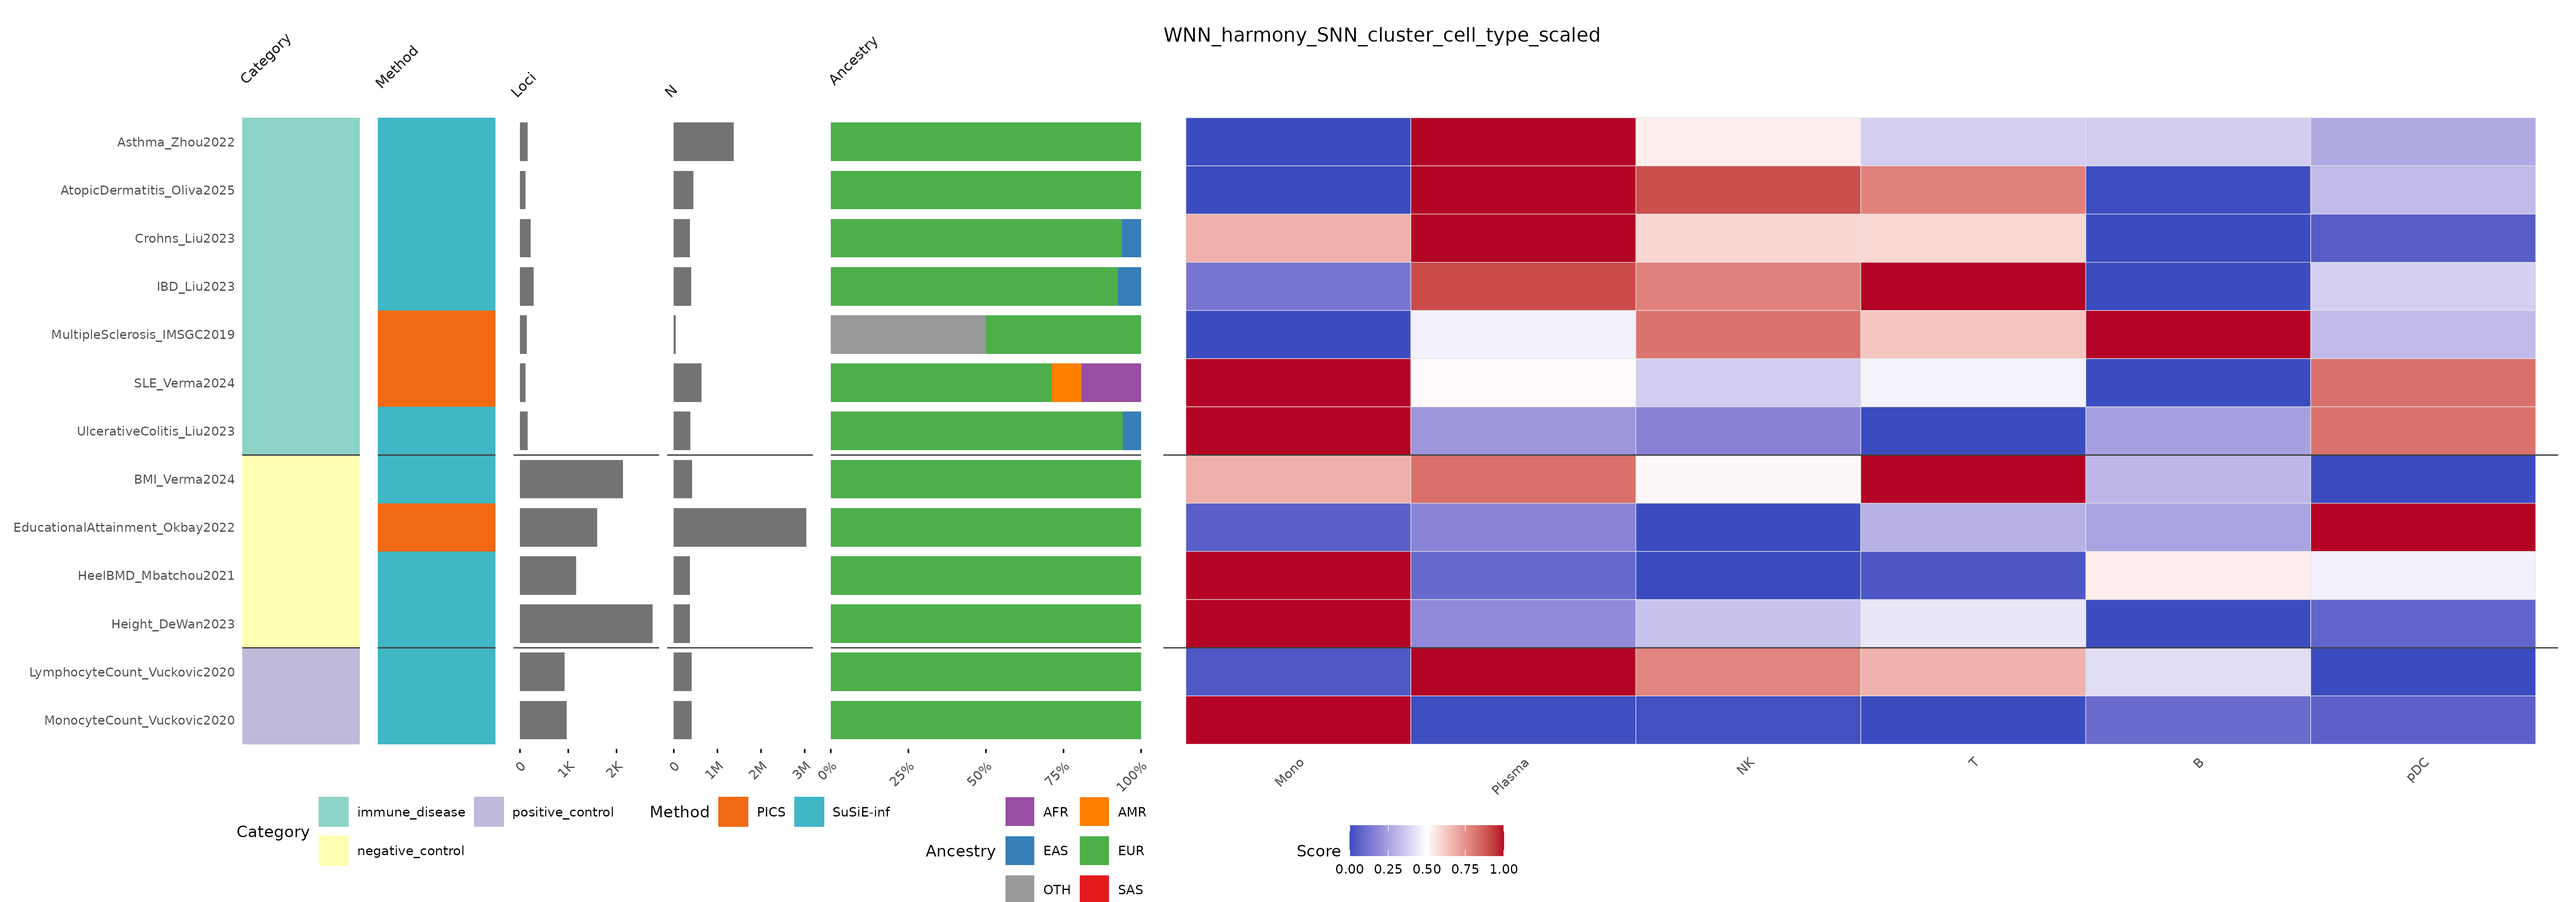
Celltype by GWAS heatmap
Summarizes graph-propagated trait relevance scores across cell groups and GWAS traits.
TRS_heatmap.WNN_harmony_SNN.SCAVENGE.single_nucleus.genetic_enrichment.PBMC_human_6x
These curated outputs use the larger PBMC_human_6x aggregation, not the quickstart with two GEM wells, and show selected SCAVENGE/WNN results rather than every attribution output. See Genetic enrichment for prerequisites, module target selection, and interpretation guidance.
These plots show graph-propagated SCAVENGE trait relevance scores. The heatmap summarizes scores by cell type and GWAS trait, while the UMAPs show per-cell scores across the WNN embedding.
Celltype by GWAS heatmap
Summarizes graph-propagated trait relevance scores across cell groups and GWAS traits.
TRS_heatmap.WNN_harmony_SNN.SCAVENGE.single_nucleus.genetic_enrichment.PBMC_human_6x
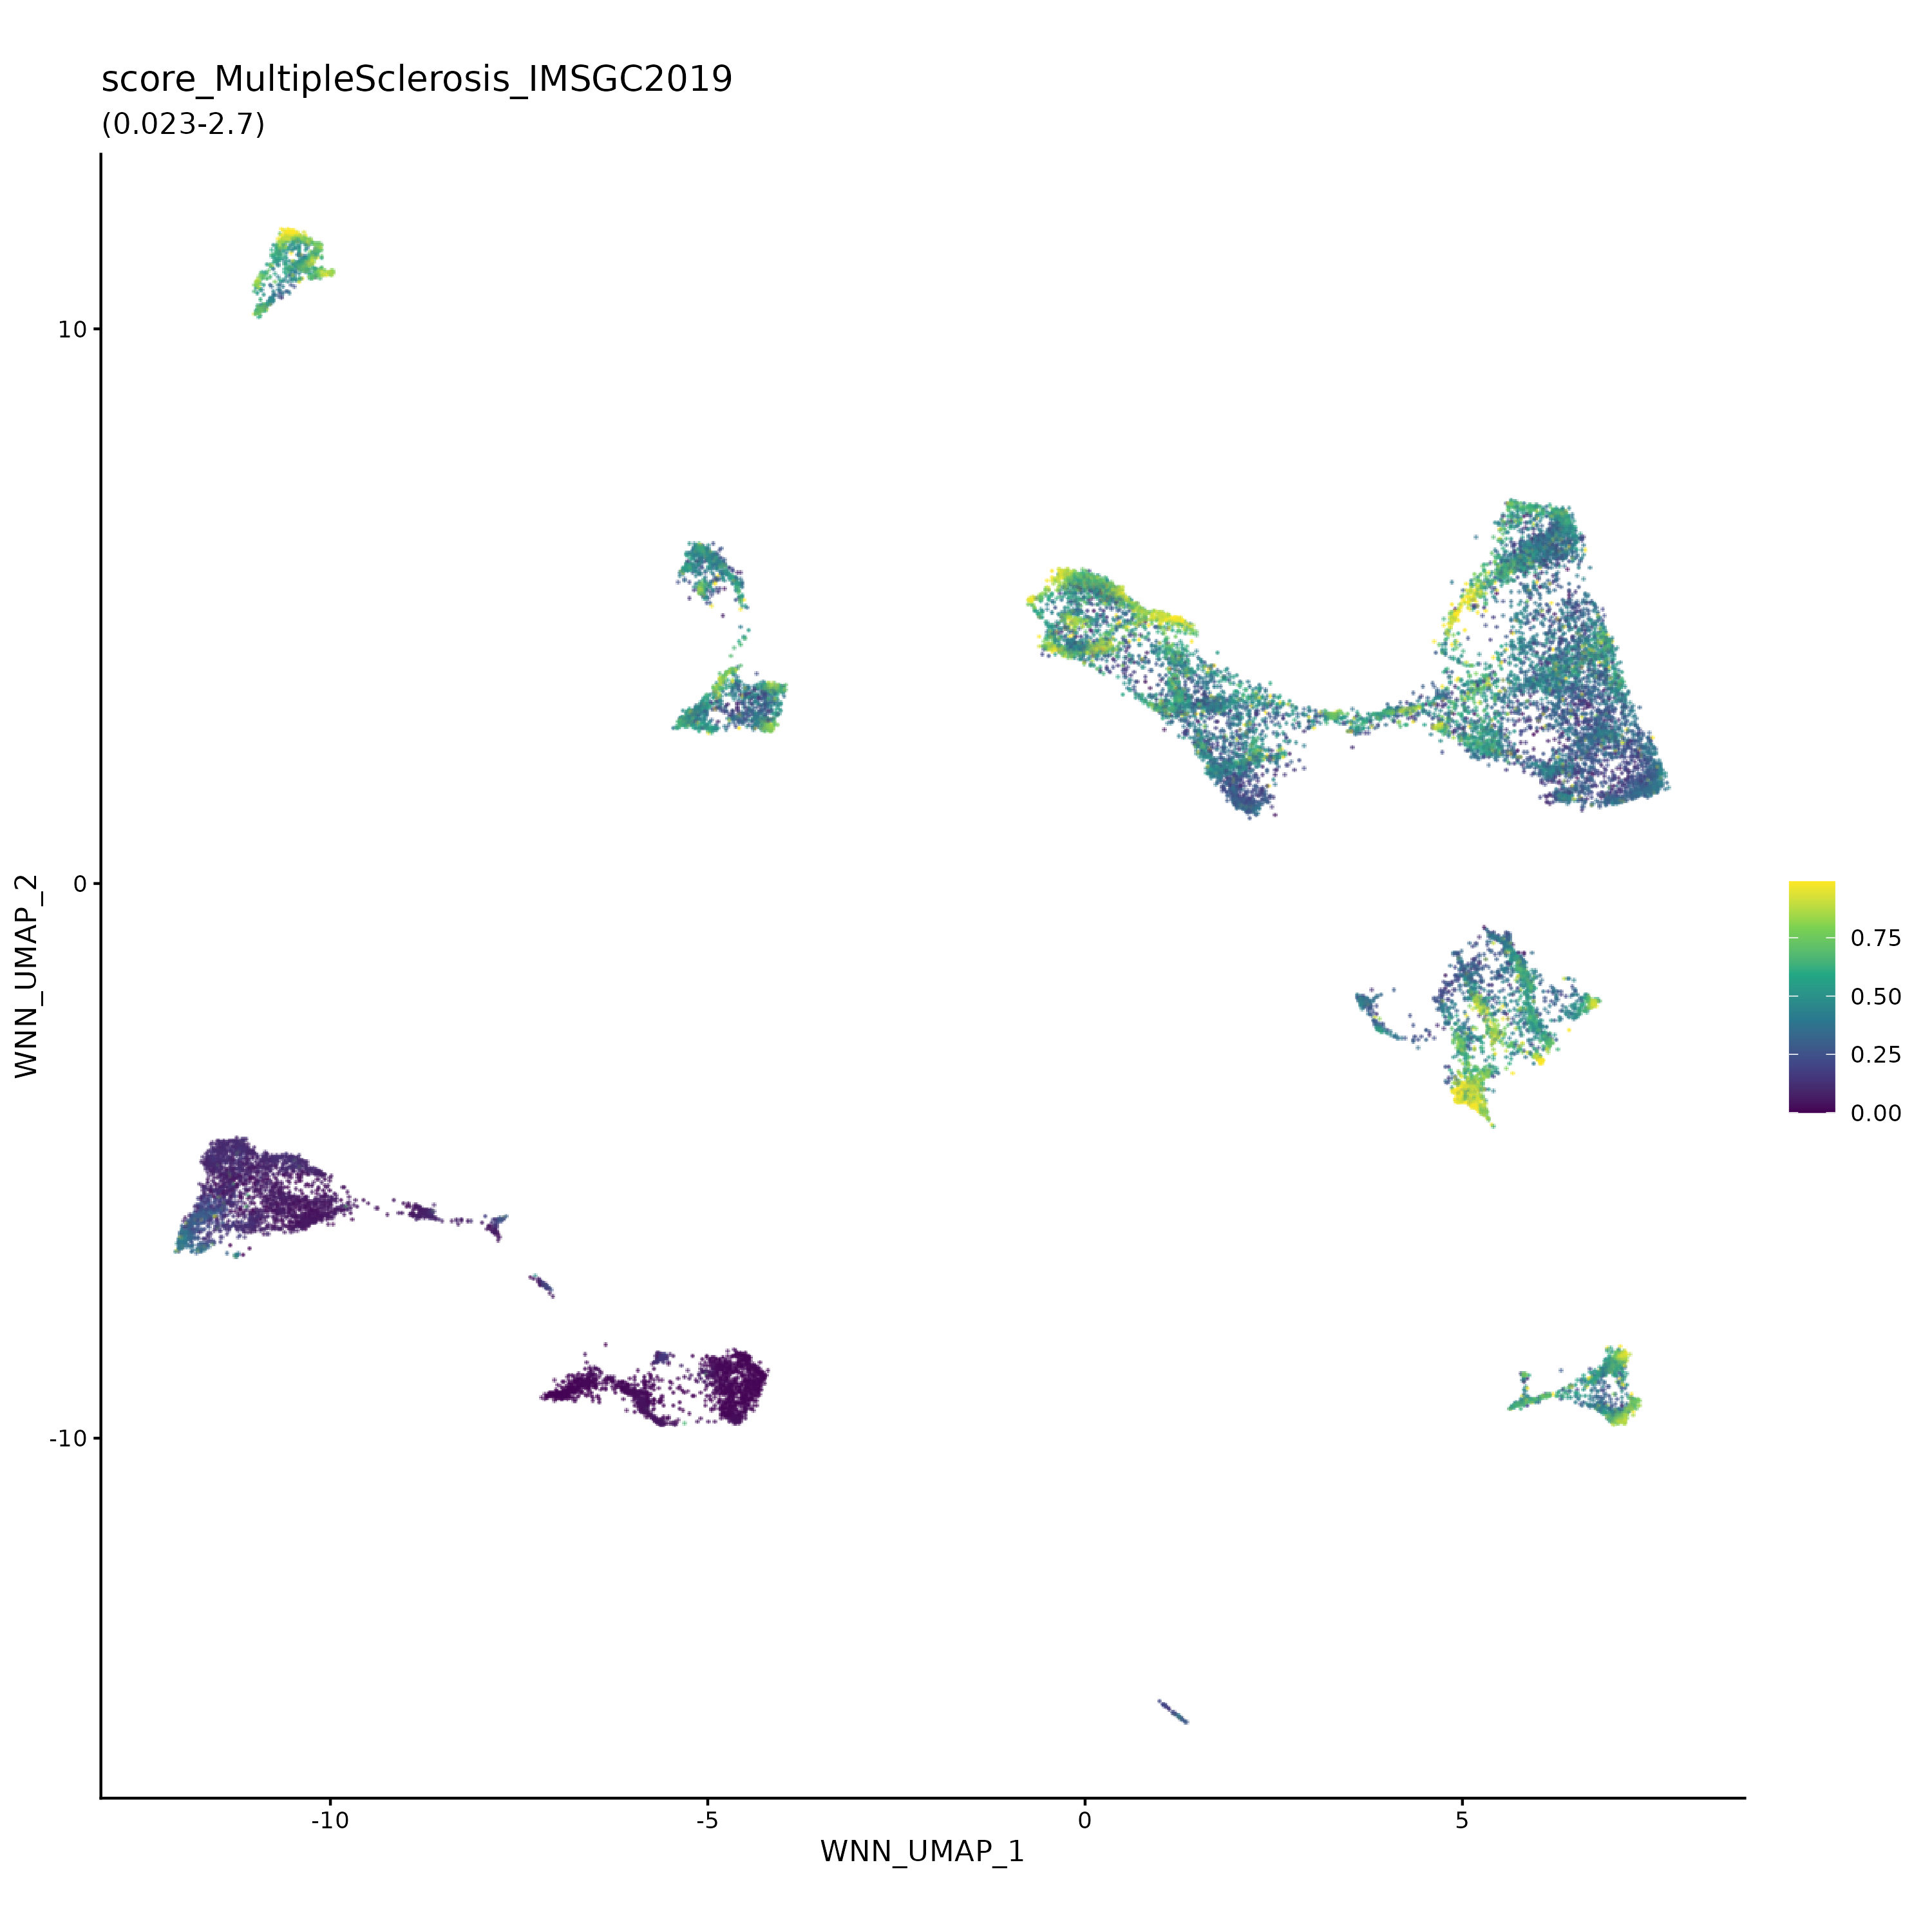
GWAS-specific UMAPs
Projects one graph-propagated trait relevance score across the WNN single-nucleus embedding.
TRS_UMAPs.WNN_harmony_SNN.SCAVENGE.single_nucleus.genetic_enrichment.PBMC_human_6x