This page shows one saved plot from each plot target of the mixed_human_31x aggregation: 31 public GEM wells from 10x Genomics and ENCODE covering heart, blood, pancreas, liver, colon, lung and cerebellum, with all three optional modules enabled. The public default configuration includes this aggregation as an inactive example; its raw data are public, but the reprocessed cellranger-arc count outputs are not supplied.
Each card shows that plot, the target’s description and its name without the .mixed_human_31x suffix. Select a preview to enlarge it. The running guide explains when to review each checkpoint.
Primary module
1. Pre-aggregation QC
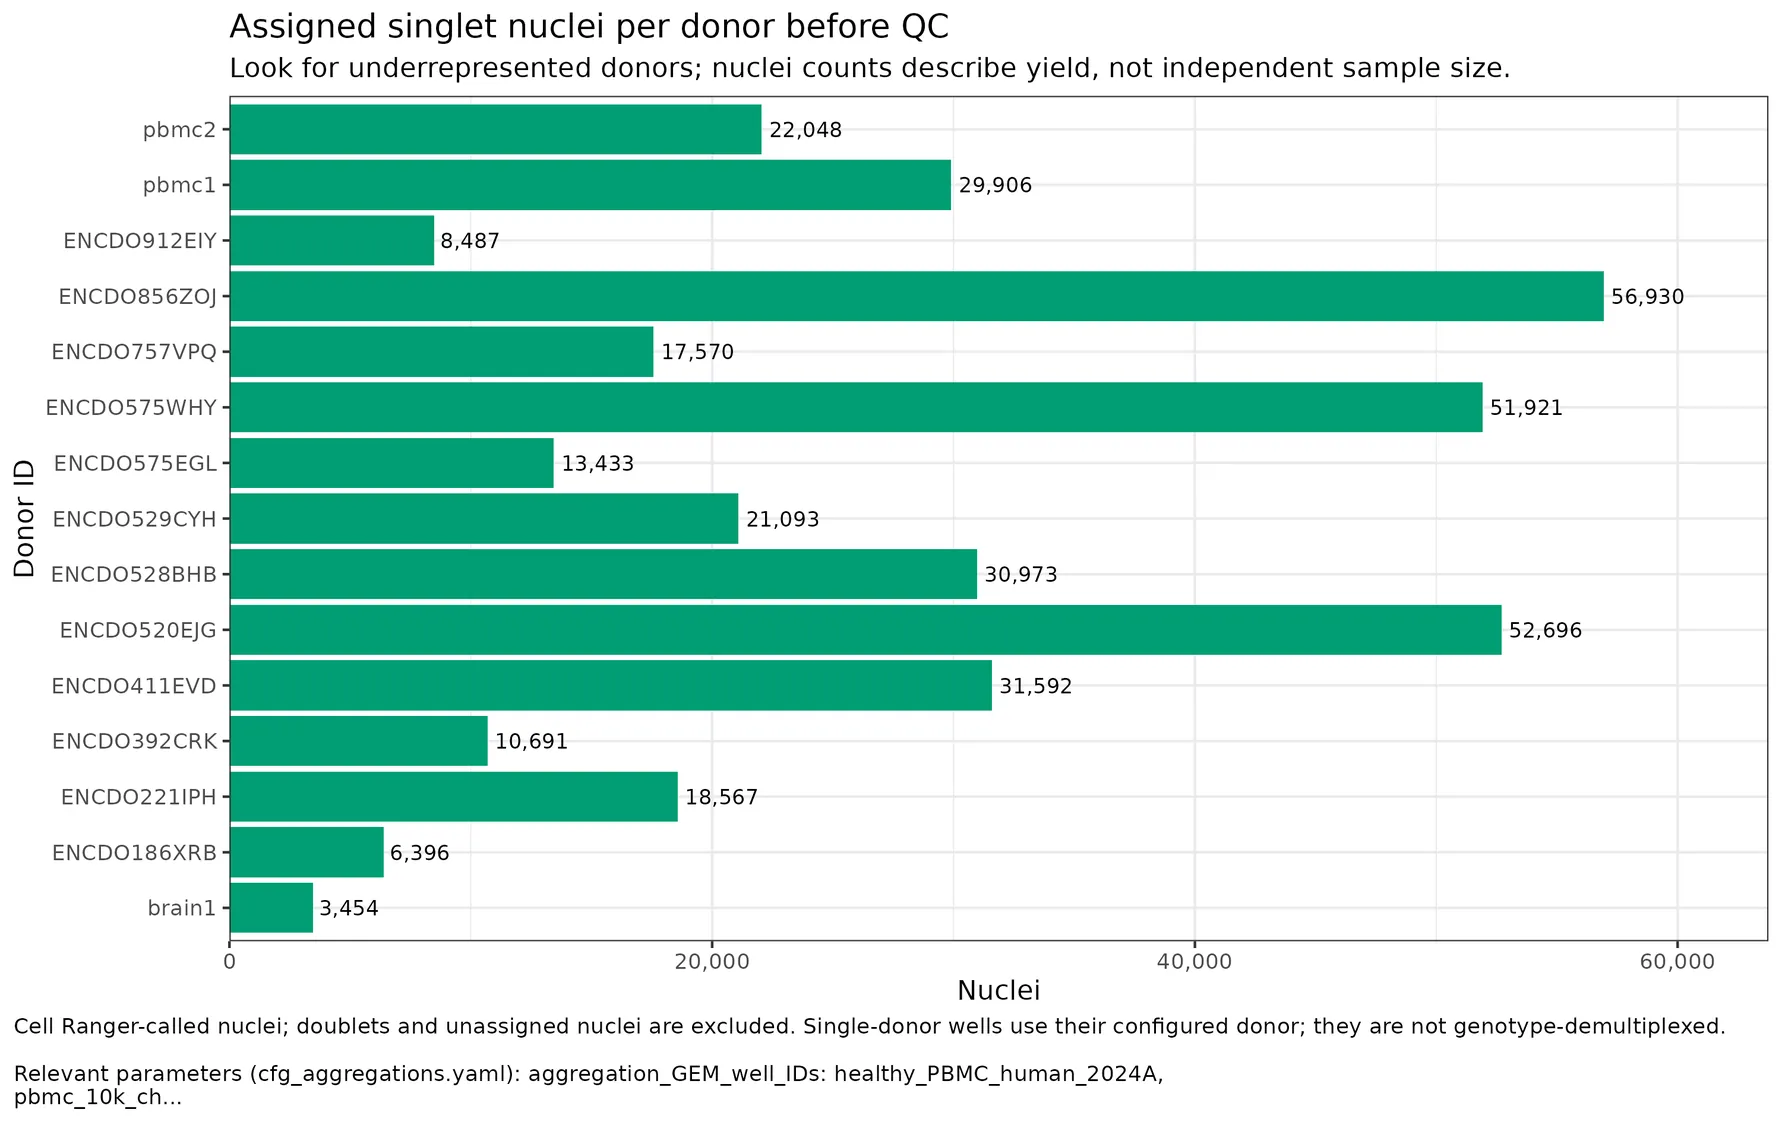
Plot pre-QC assigned singlet nuclei per donor, excluding doublets and unassigned barcodes. nuclei_per_donor_id_bars.1_pre_aggregation_QC
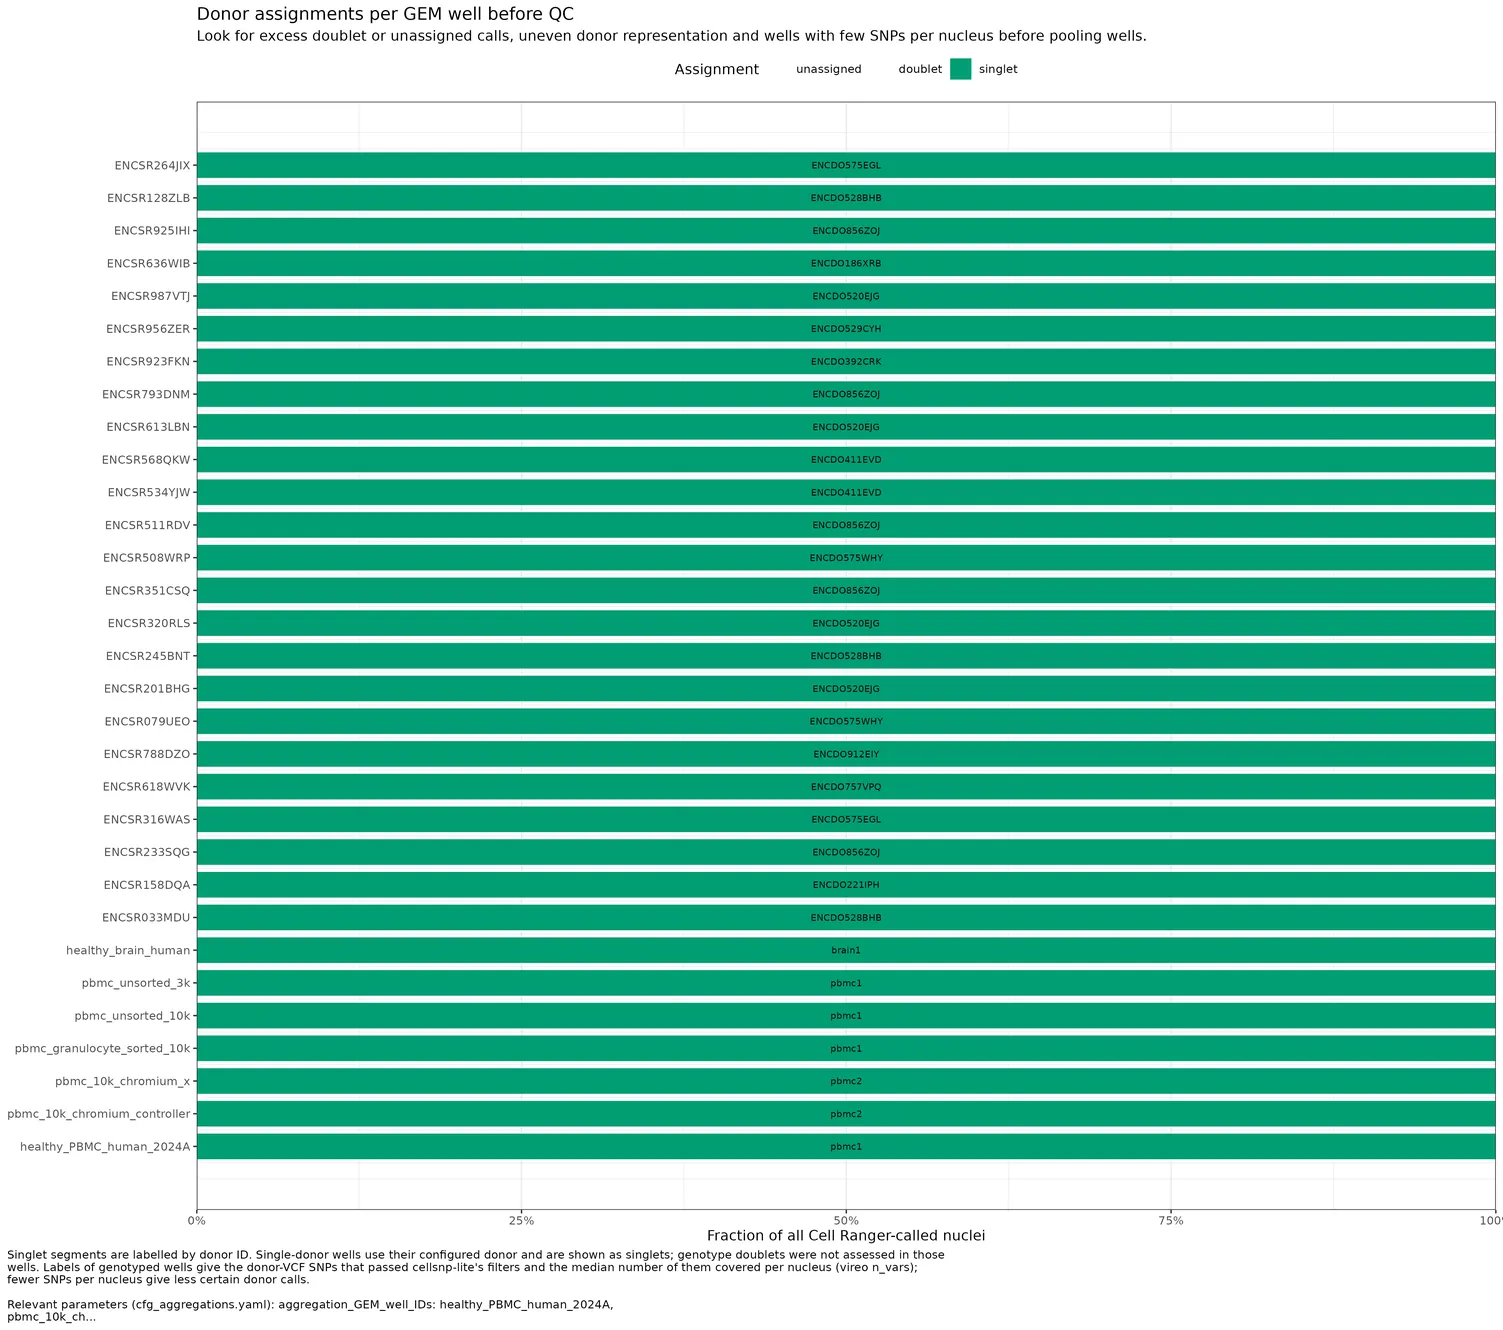
Plot 100-percent stacked assignment bars per GEM well, with donor labels inside singlet segments. demultiplexing_assignment_bars.1_pre_aggregation_QC
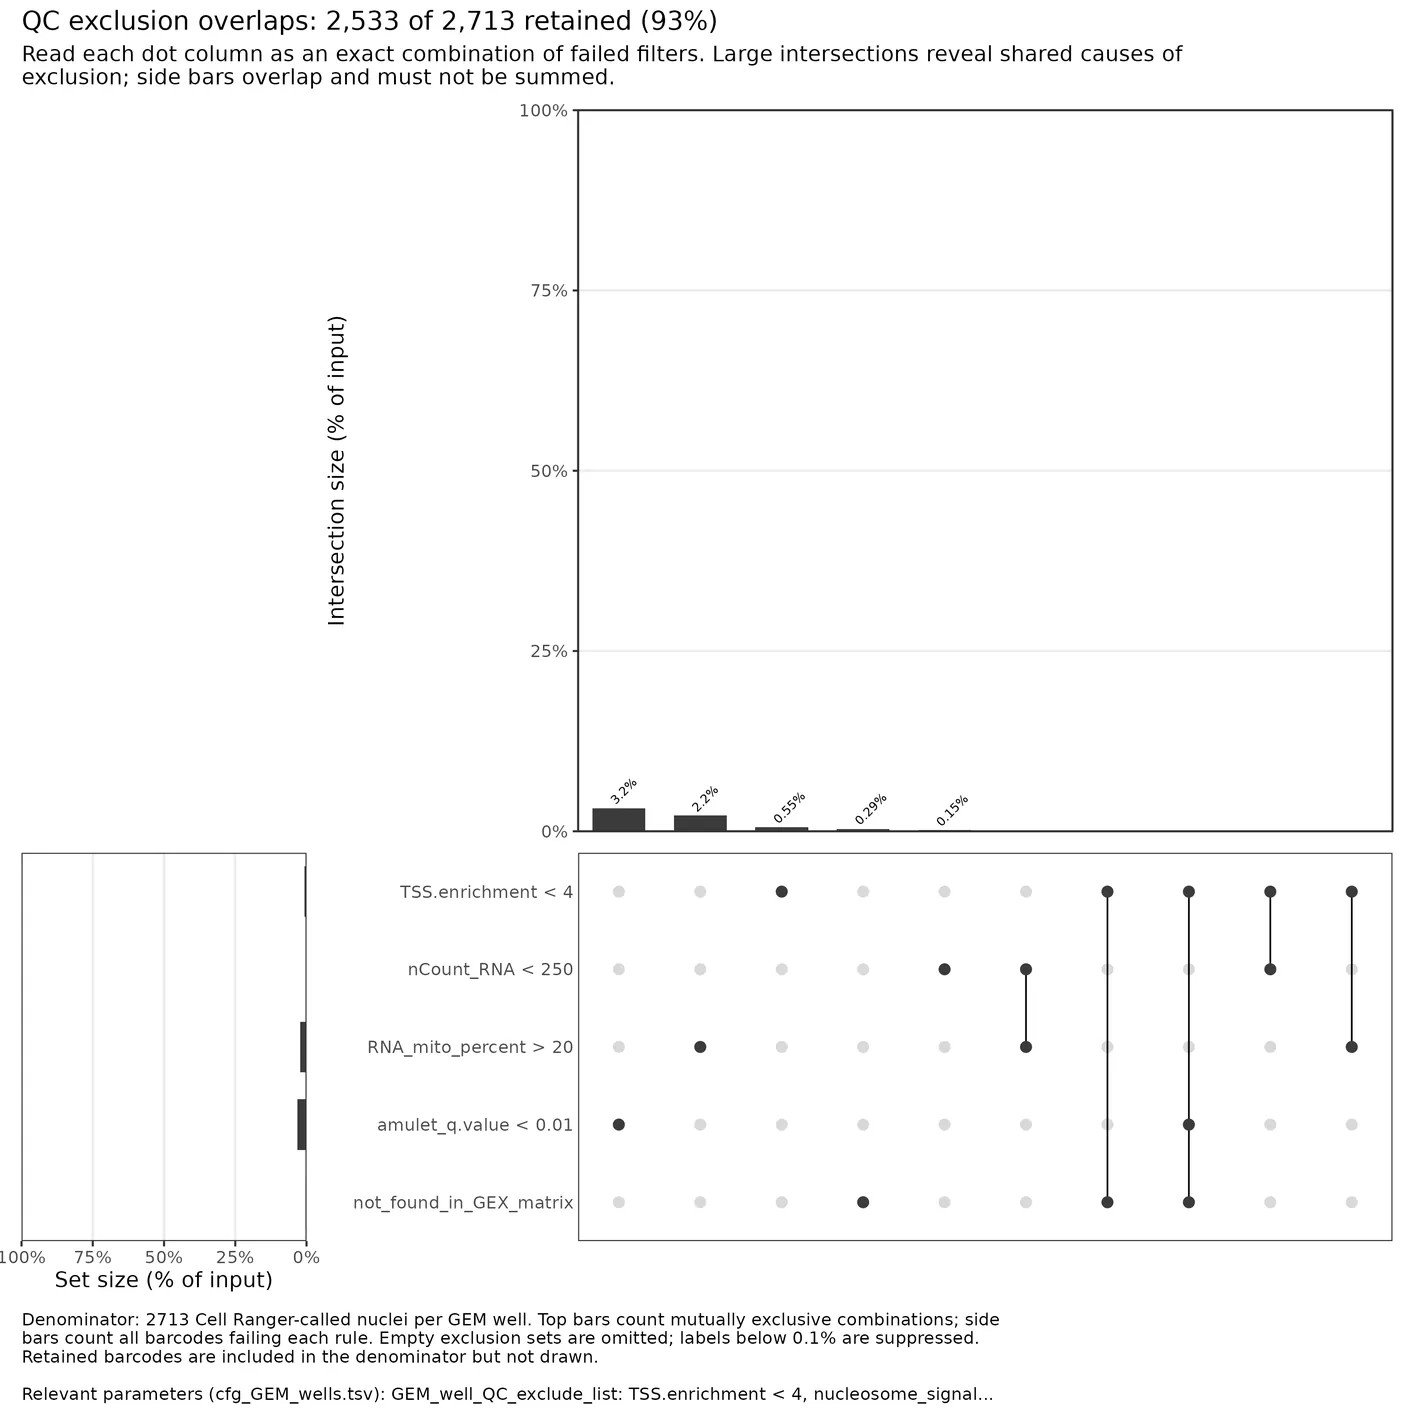
Plot an UpSet plot of CellRanger-only QC exclusion overlaps and save to file. excluded_cellranger_only_barcodes_by_type_upset.1_pre_aggregation_QC
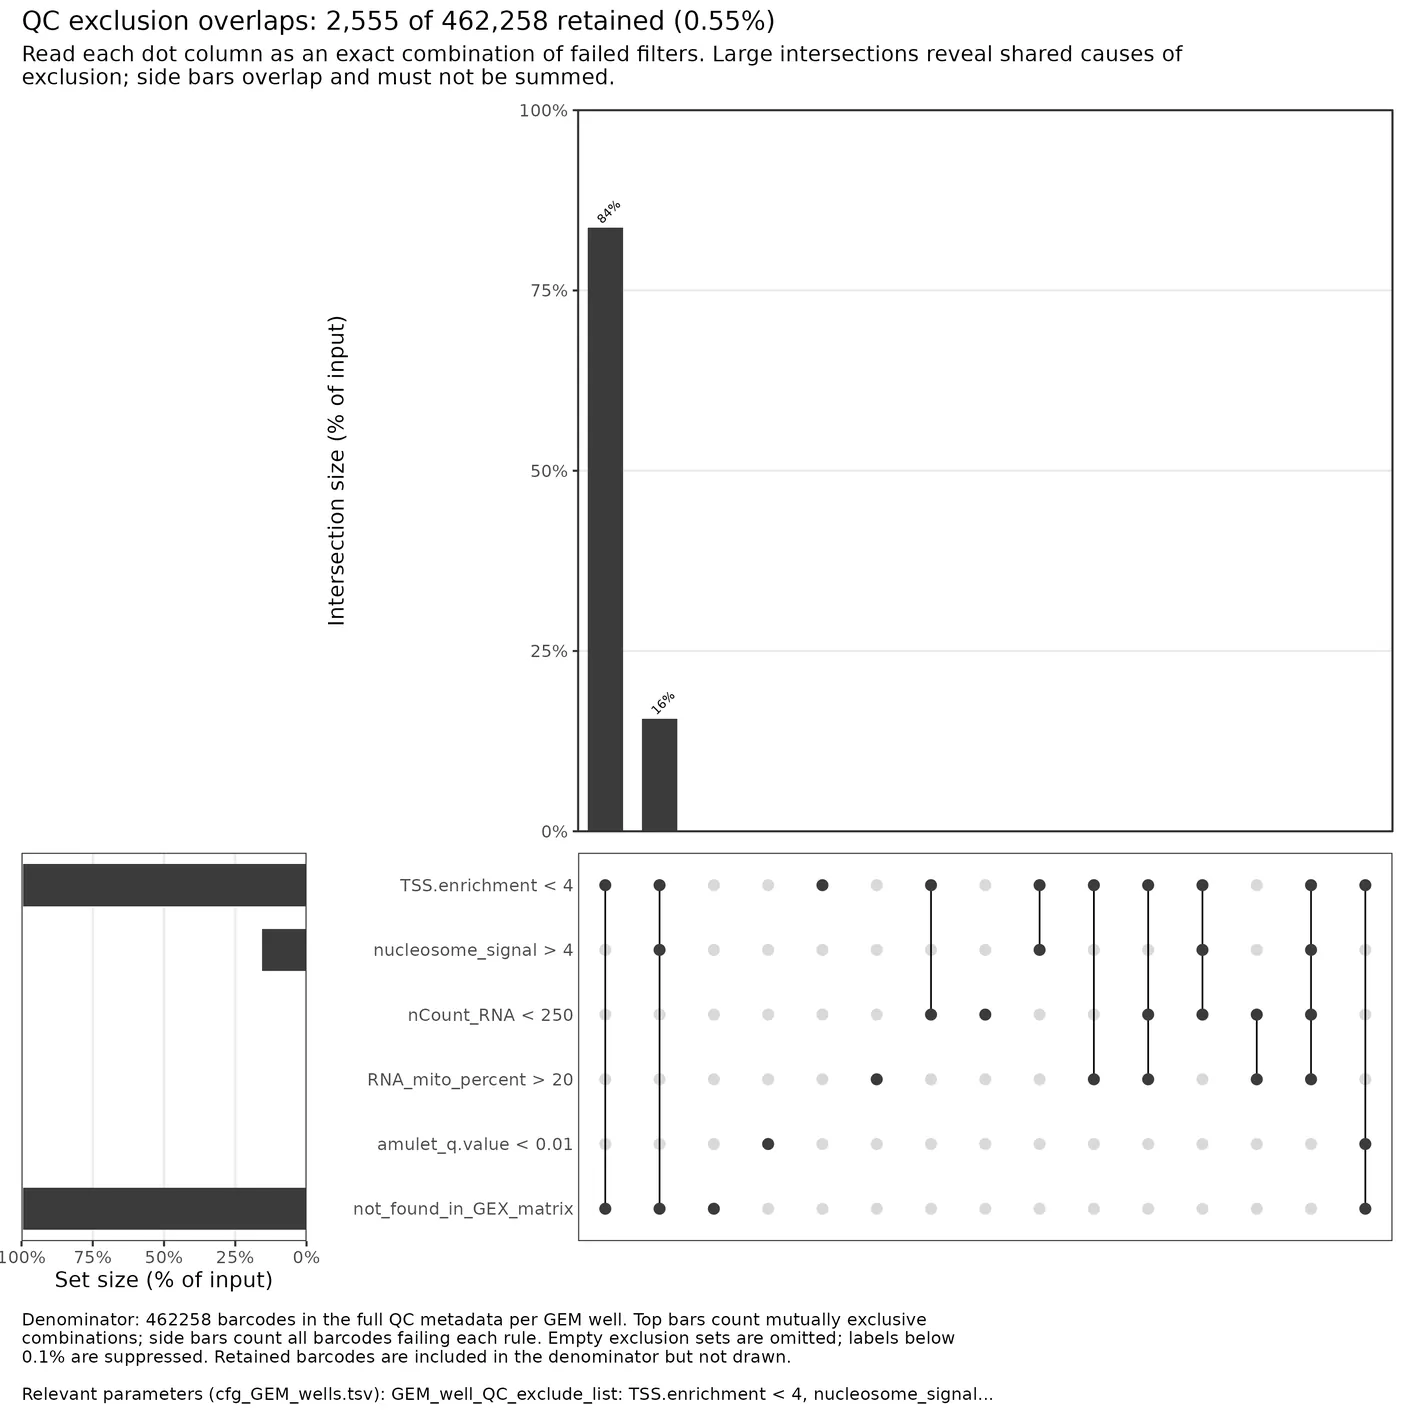
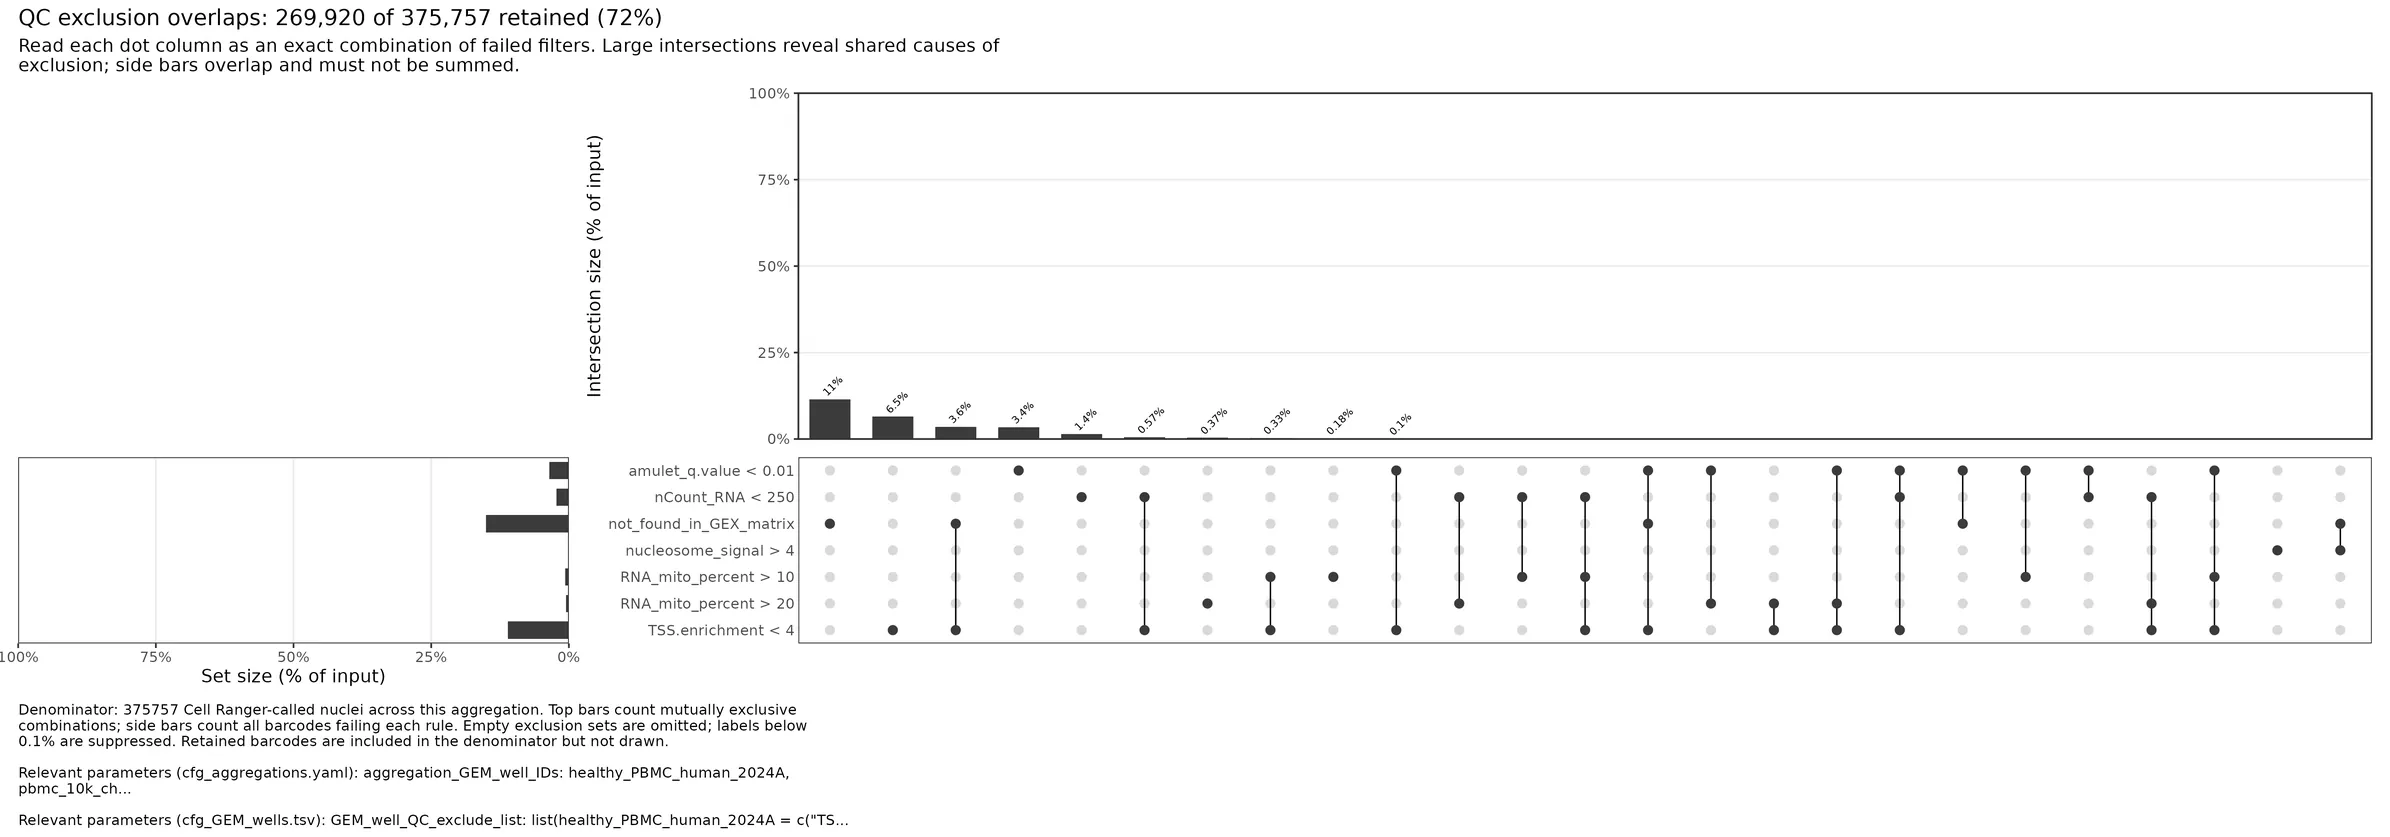
Plot an UpSet plot of per GEM well QC exclusion overlaps and save to file. excluded_barcodes_by_type_upset.1_pre_aggregation_QC
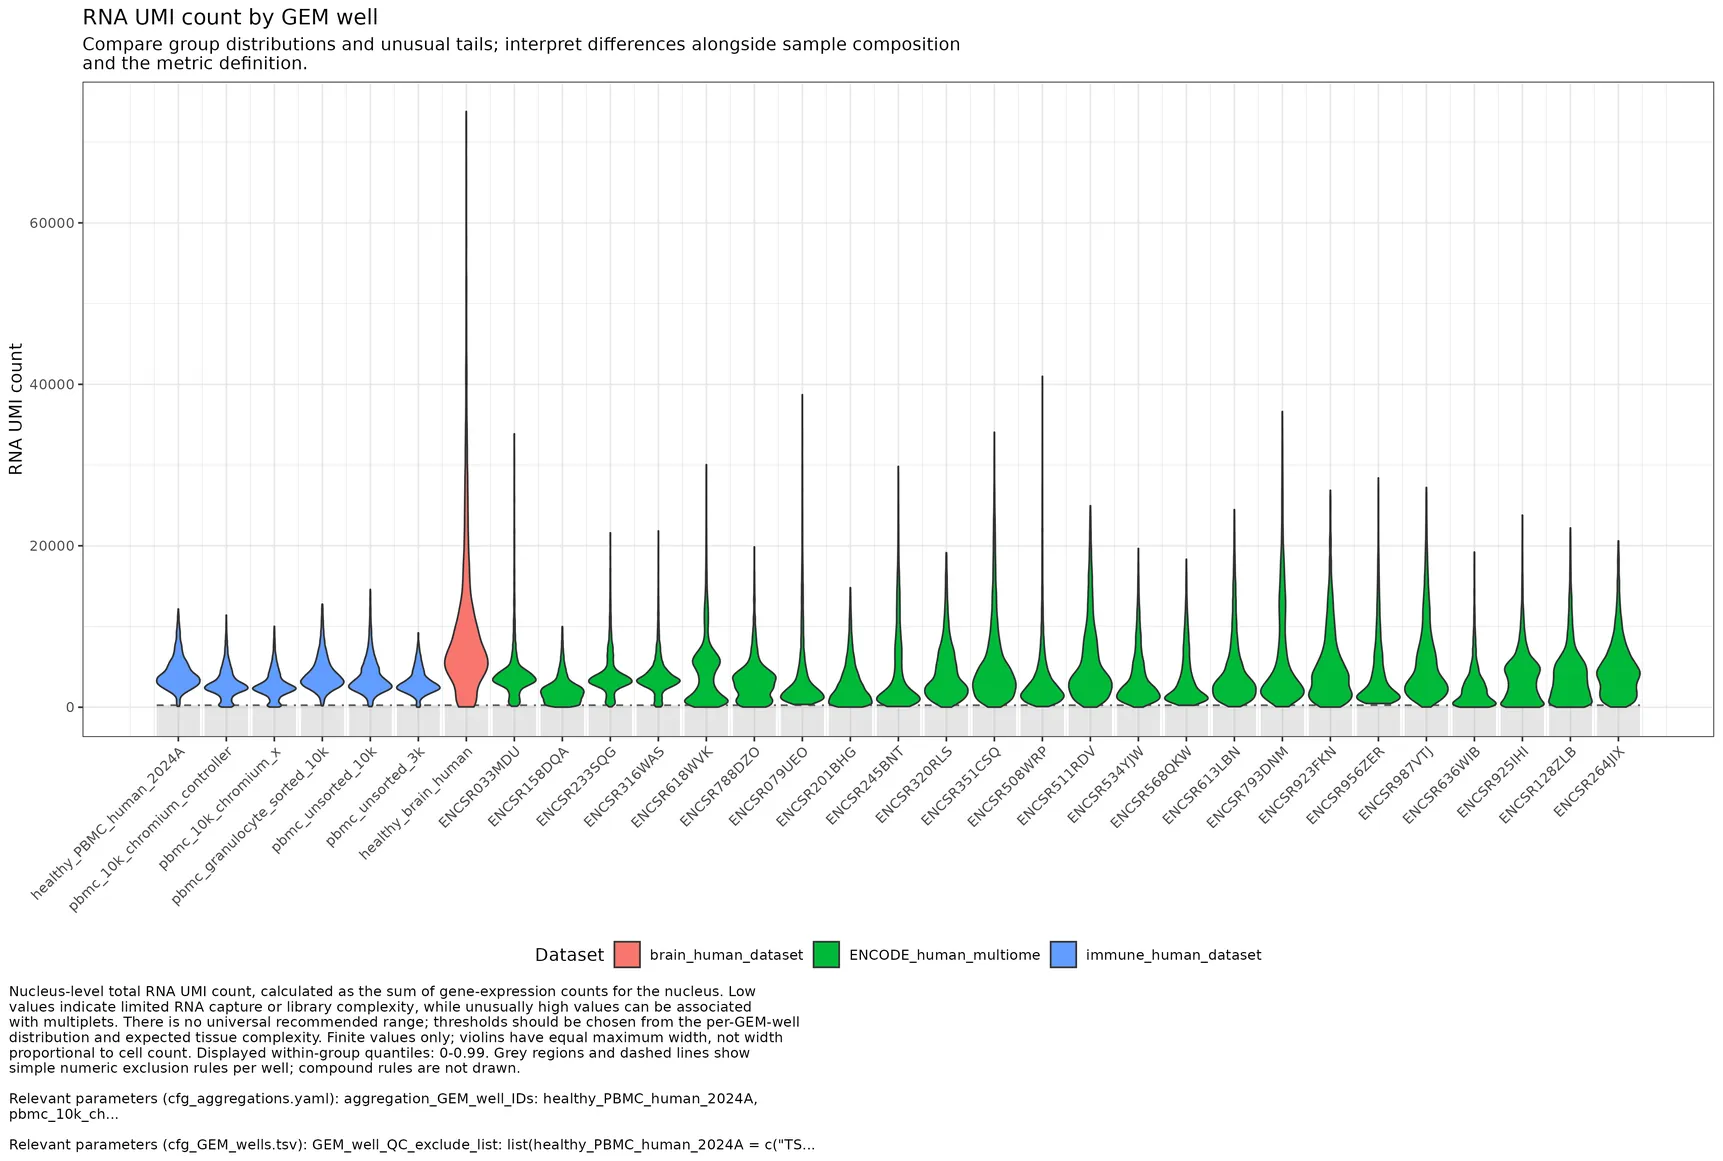
Compare pre-filter QC distributions and configured cutoffs across GEM wells in this aggregation. per_aggregation_GEM_well_QC_comparisons.1_pre_aggregation_QC
Plot an UpSet plot of aggregation-level CellRanger-only QC exclusion overlaps across all GEM wells and save to file. aggregation_excluded_cellranger_only_barcodes_by_type_upset.1_pre_aggregation_QC
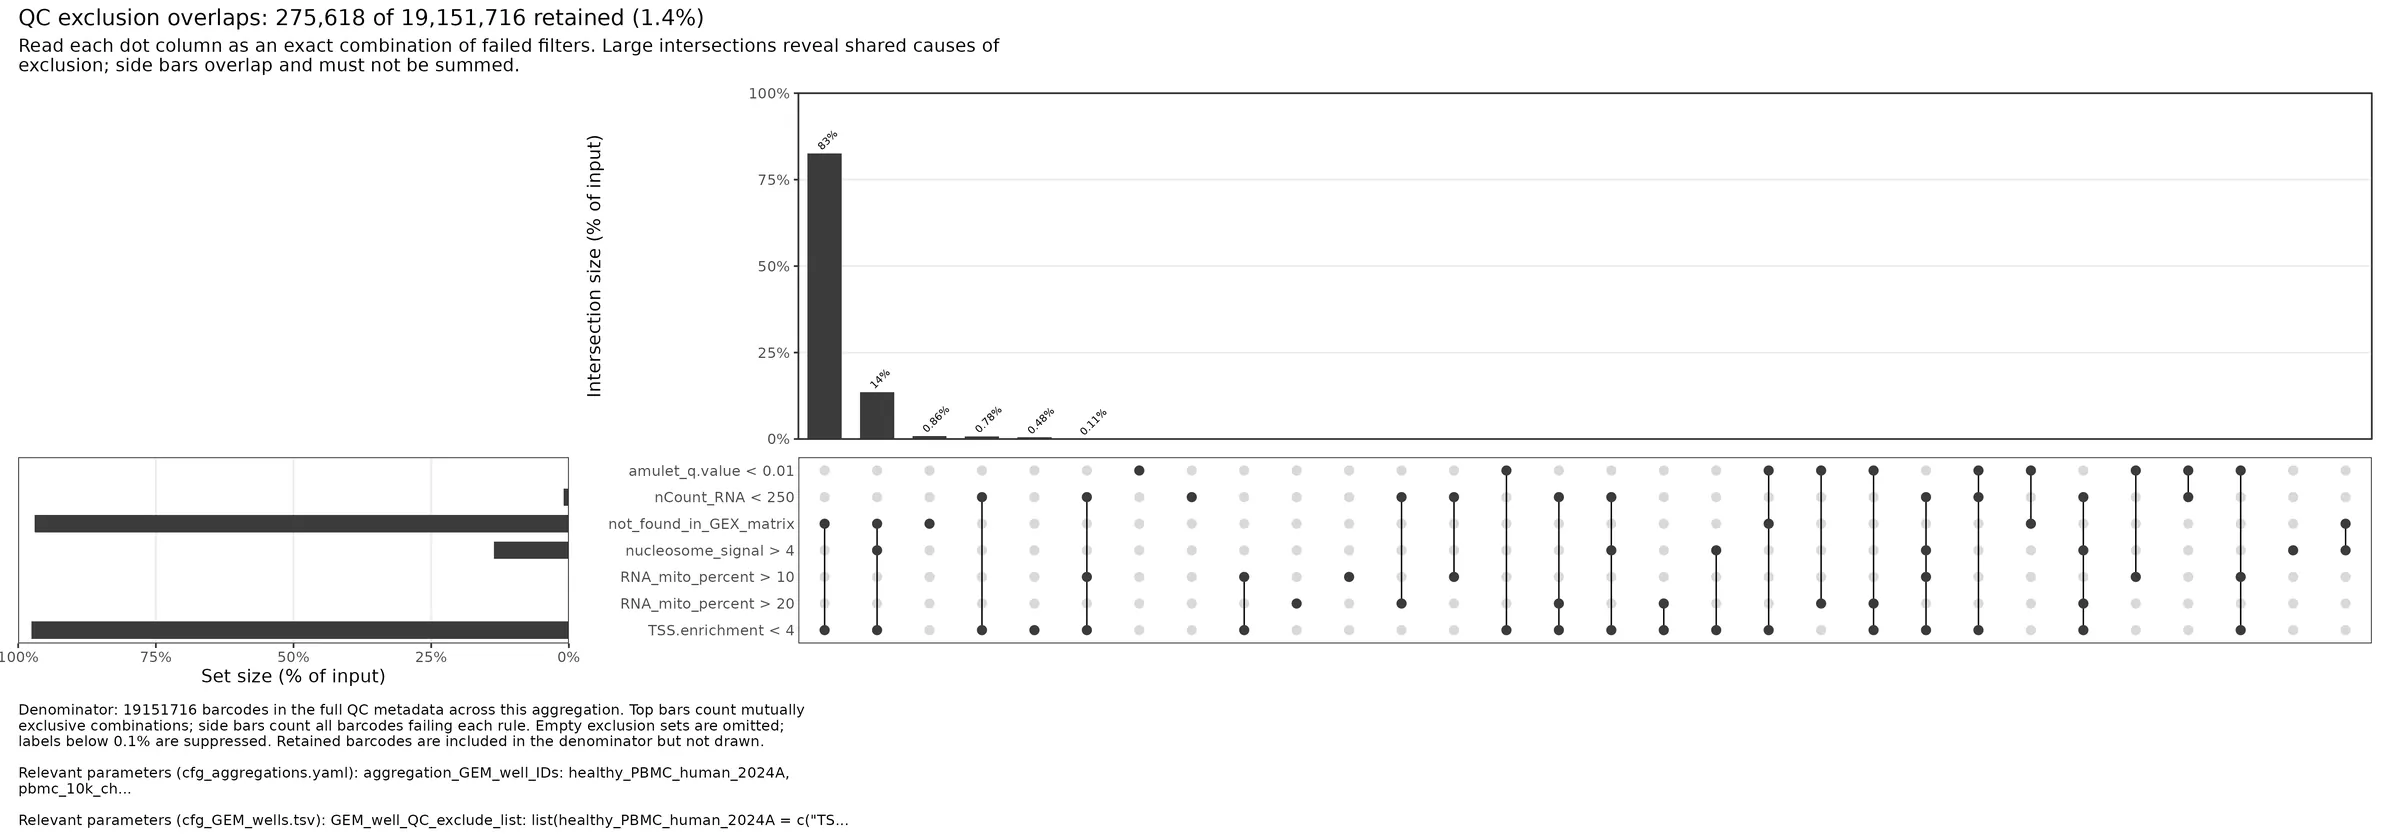
Plot an UpSet plot of aggregation-level QC exclusion overlaps across all GEM wells and save to file. aggregation_excluded_barcodes_by_type_upset.1_pre_aggregation_QC
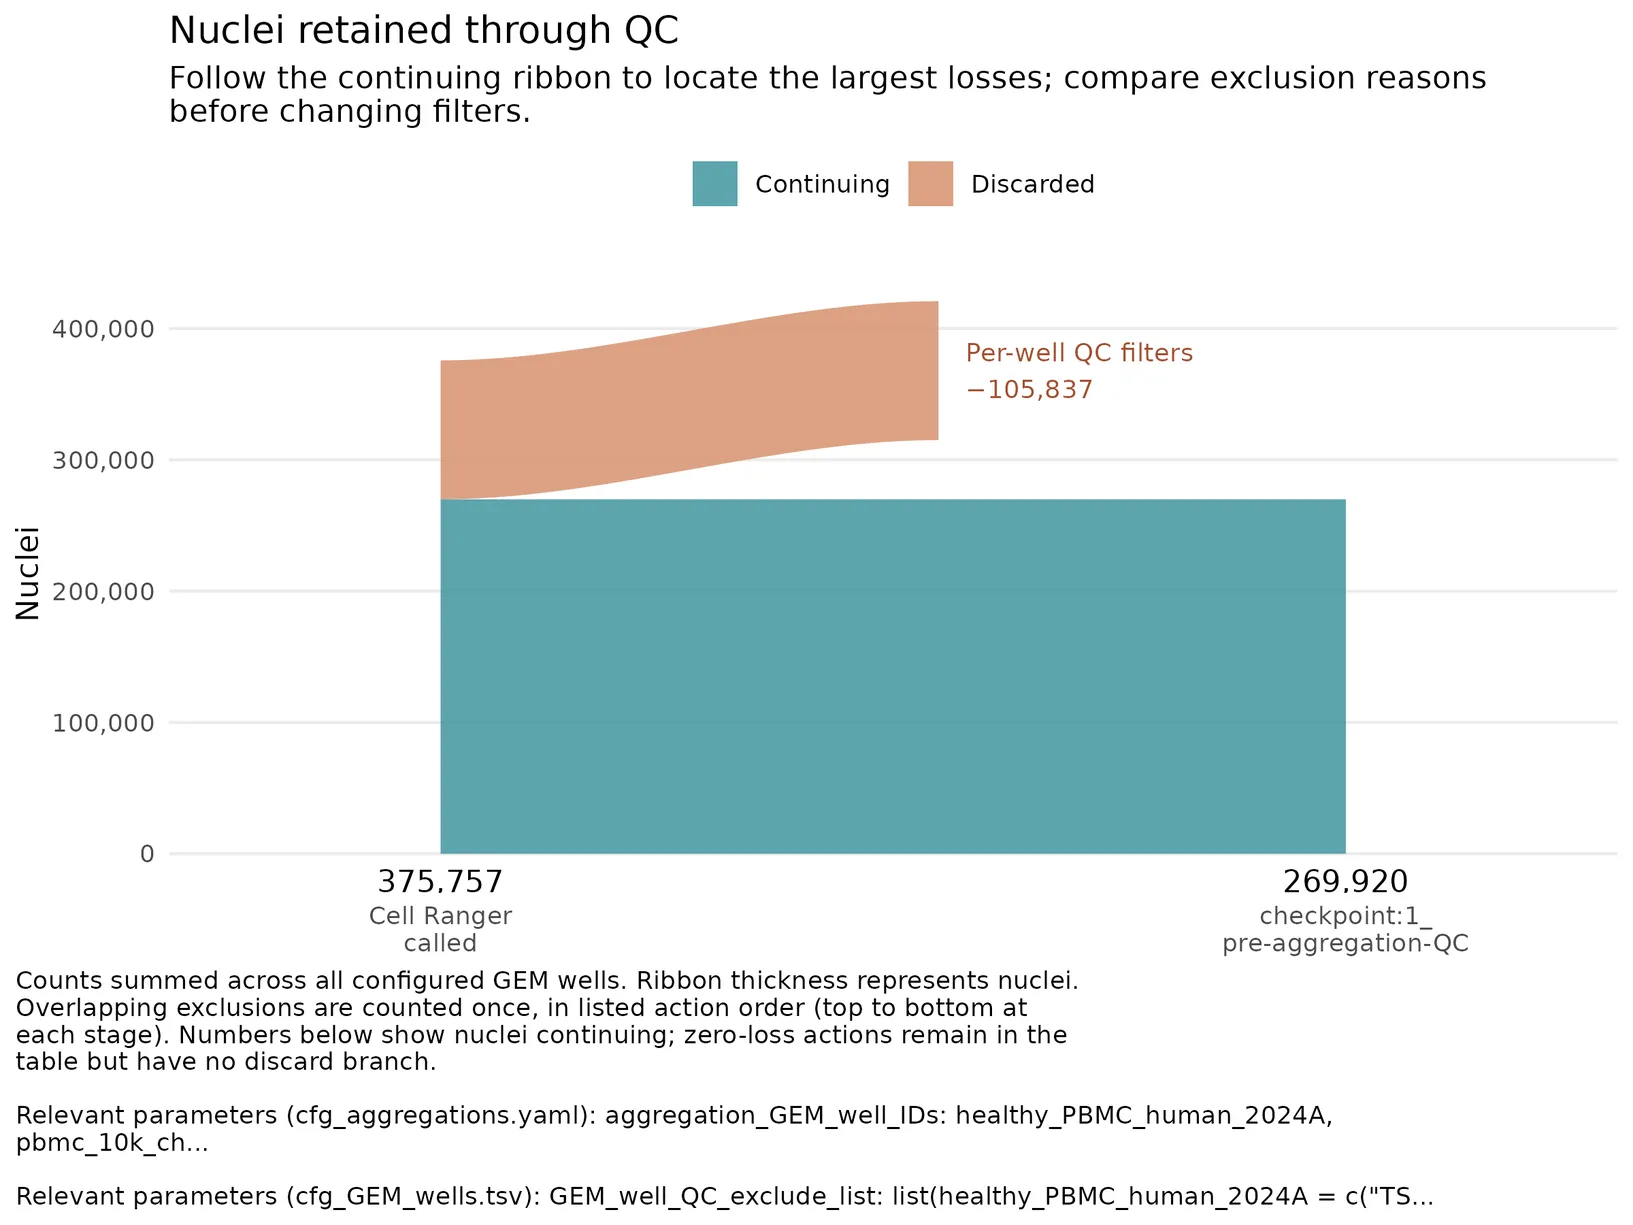
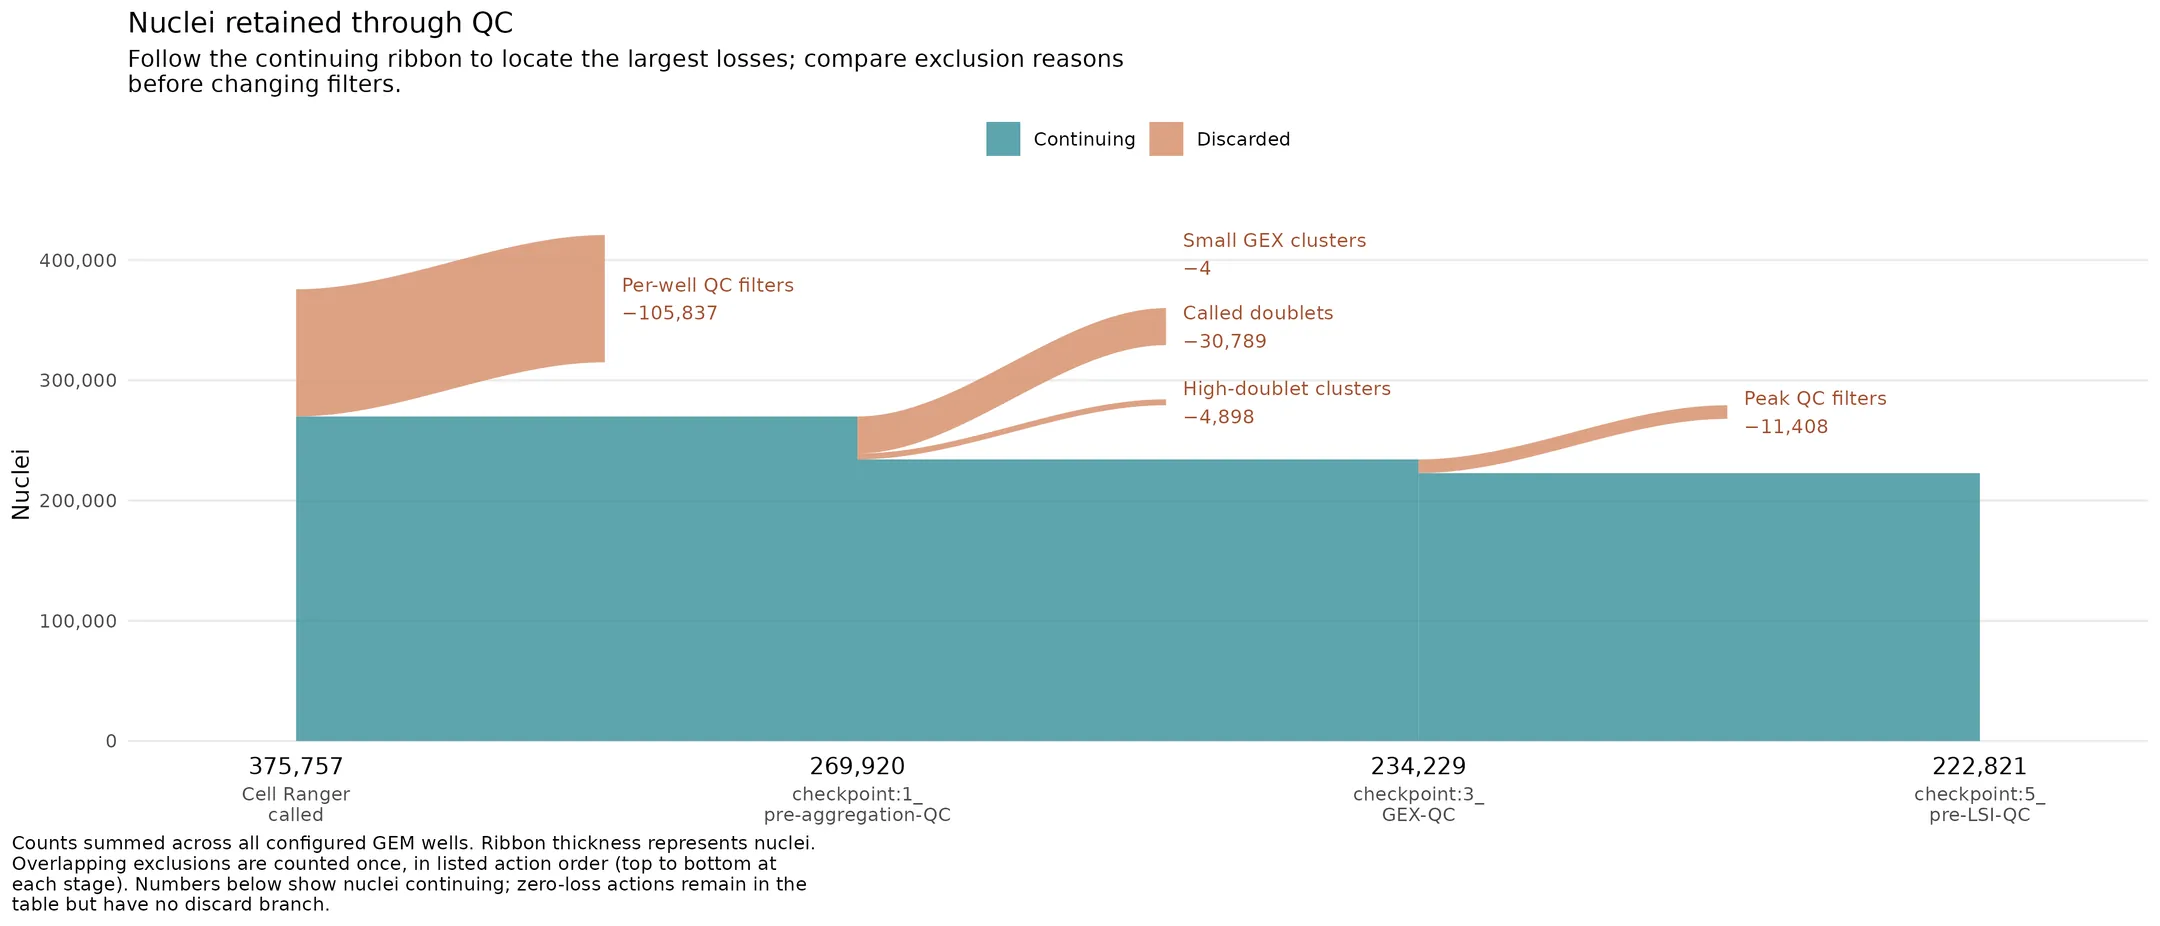
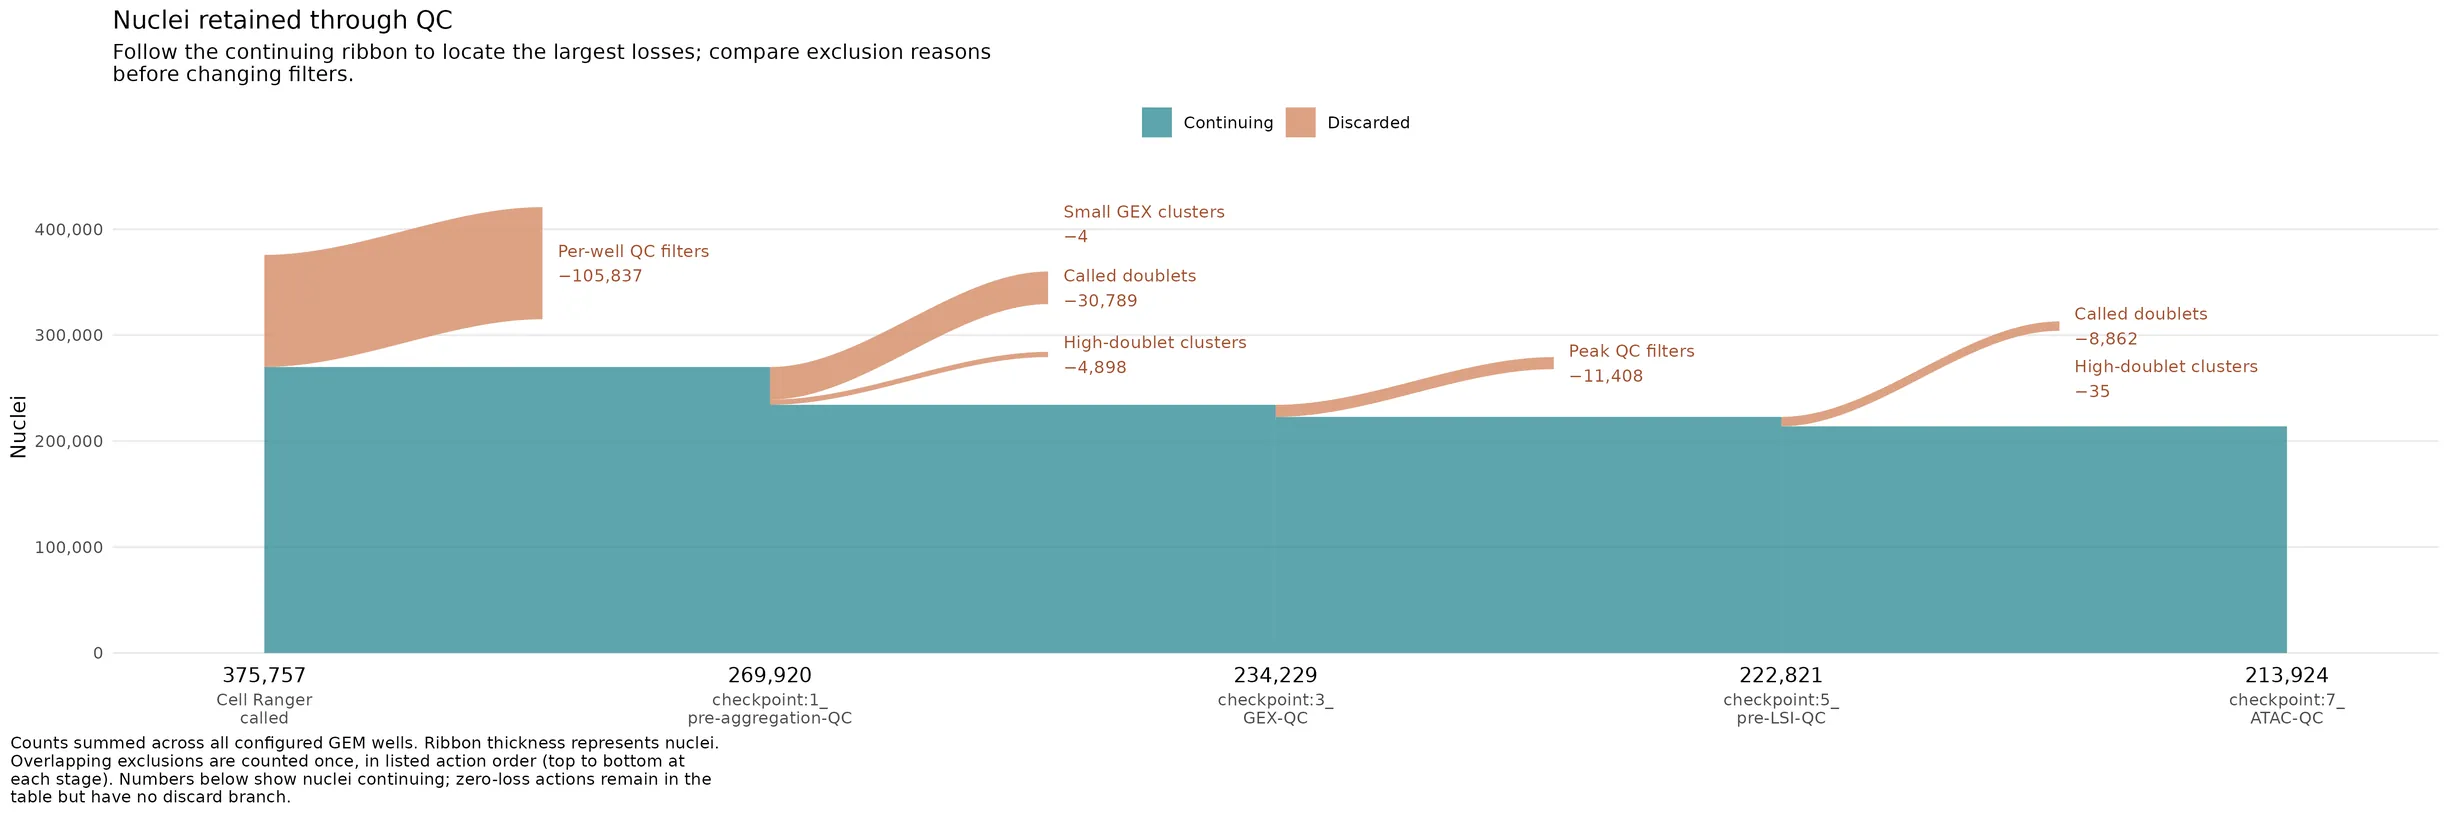
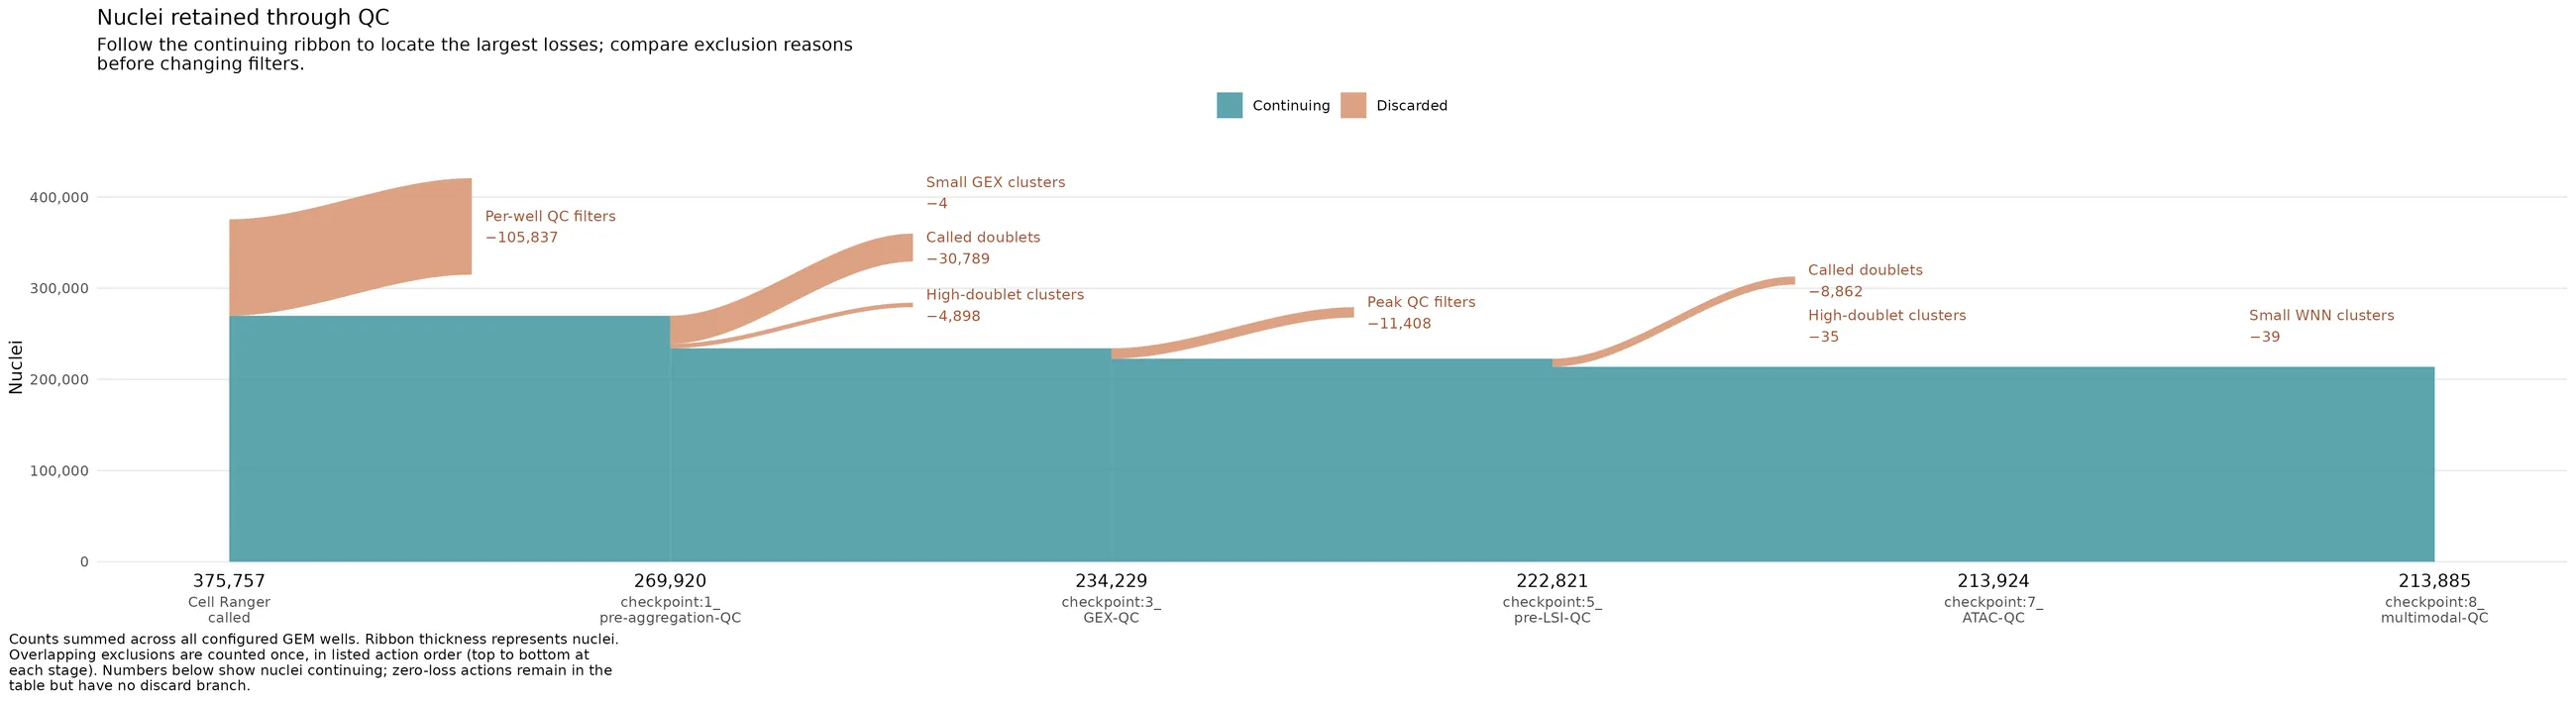
Plot cumulative nuclei retention through per-well QC. cell_retention_flow_plot.1_pre_aggregation_QC
2. GEX dimension reduction
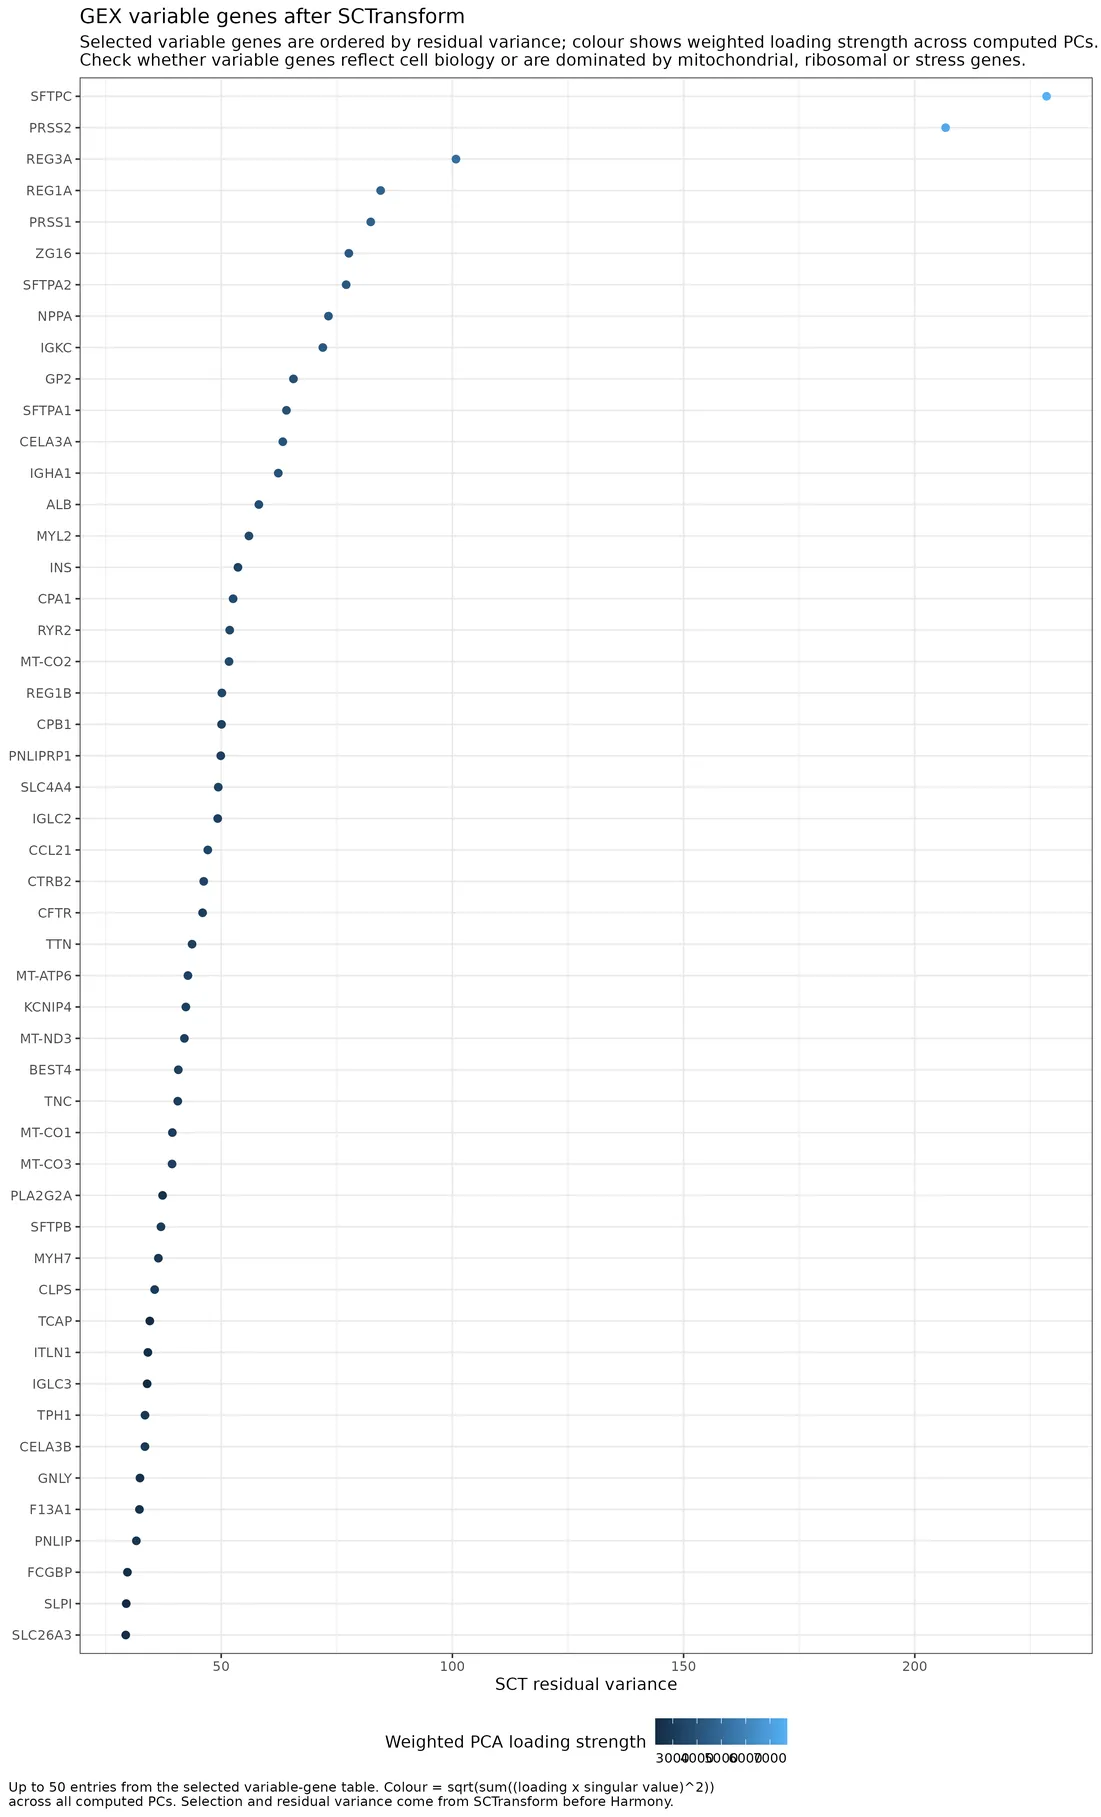
Plot residual variance of top variable genes selected from SCTransform residuals. variable_feature_plot.2_GEX_PCA_QC
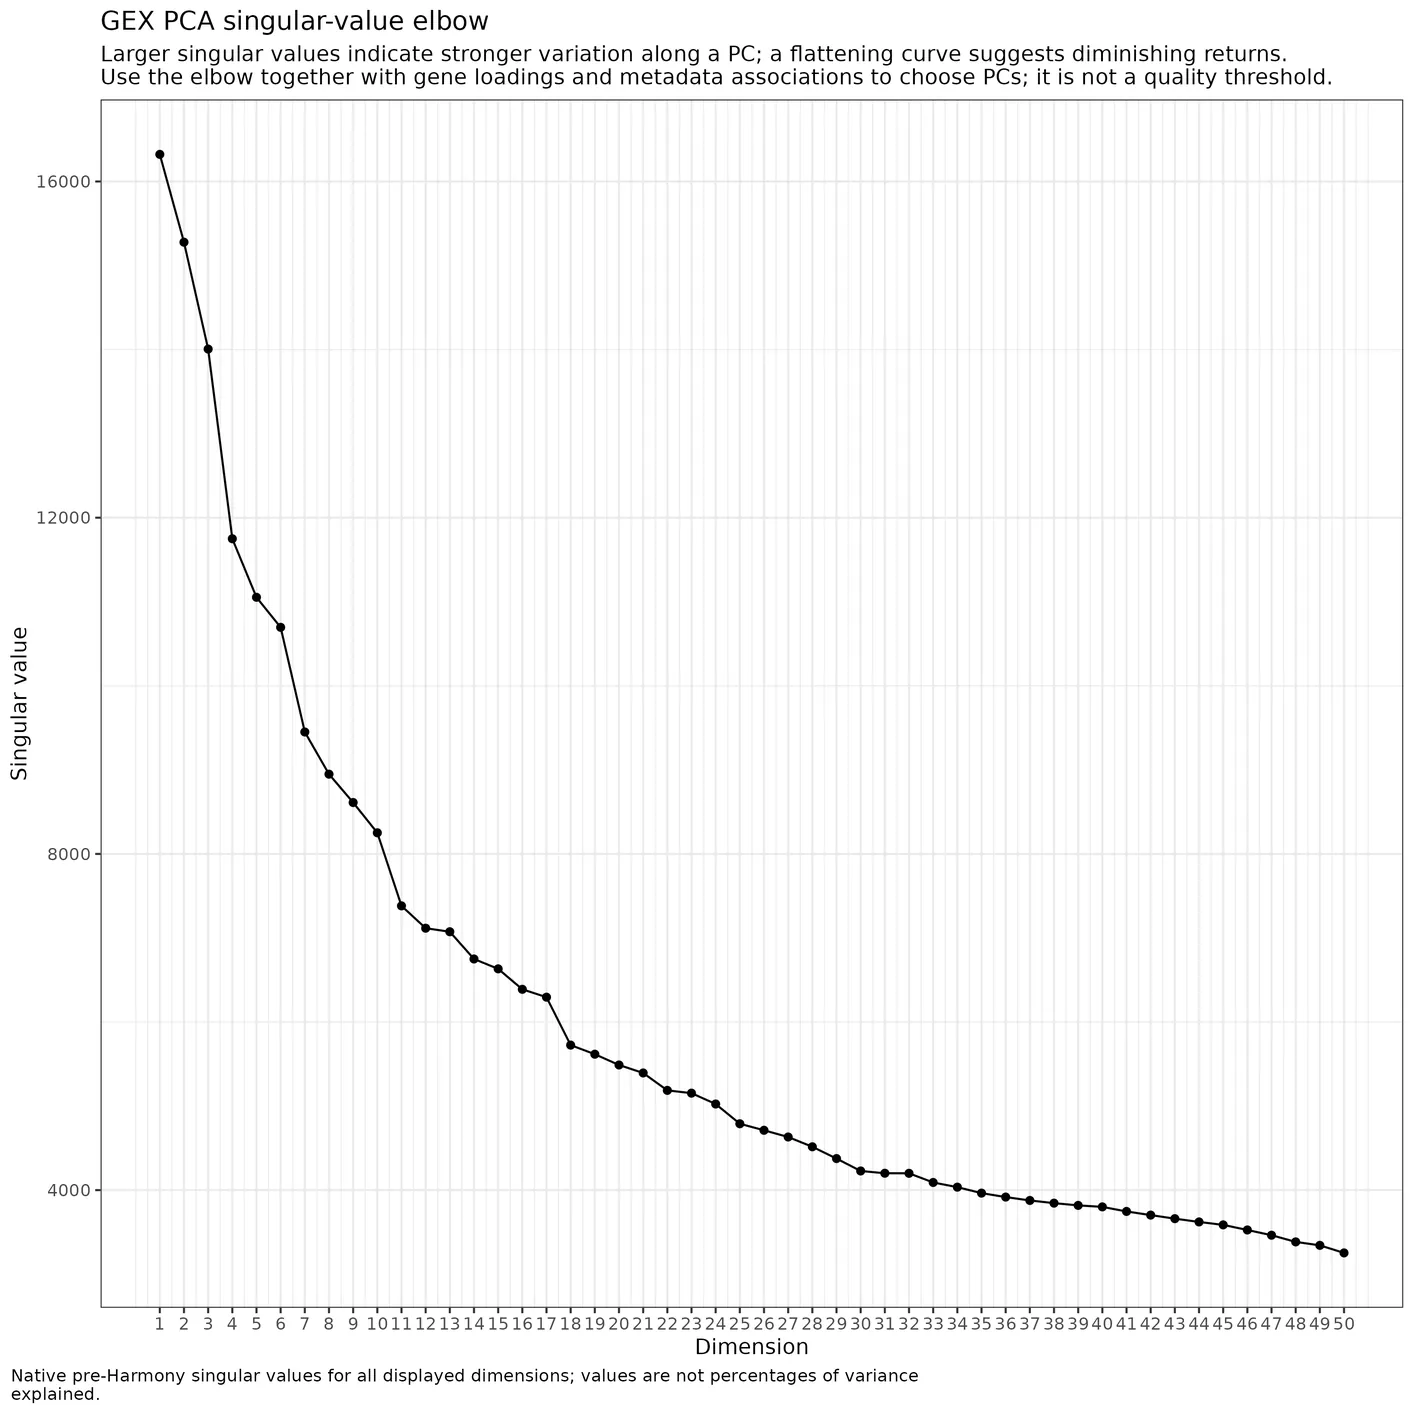
Elbow plot of native GEX PCA singular values. PCA_singular_values_elbow_plot.2_GEX_PCA_QC
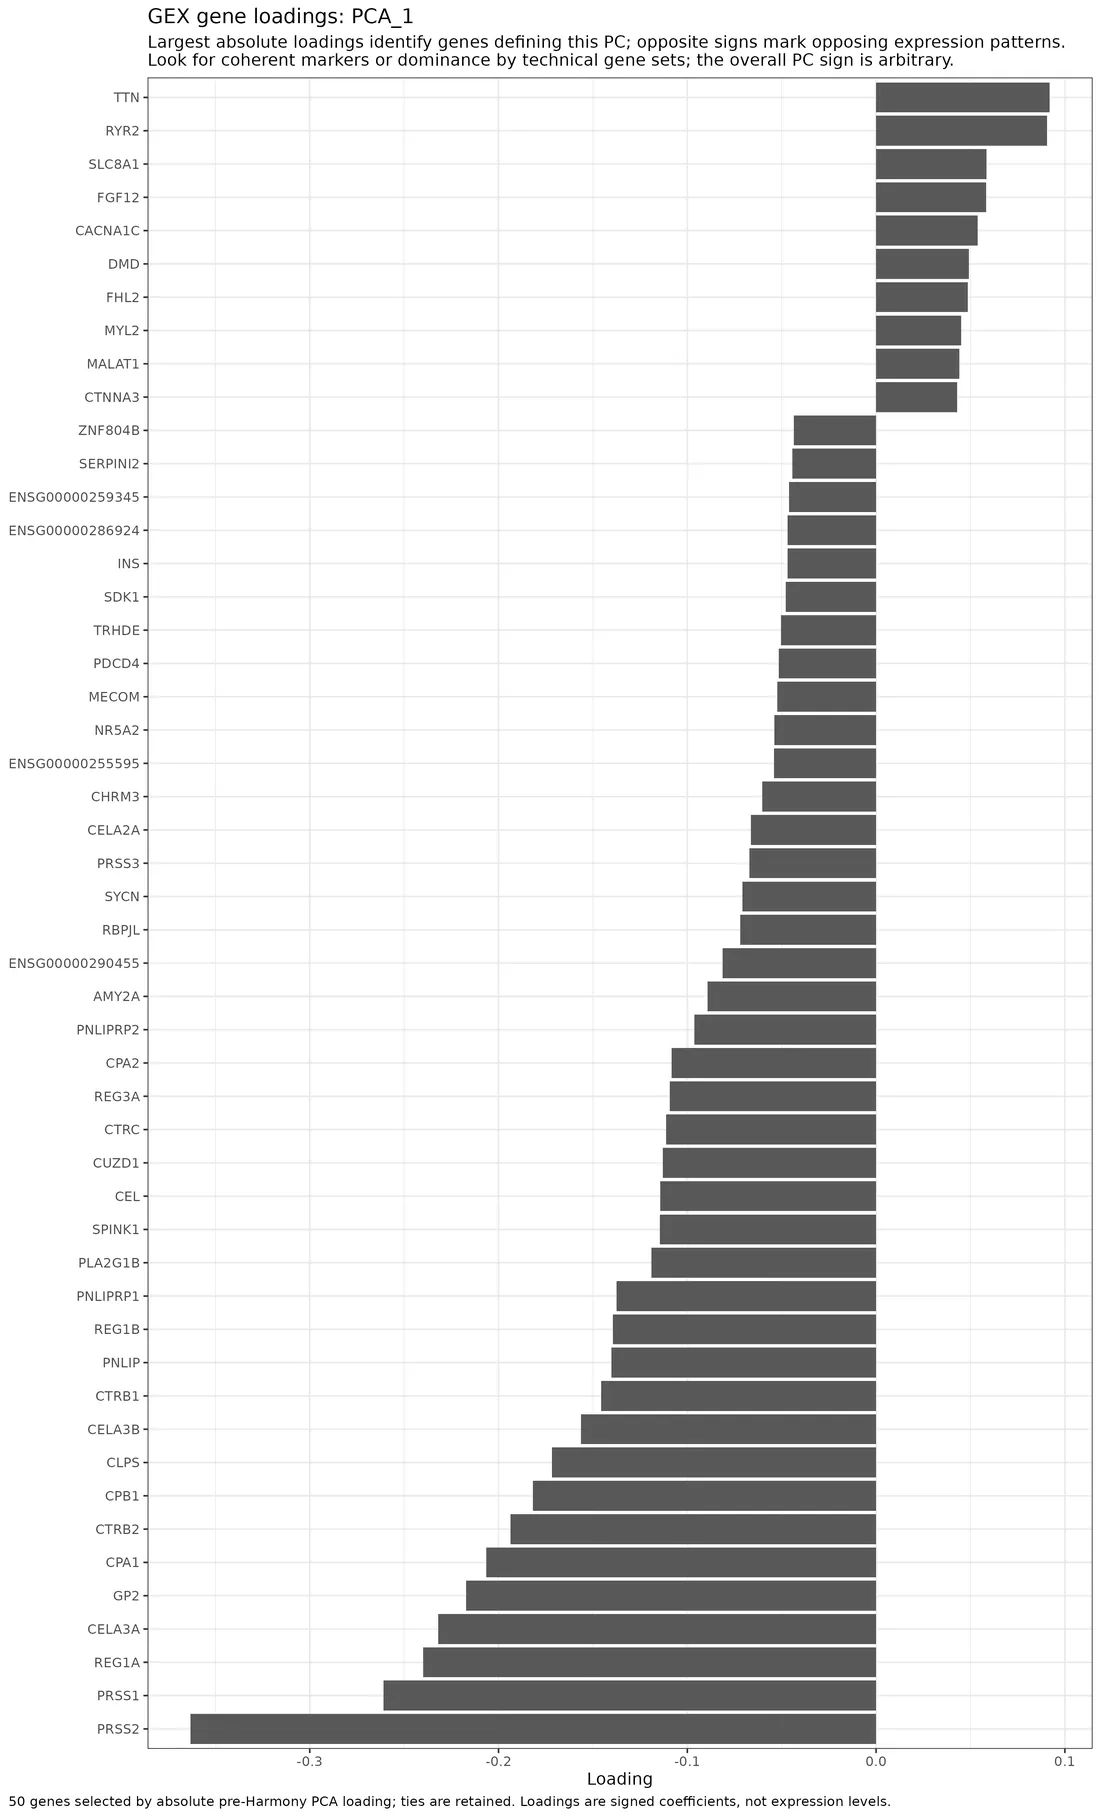
Plot top gene loadings for each GEX PCA dimension. VizDimLoadings_plots.2_GEX_PCA_QC
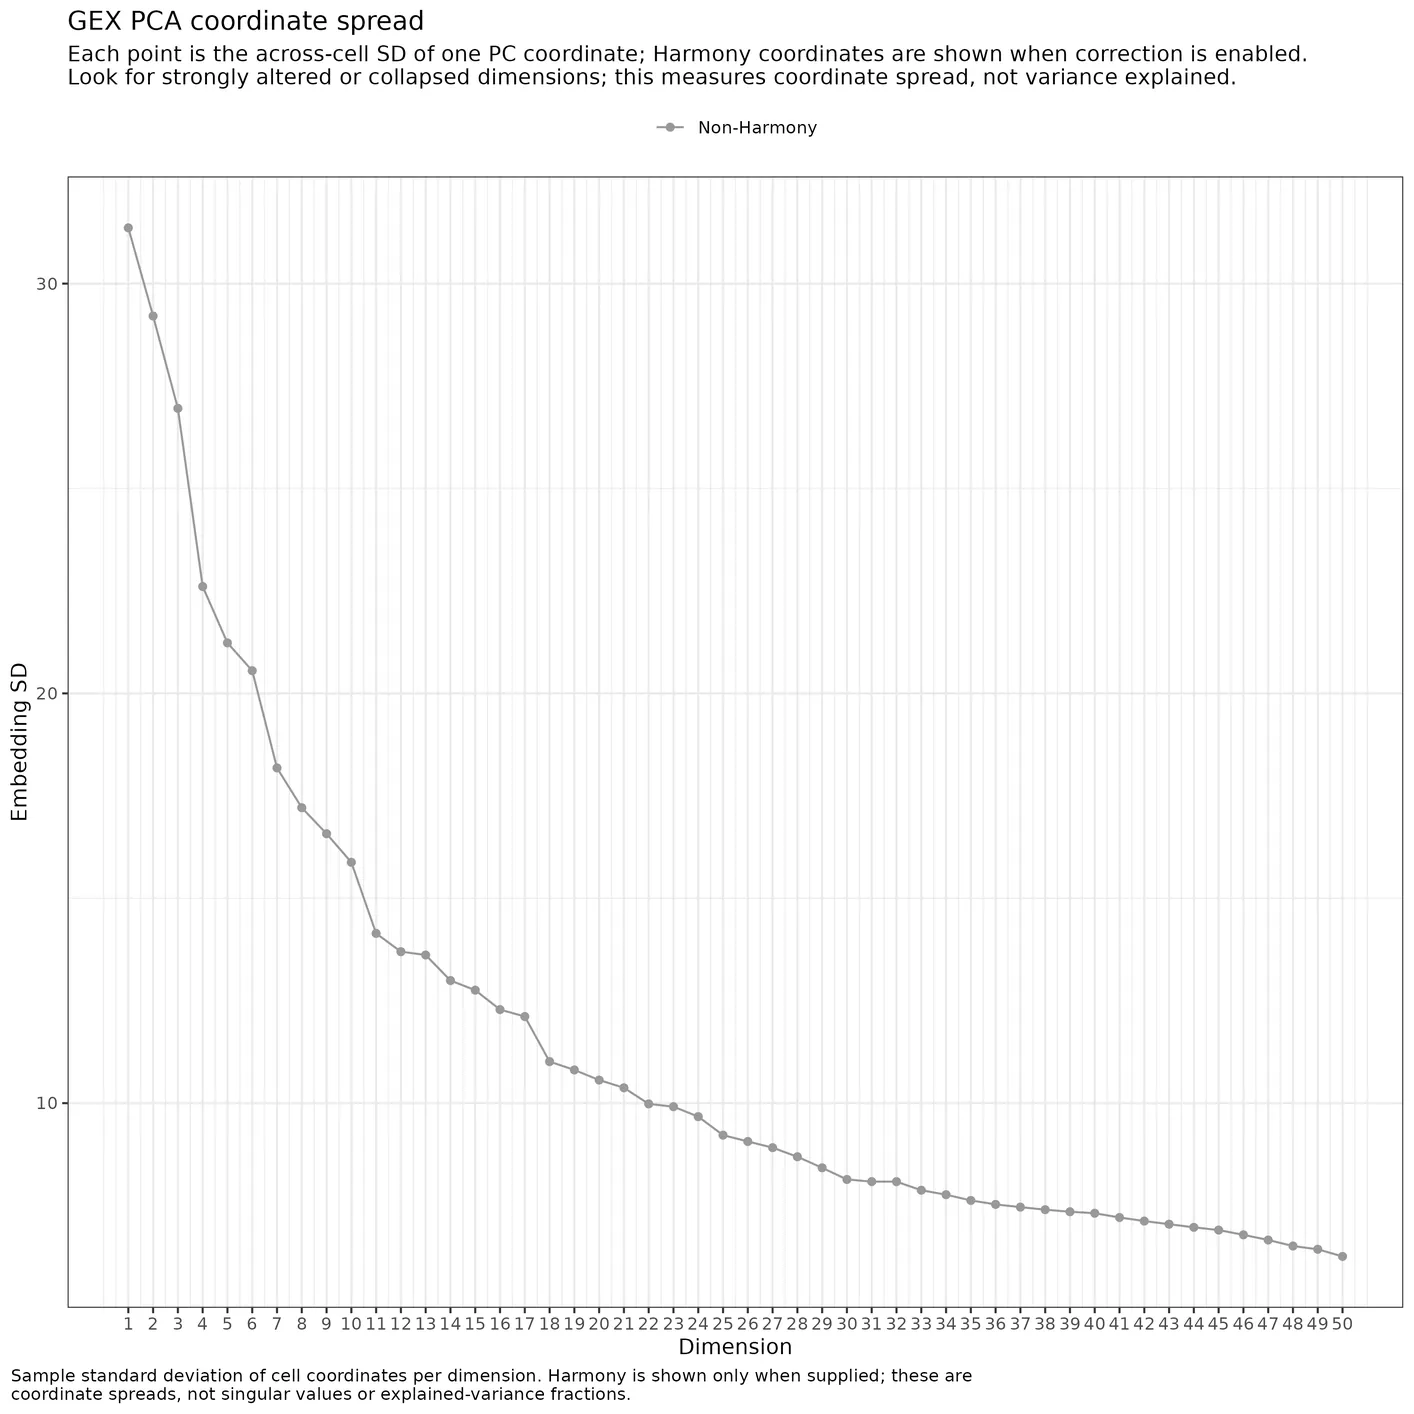
Non-Harmony and Harmony GEX PCA embedding coordinate SD plot. PCA_embedding_sdev_plot.2_GEX_PCA_QC
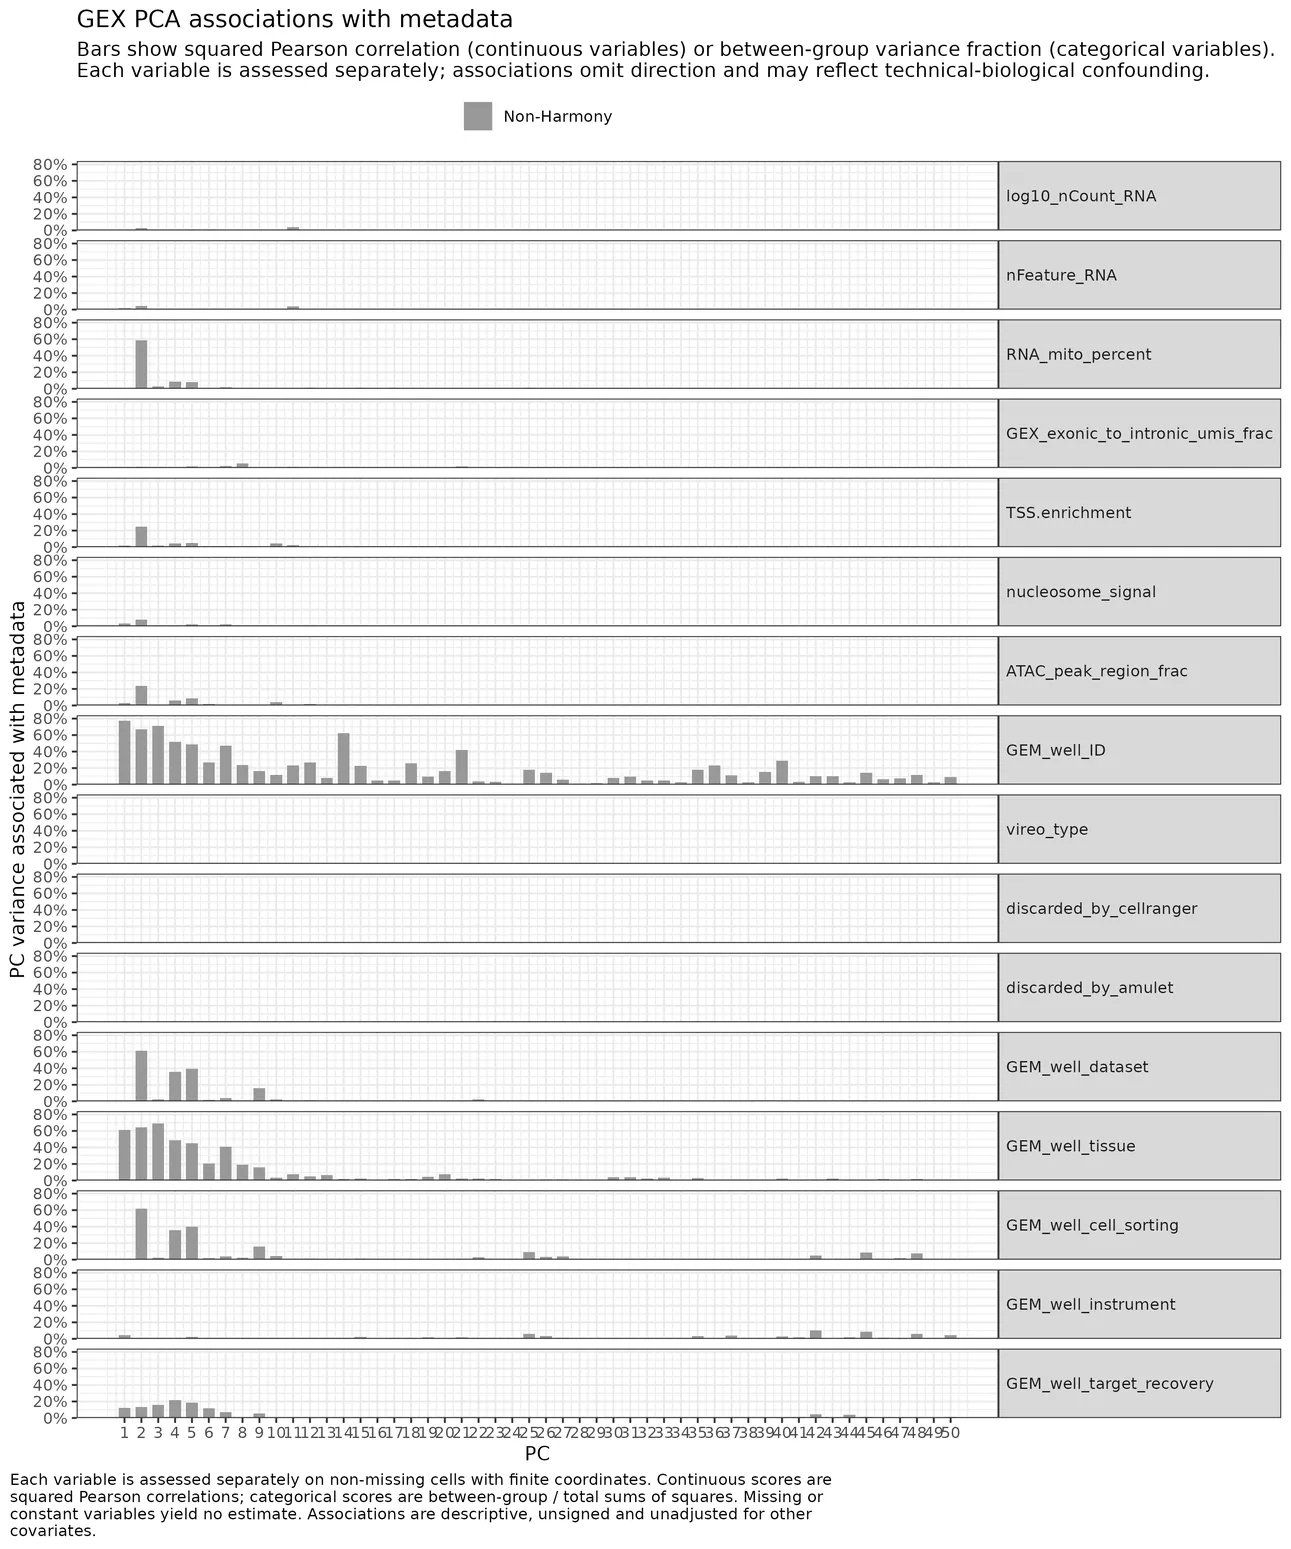
Non-Harmony and Harmony GEX PCA metadata association bar plots. PCA_metadata_association_barplots.2_GEX_PCA_QC
3. GEX clusters and cell types
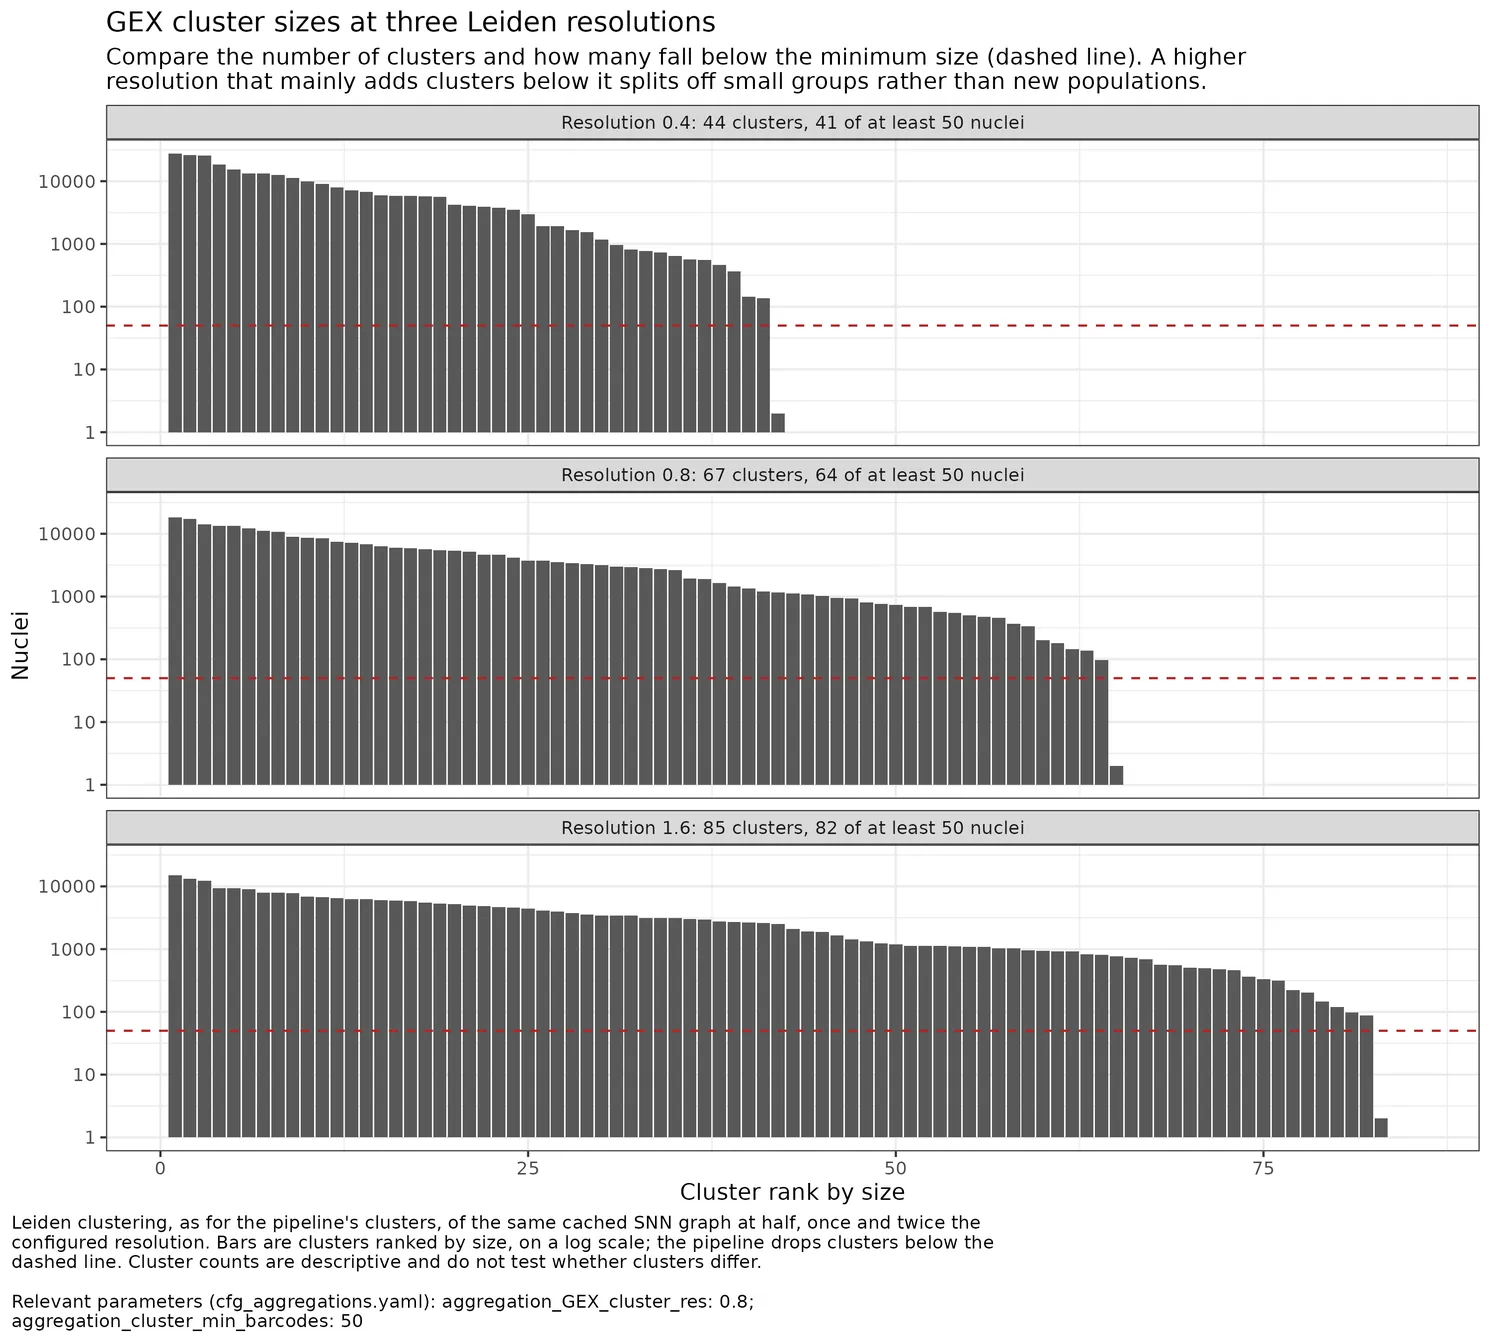
Plot GEX cluster sizes at half, once and twice the configured Leiden resolution. resolution_sweep_plot.3_GEX_QC
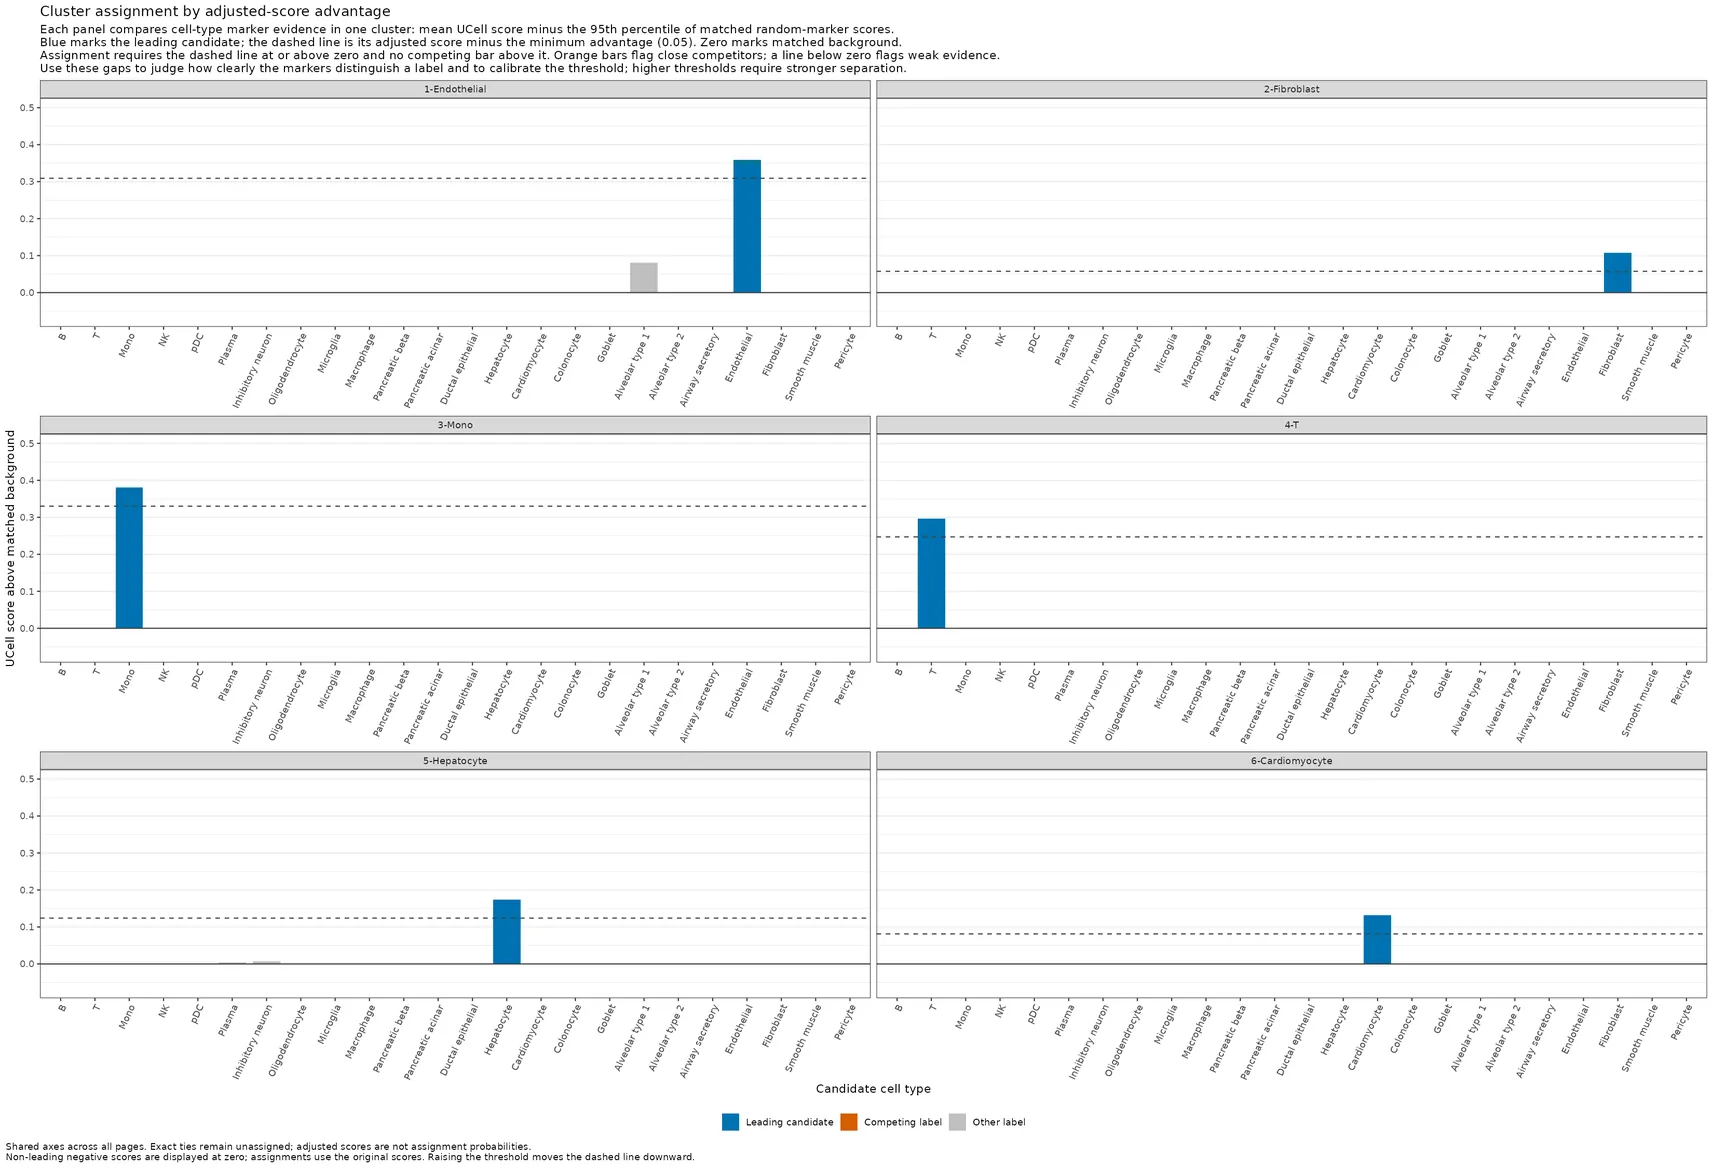
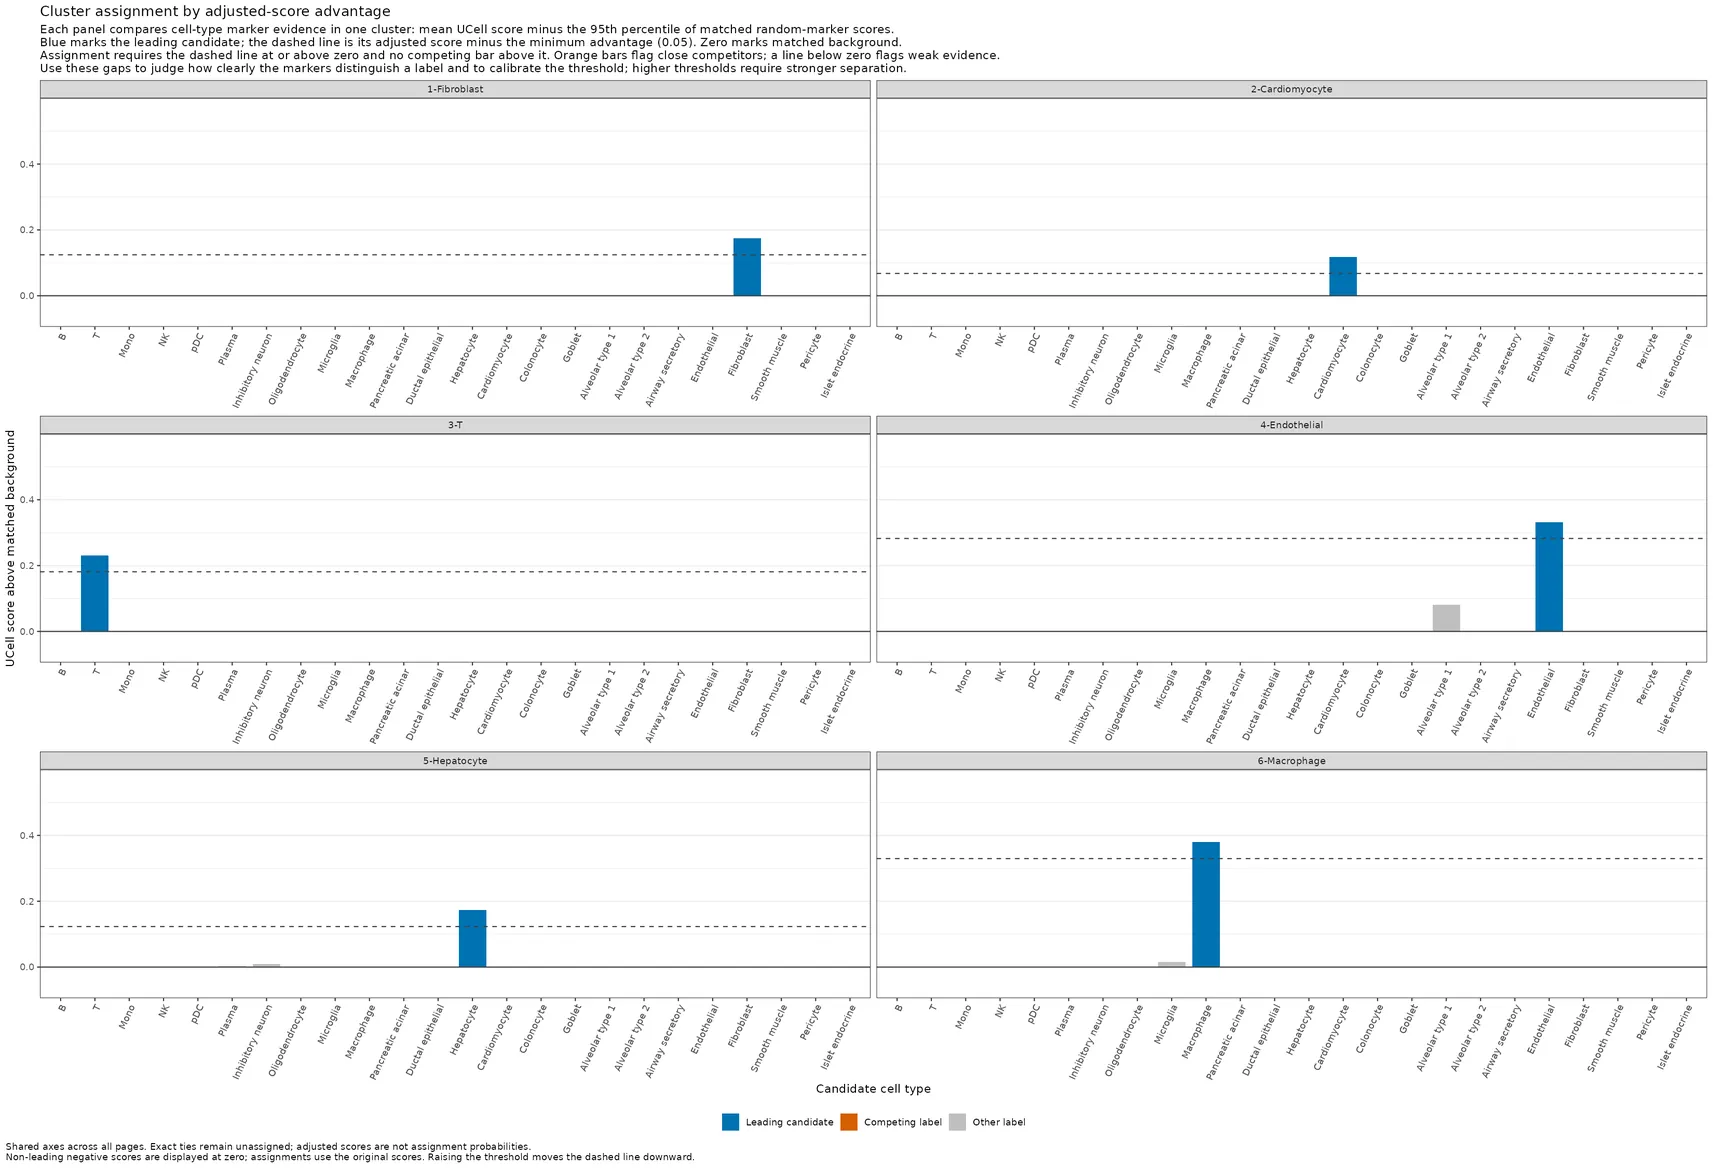
Faceted GEX adjusted-score bars with matched background and the minimum-advantage competition cutoff. cluster_UCell_advantage_plots.3_GEX_QC
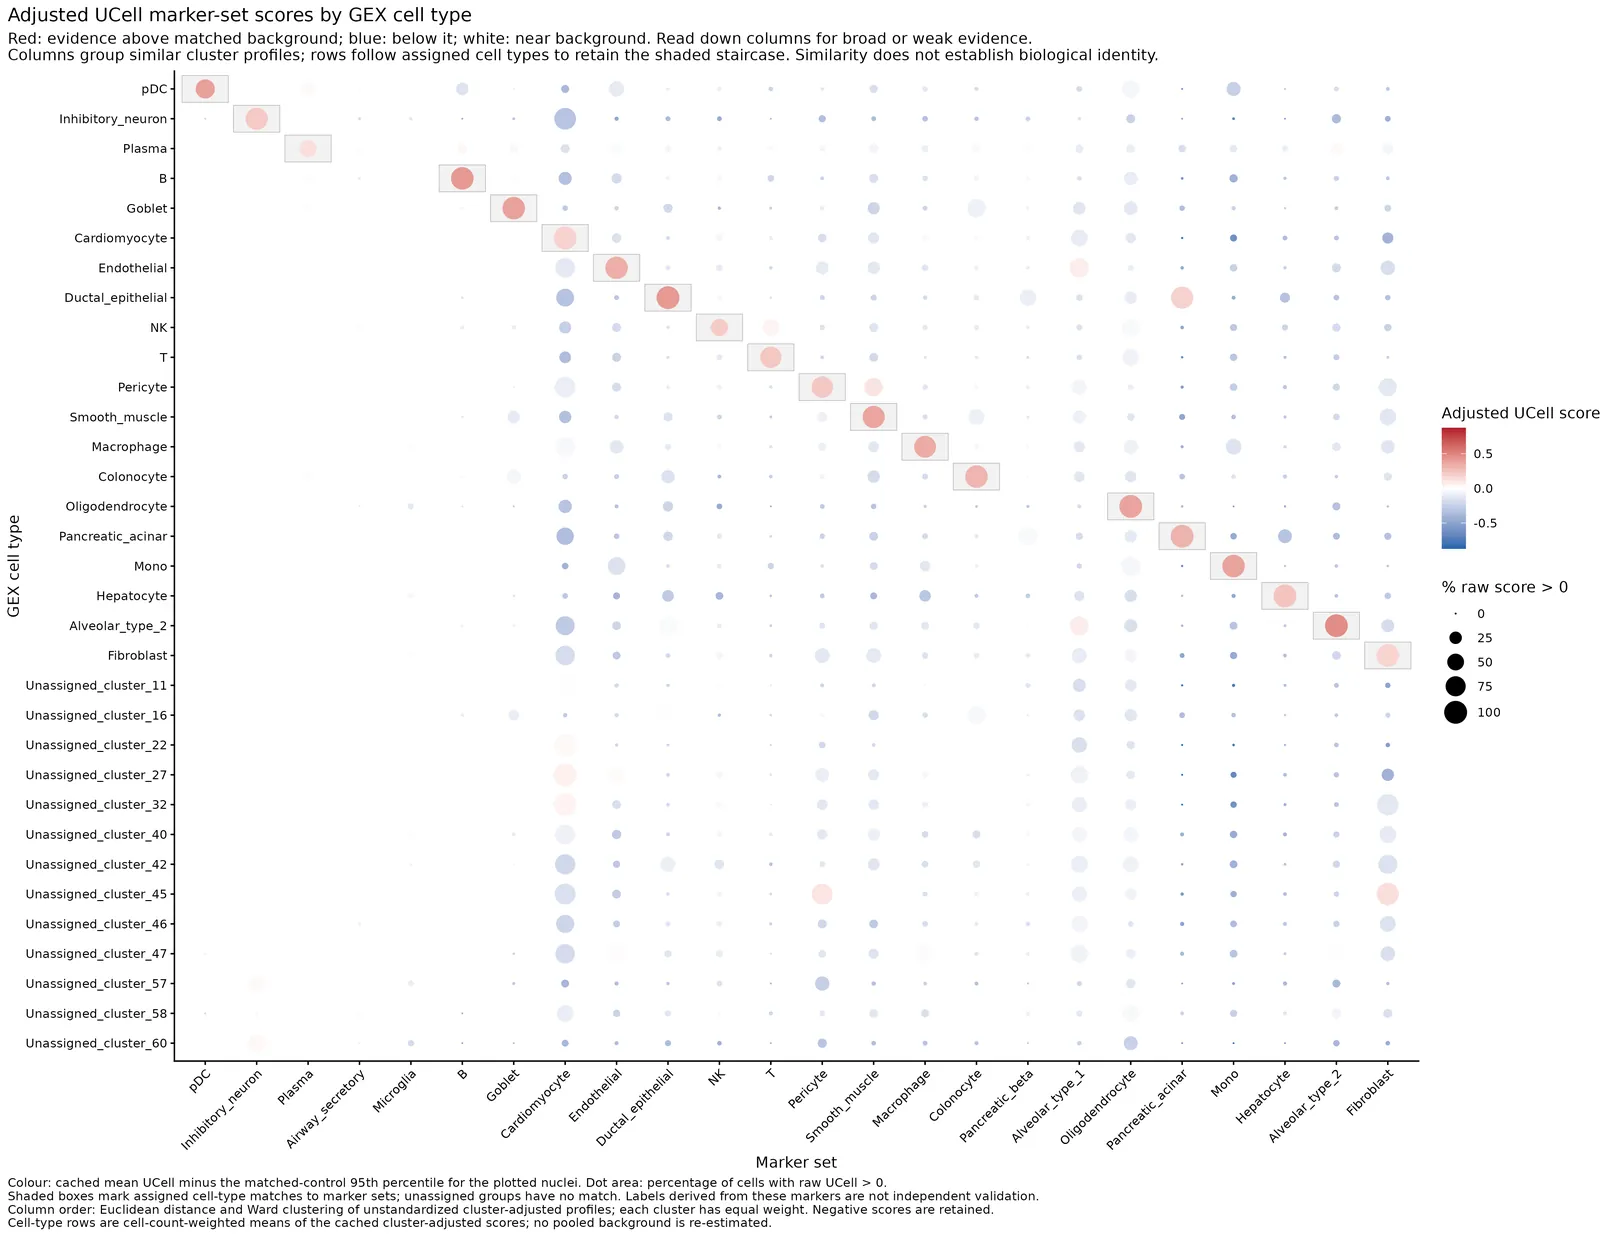
Pre-doublet-filtering adjusted UCell evidence averaged per GEX cell type, with distance-ordered marker sets. module_scores_by_cell_type_dot_plot.3_GEX_QC
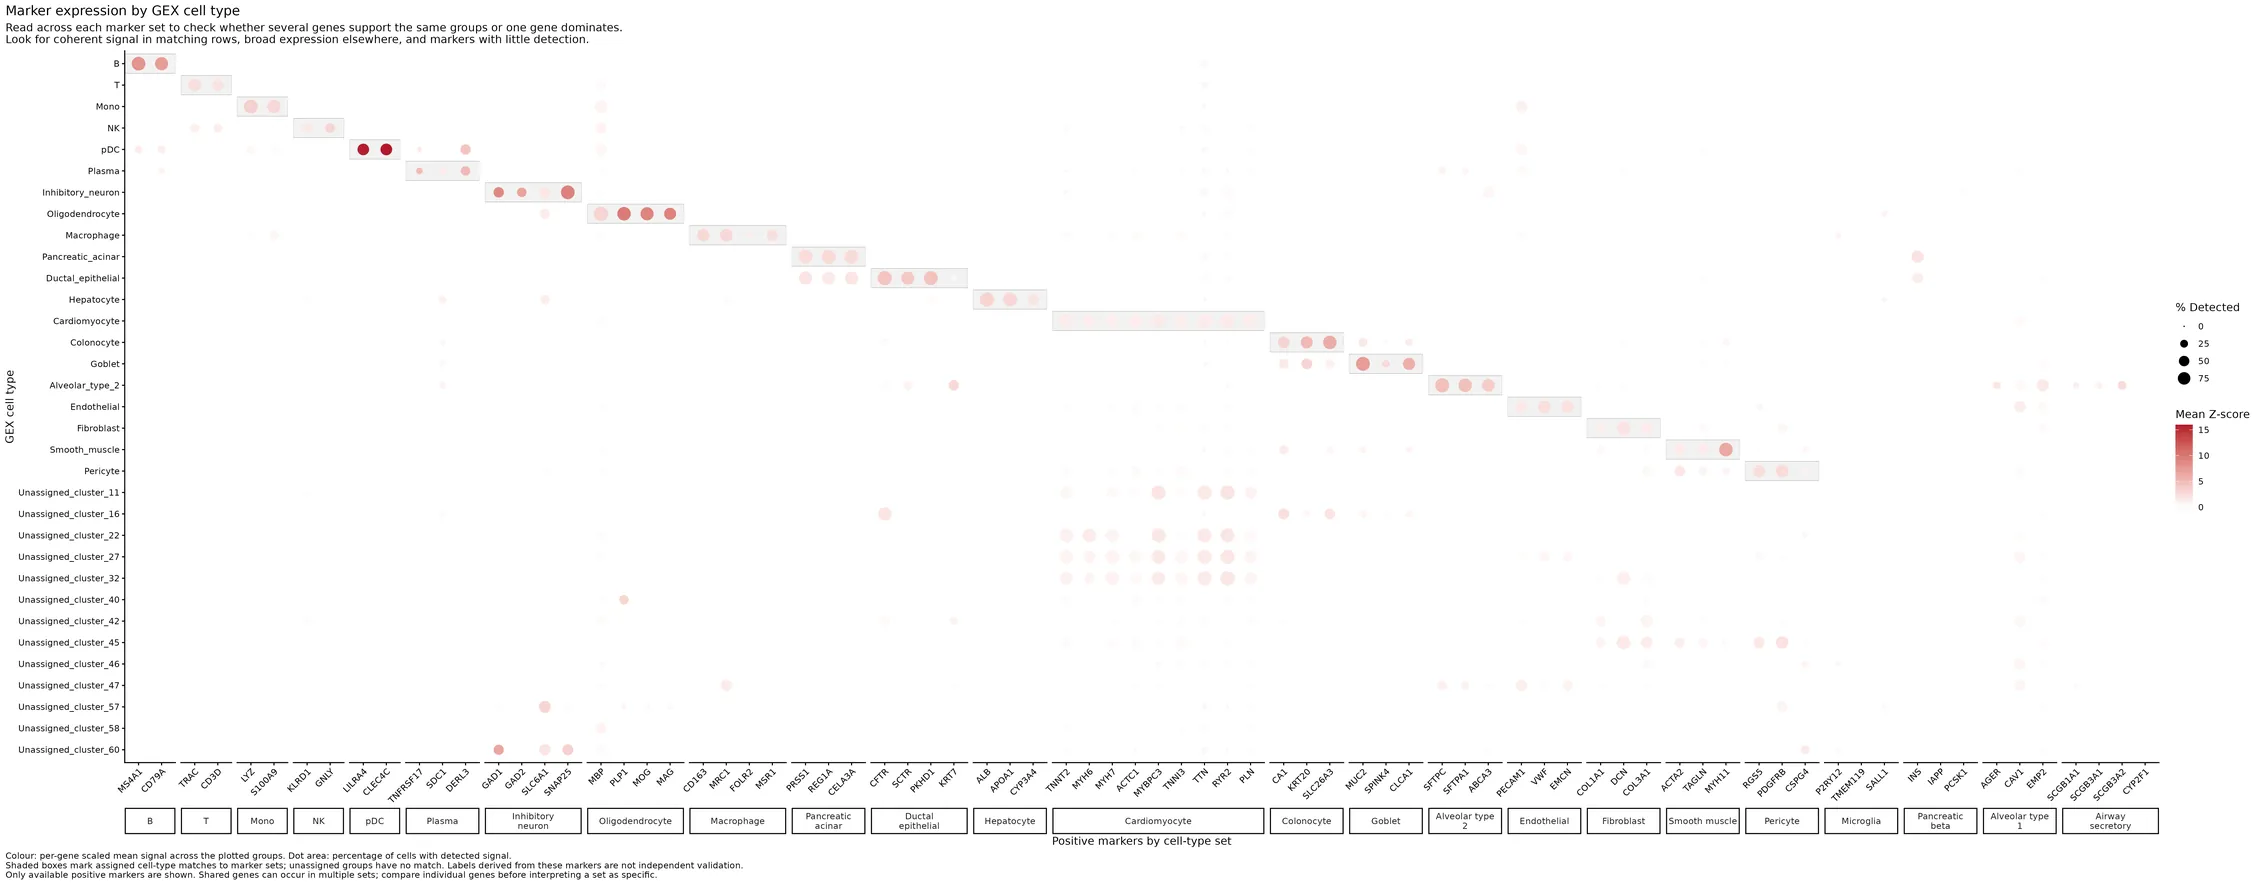
Pre-doublet-filtering marker expression per assigned GEX cell type. markers_by_cell_type_dot_plot.3_GEX_QC
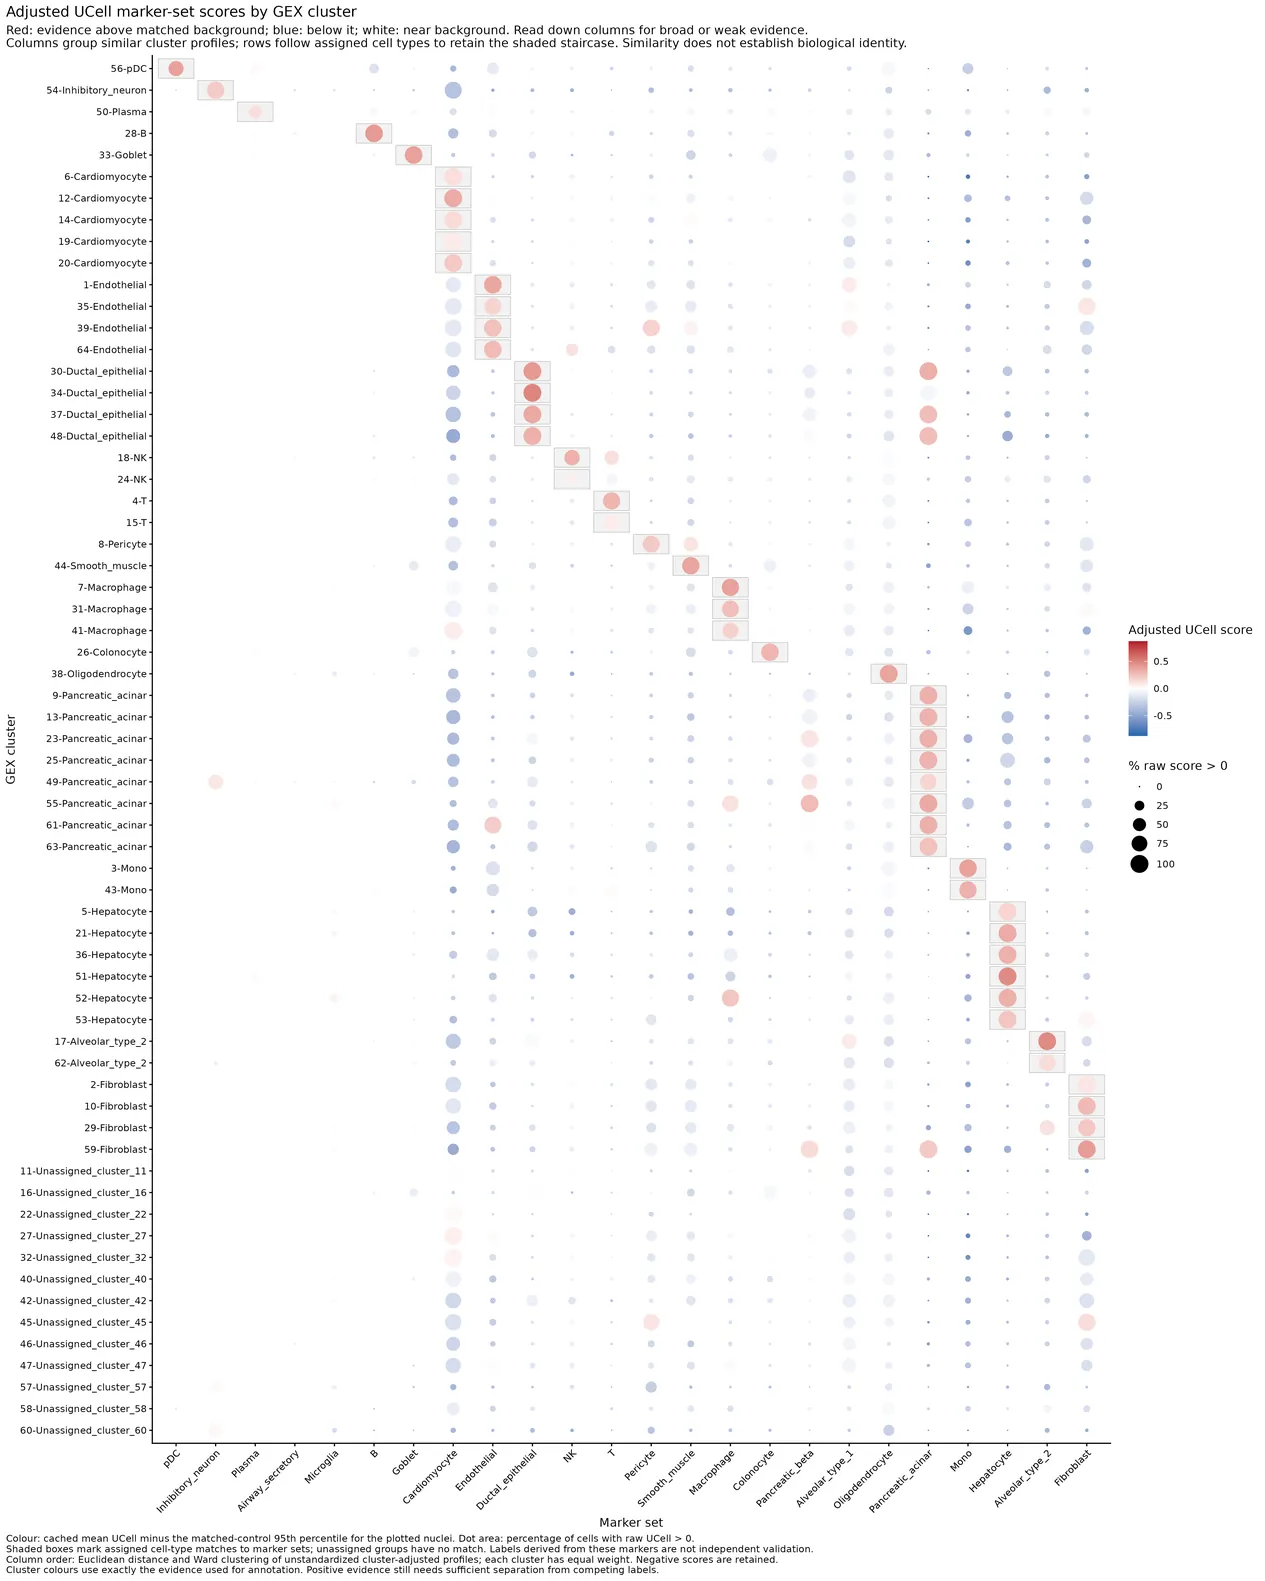
Cached pre-doublet-filtering cluster-adjusted UCell evidence with distance-ordered marker sets and matching row order. module_scores_by_cluster_dot_plot.3_GEX_QC
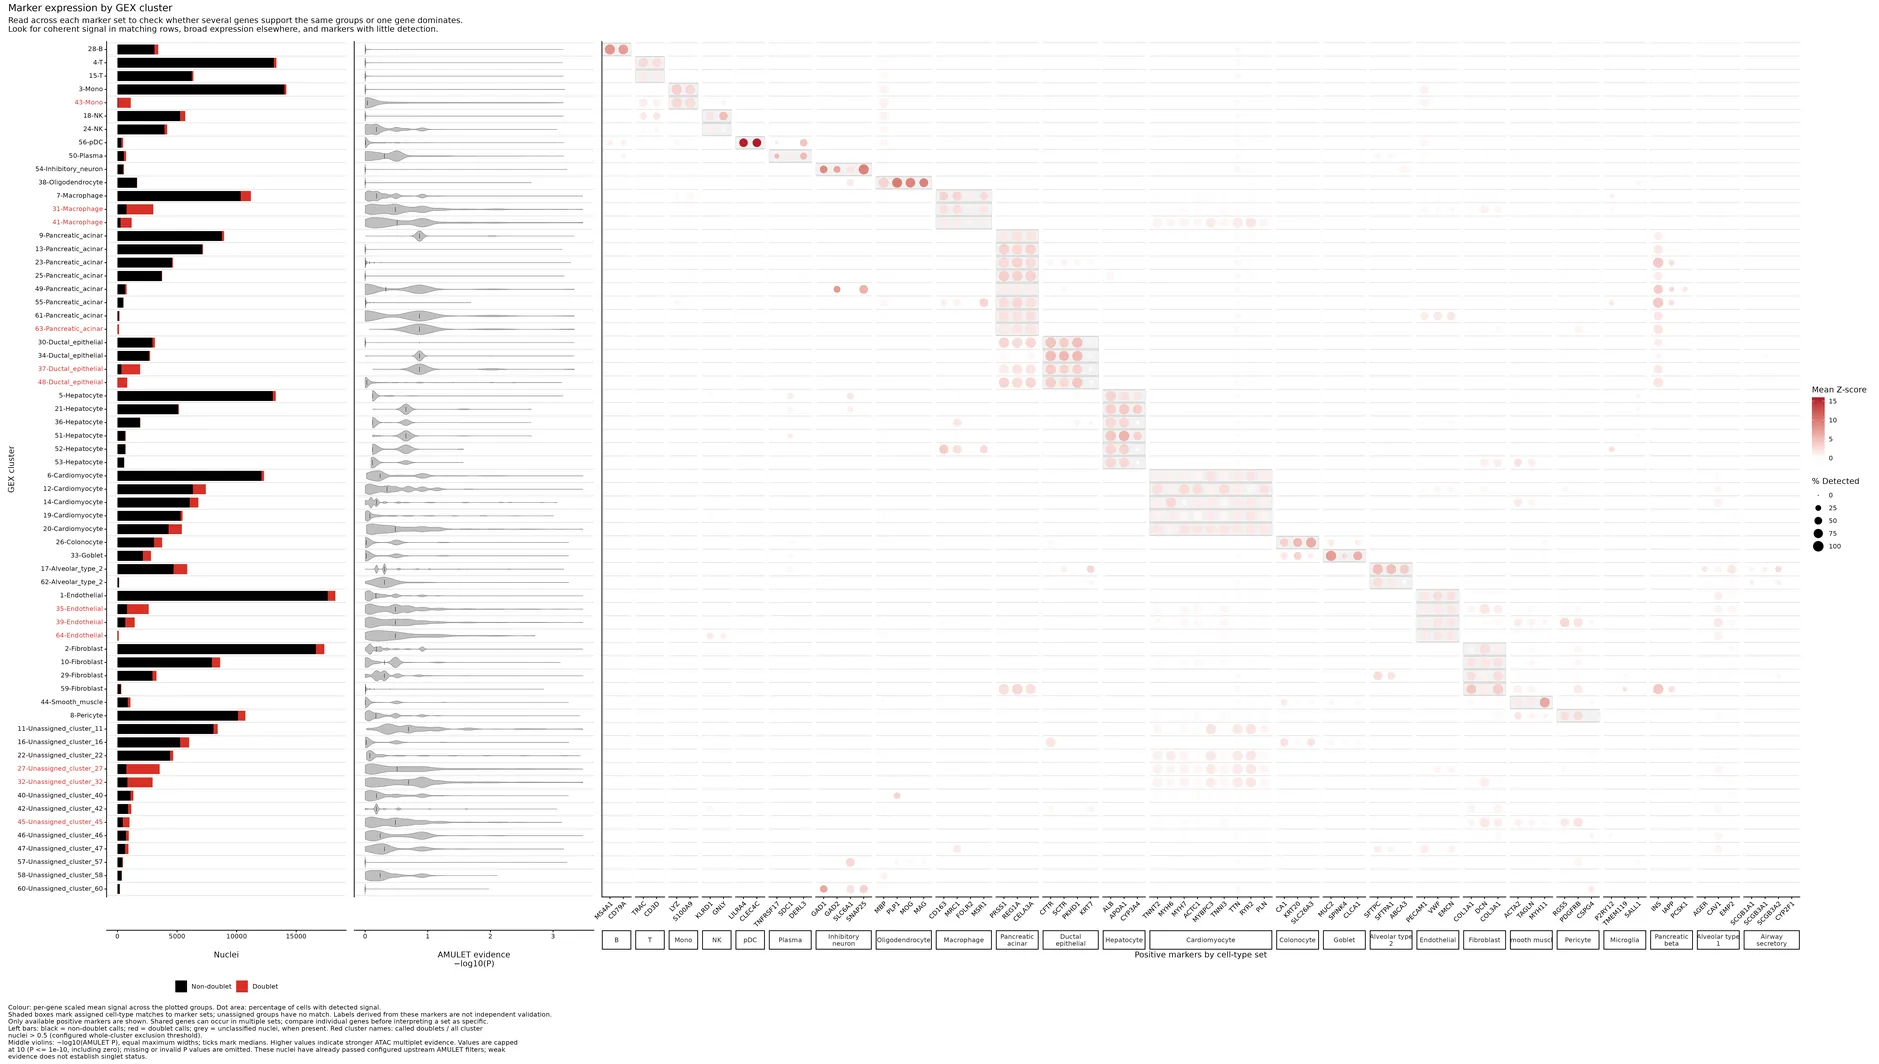
Pre-doublet-filtering marker expression per named GEX cluster. markers_by_cluster_dot_plot.3_GEX_QC
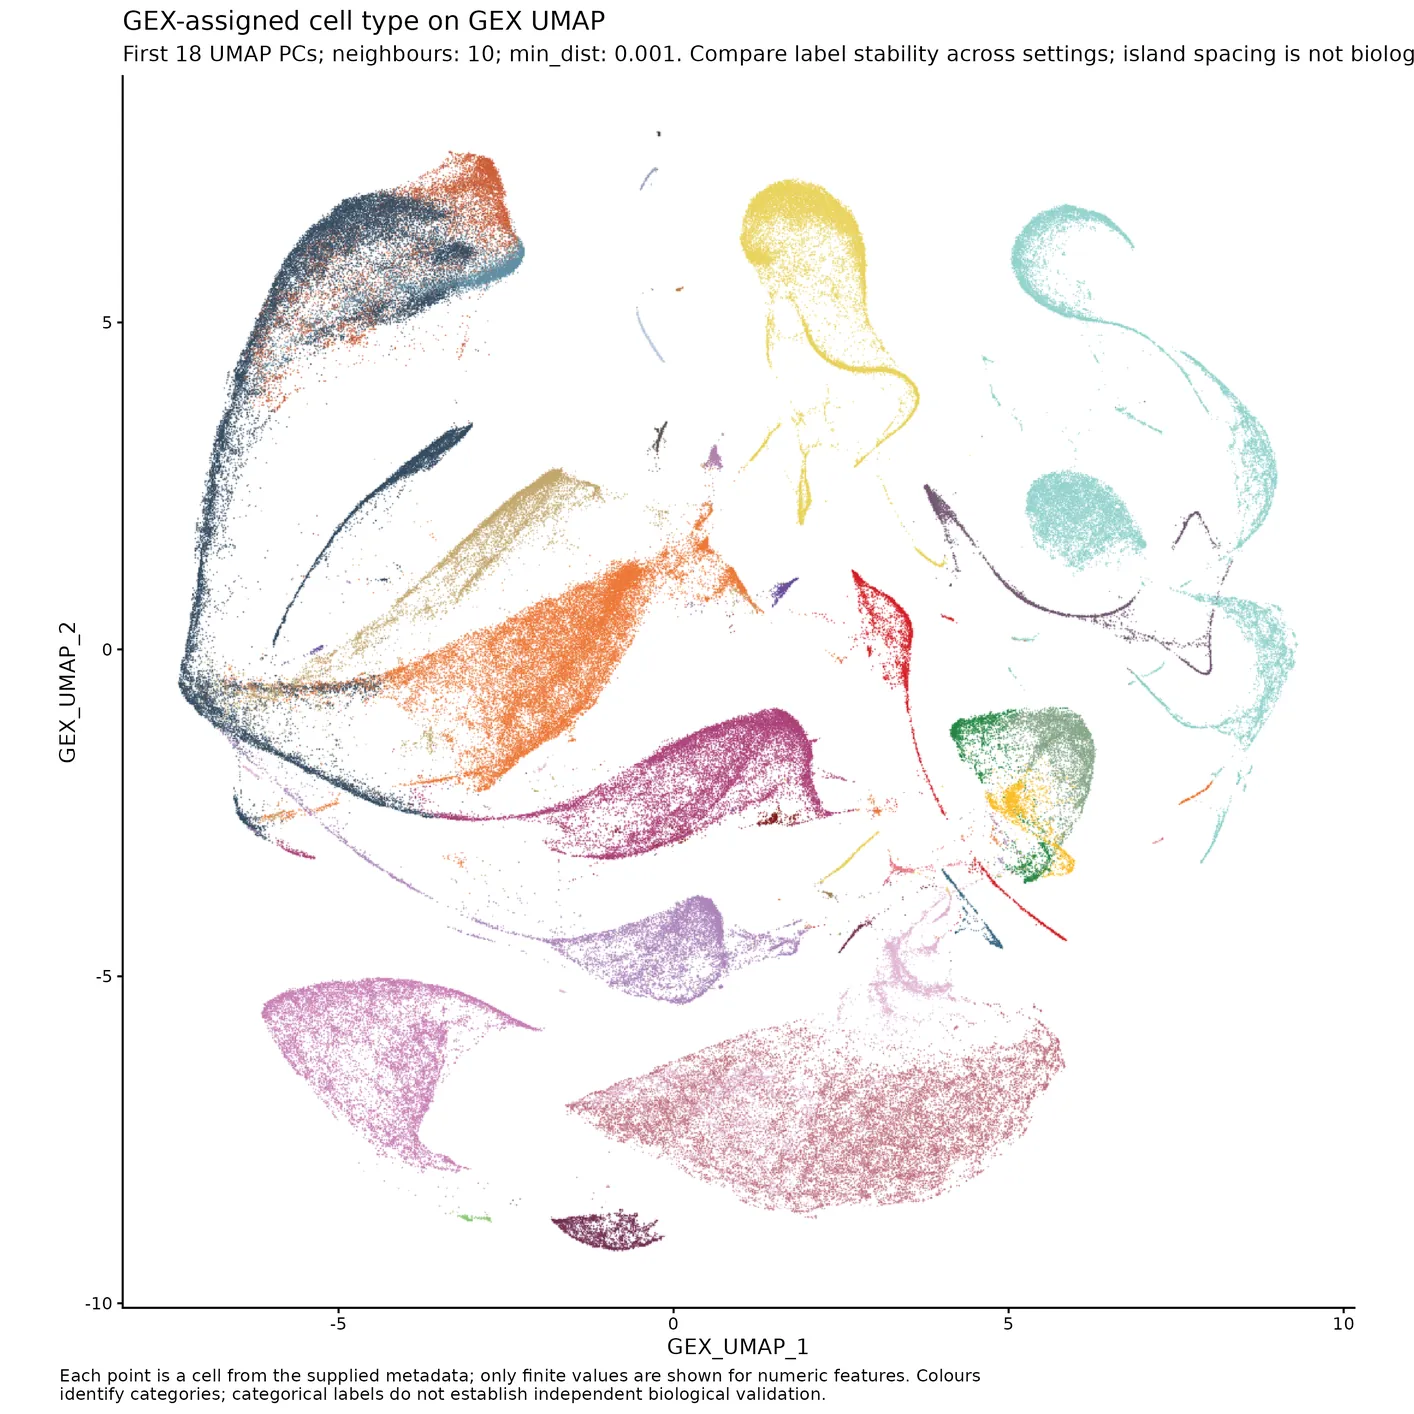
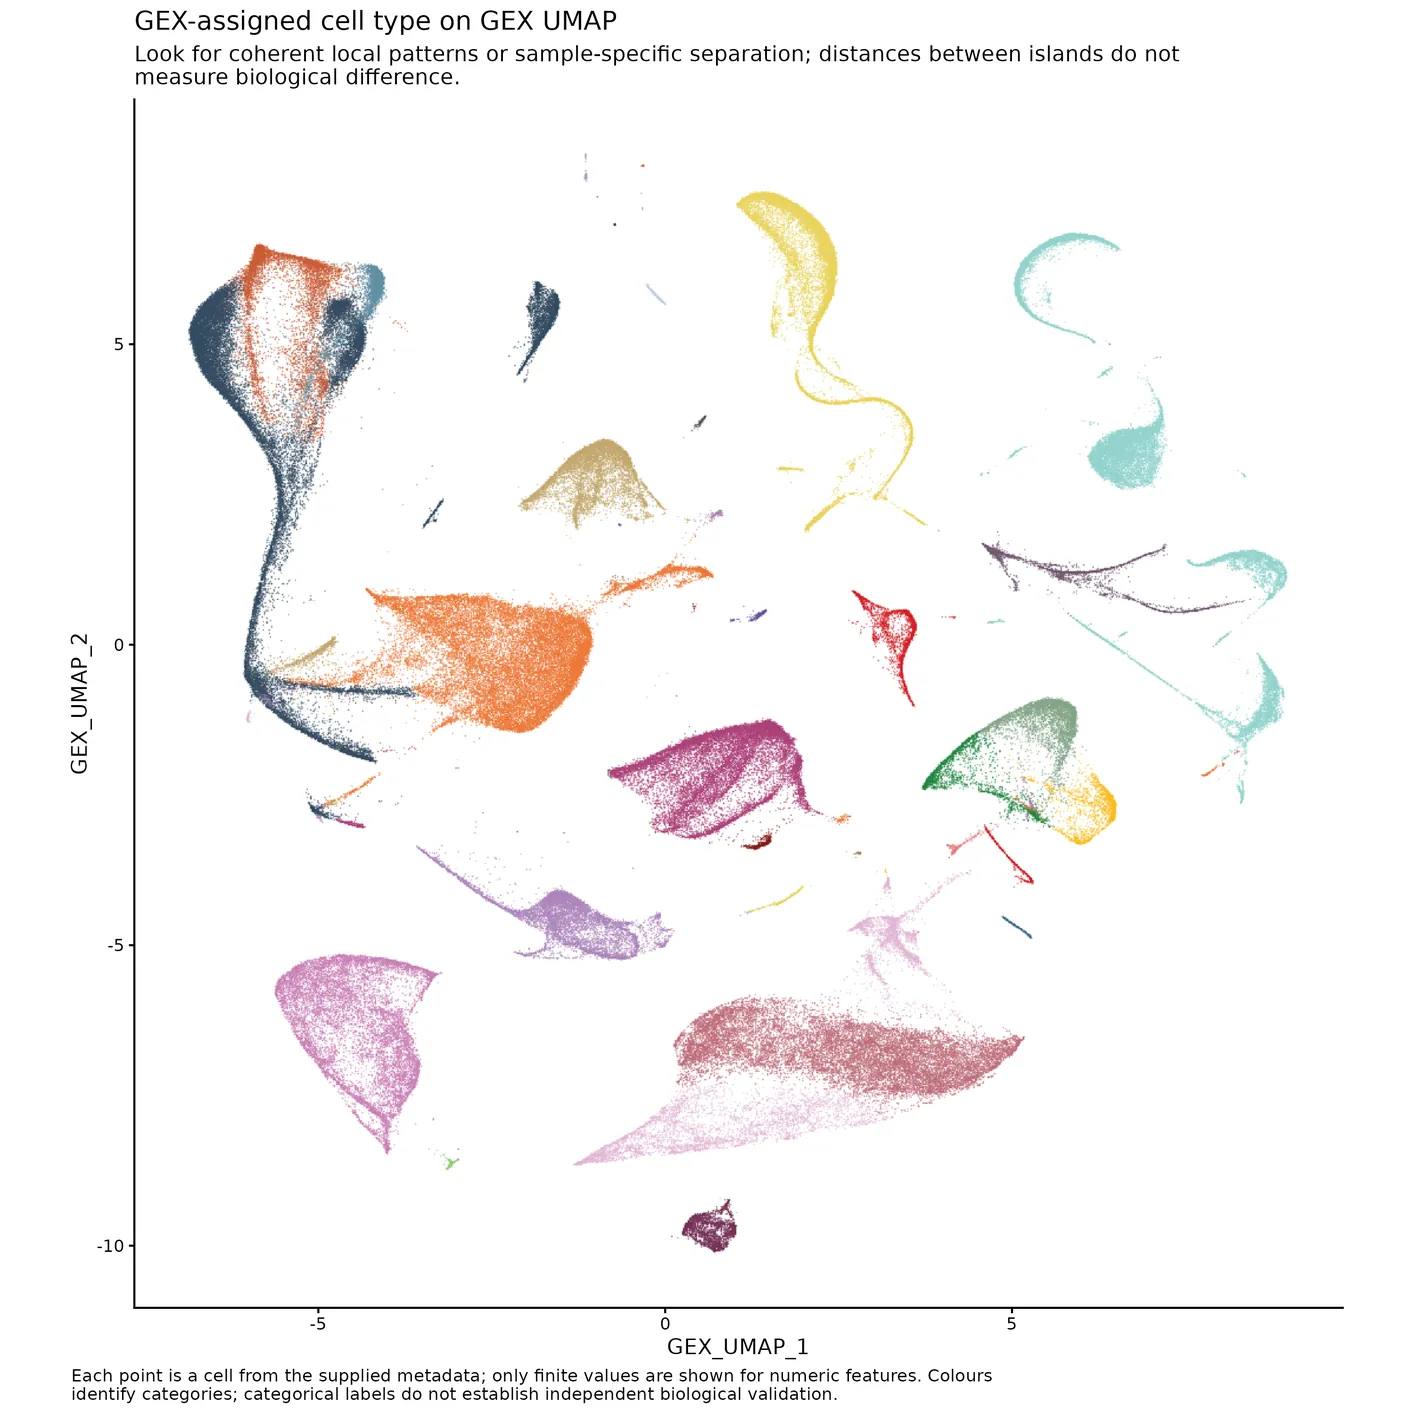
Plot GEX cell types on UMAPs across a sweep of PC counts and neighbor counts. cross.UMAPs.3_GEX_QC
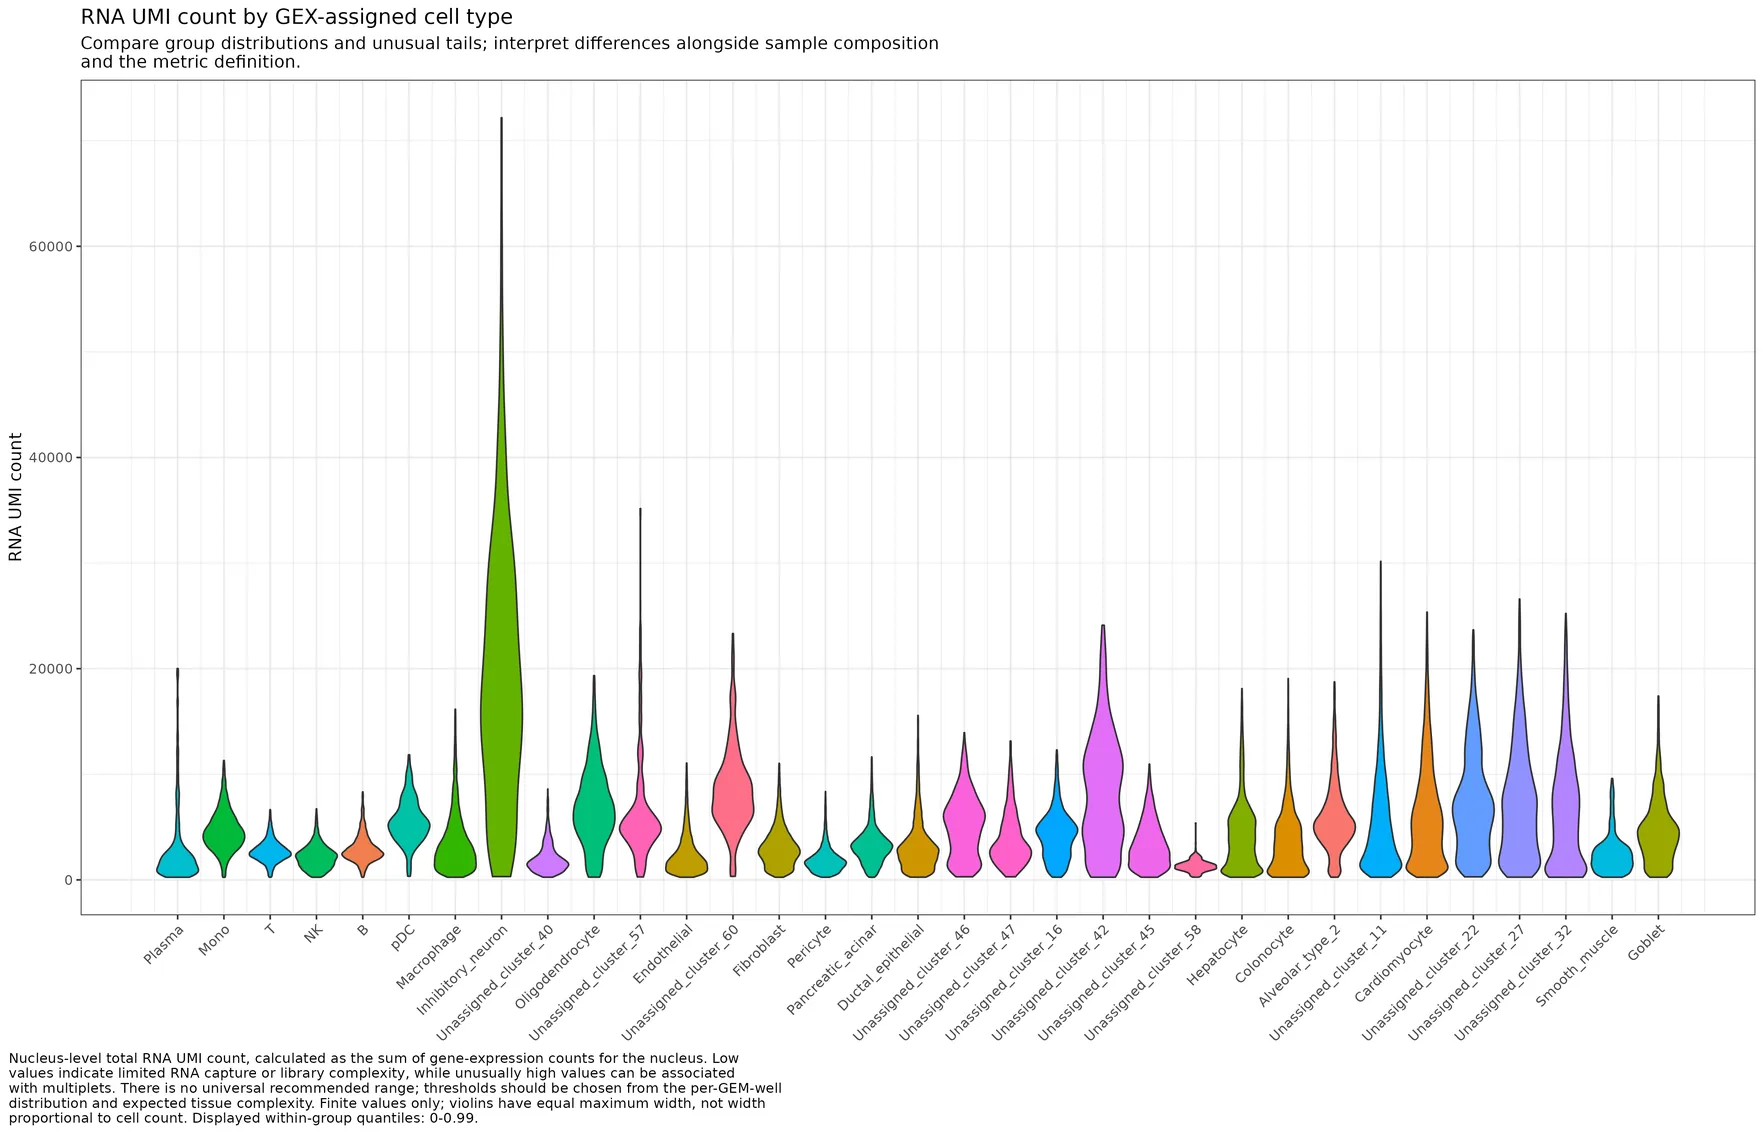
Violin plots of continuous QC and cell-cycle features per cell type before doublet filtering. continuous_by_cell_type_violin_plot.3_GEX_QC
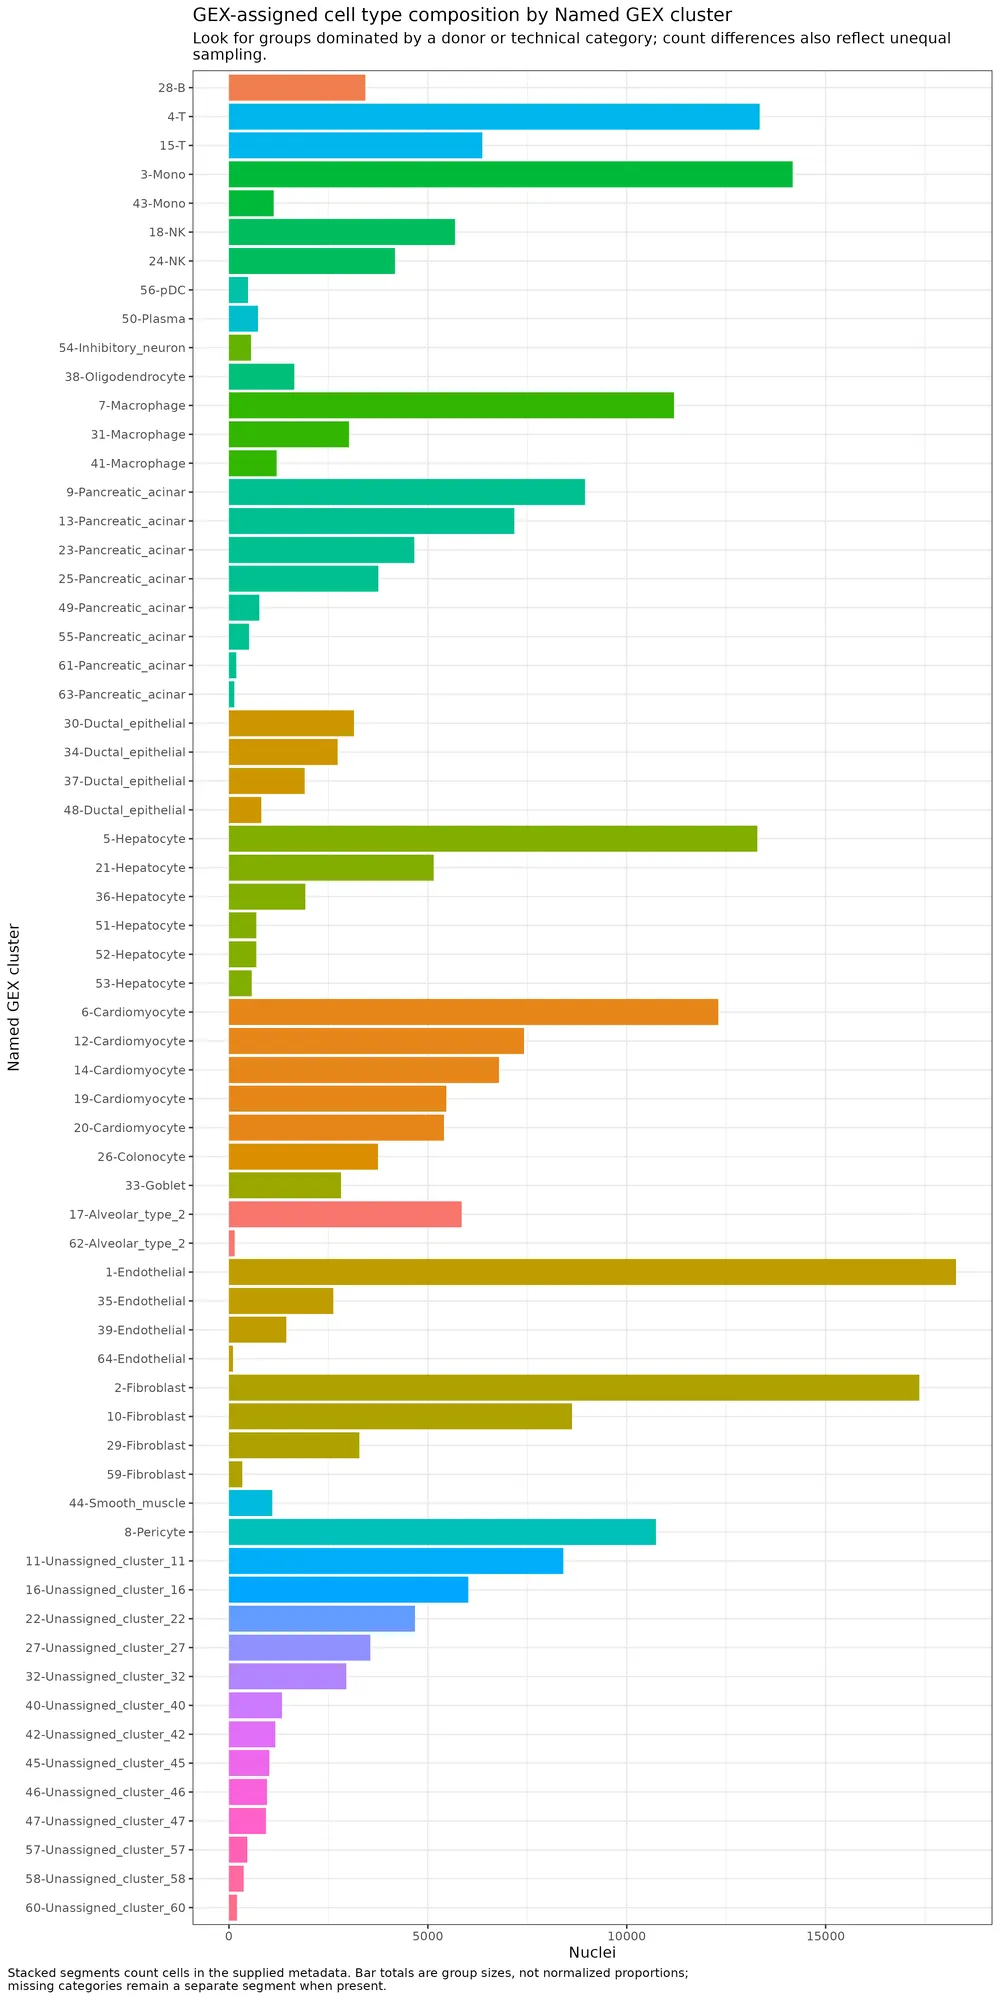
Bar plots of categorical metadata composition per SNN cluster before doublet filtering. categorical_by_cluster_bars_plots.3_GEX_QC
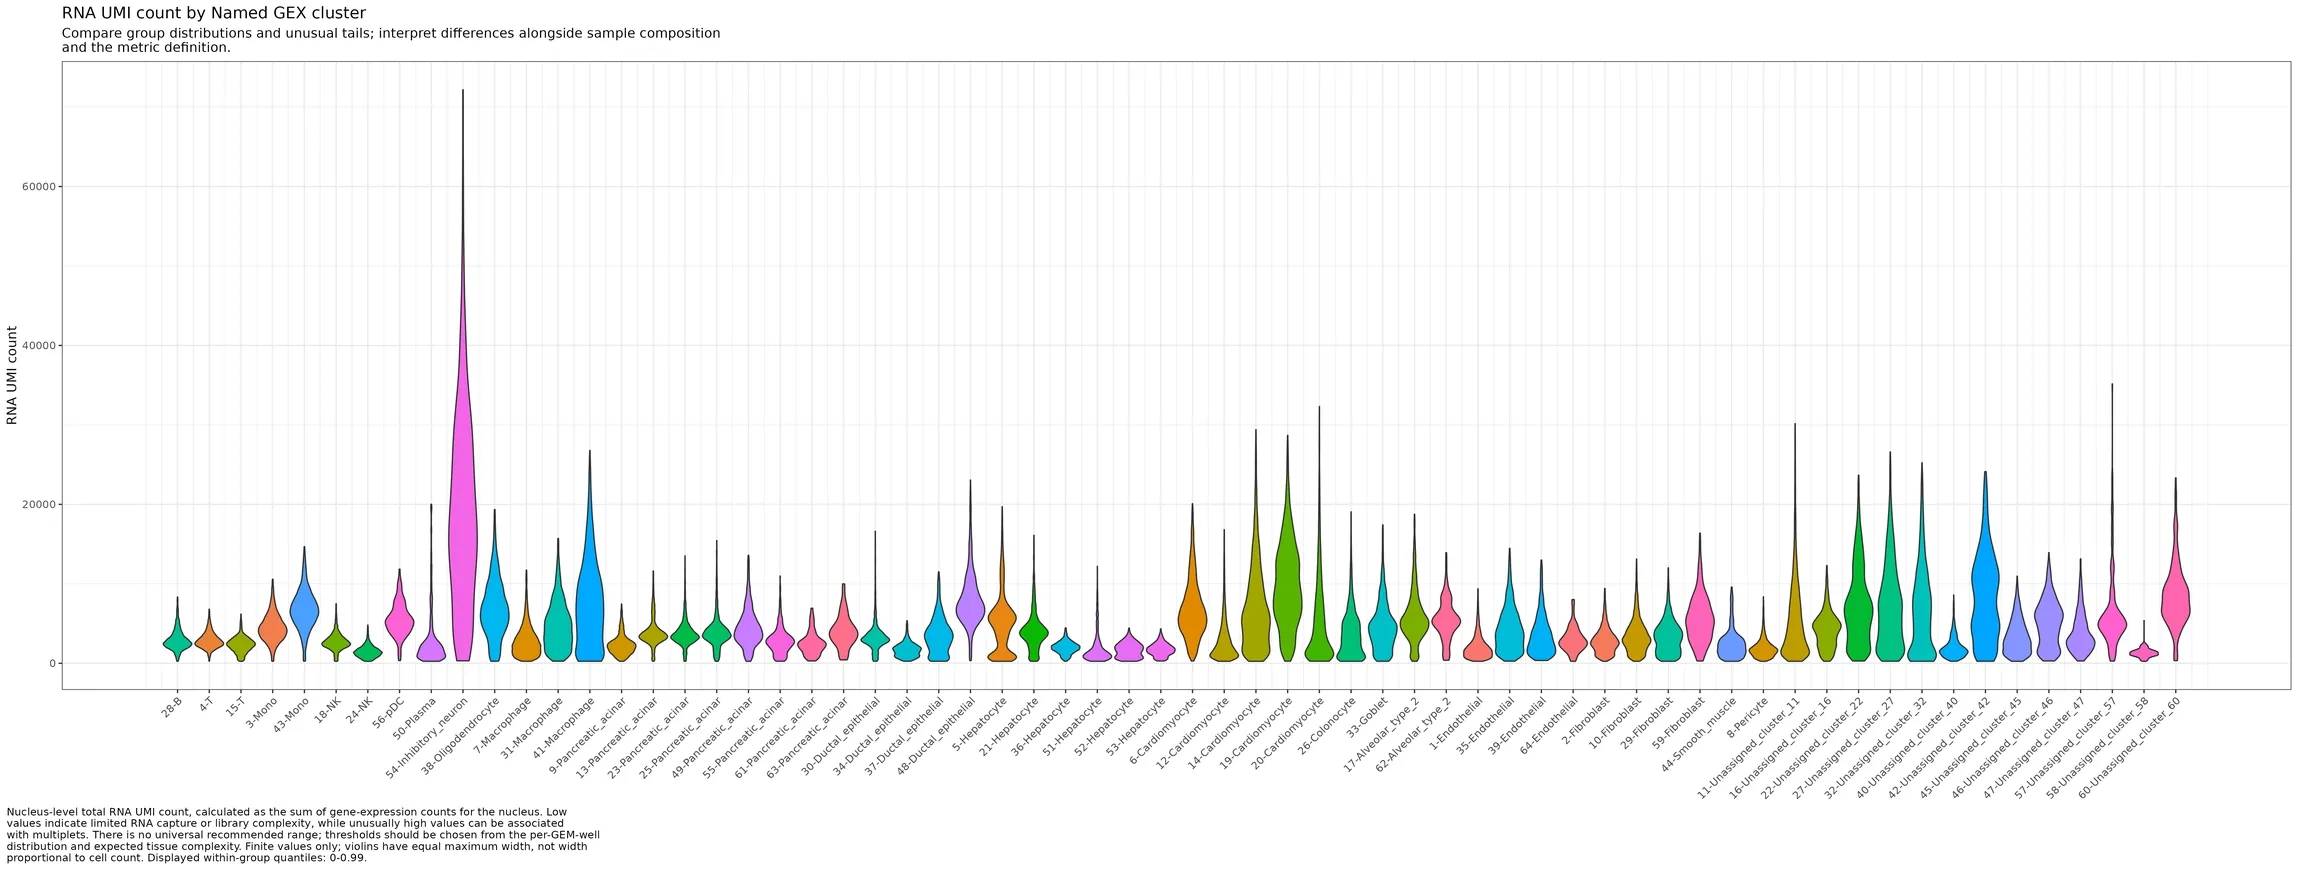
Violin plots of continuous QC and cell-cycle features per SNN cluster before doublet filtering. continuous_by_cluster_violin_plot.3_GEX_QC
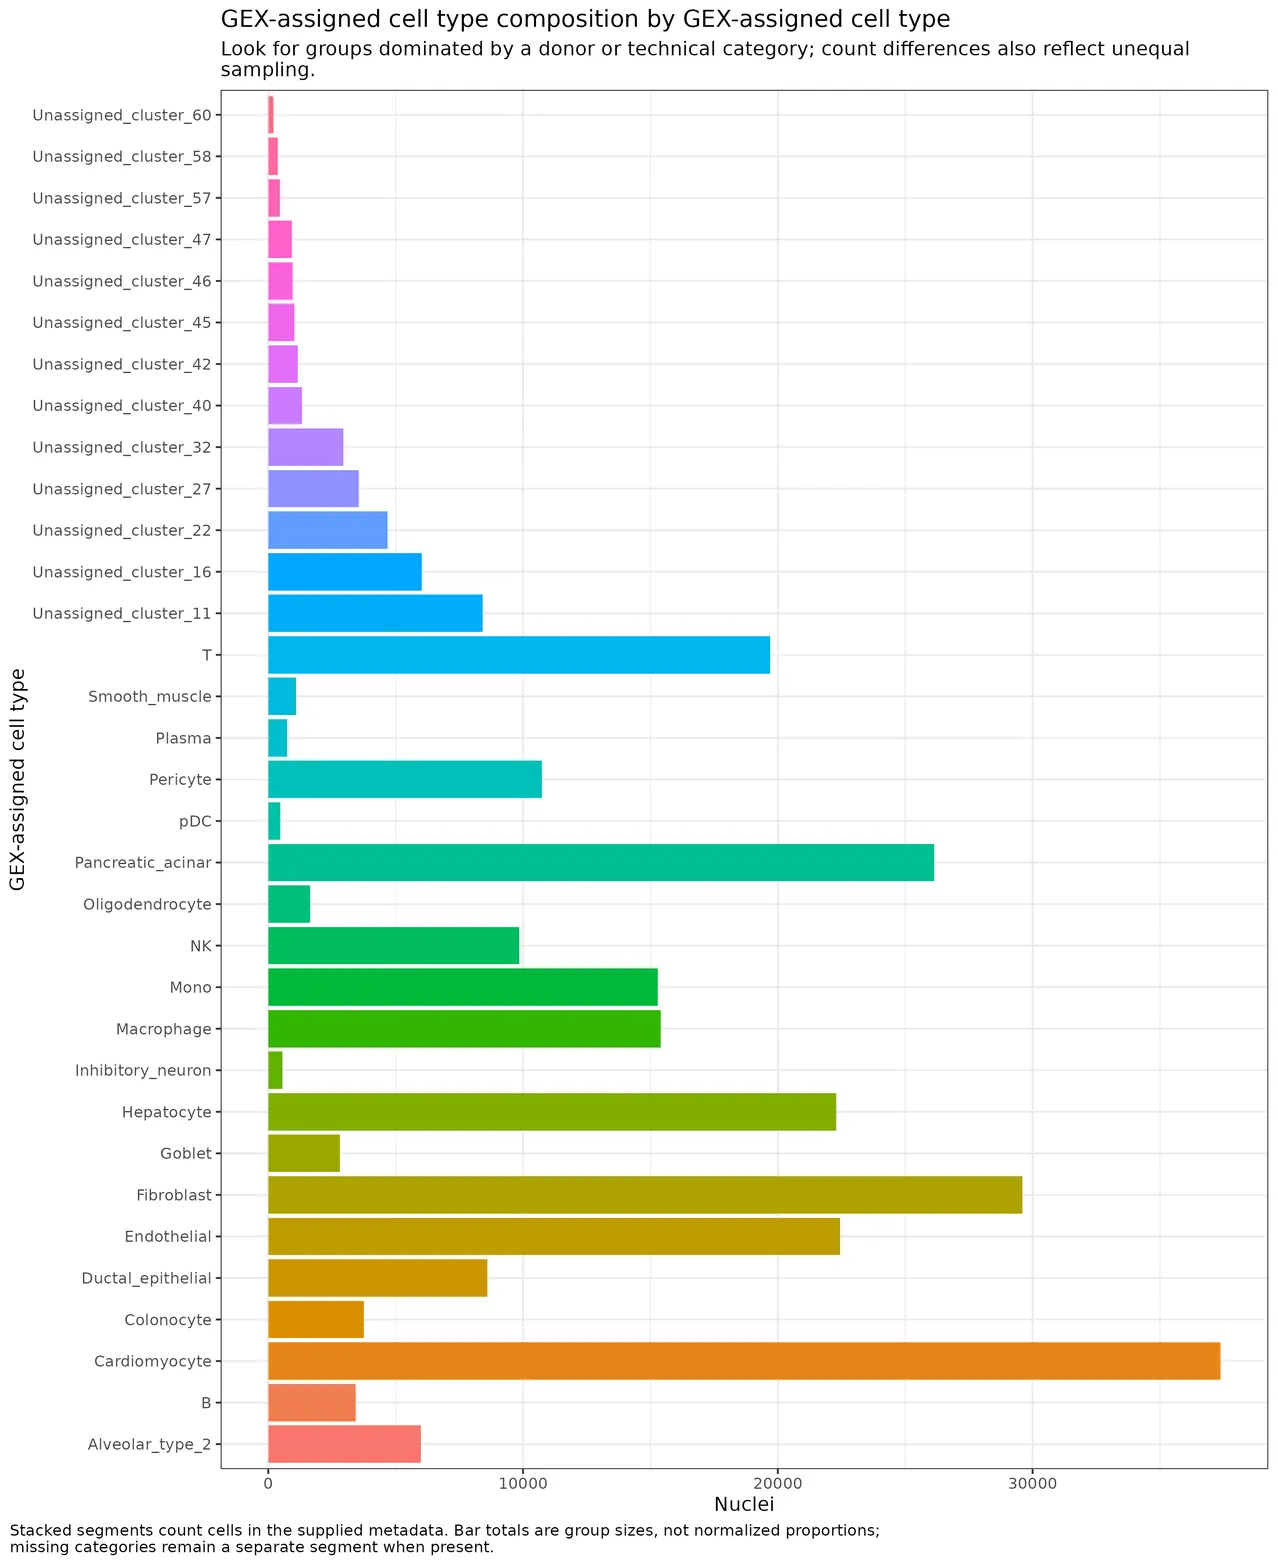
Bar plots of categorical metadata composition per cell type before doublet filtering. categorical_by_cell_type_bars_plots.3_GEX_QC
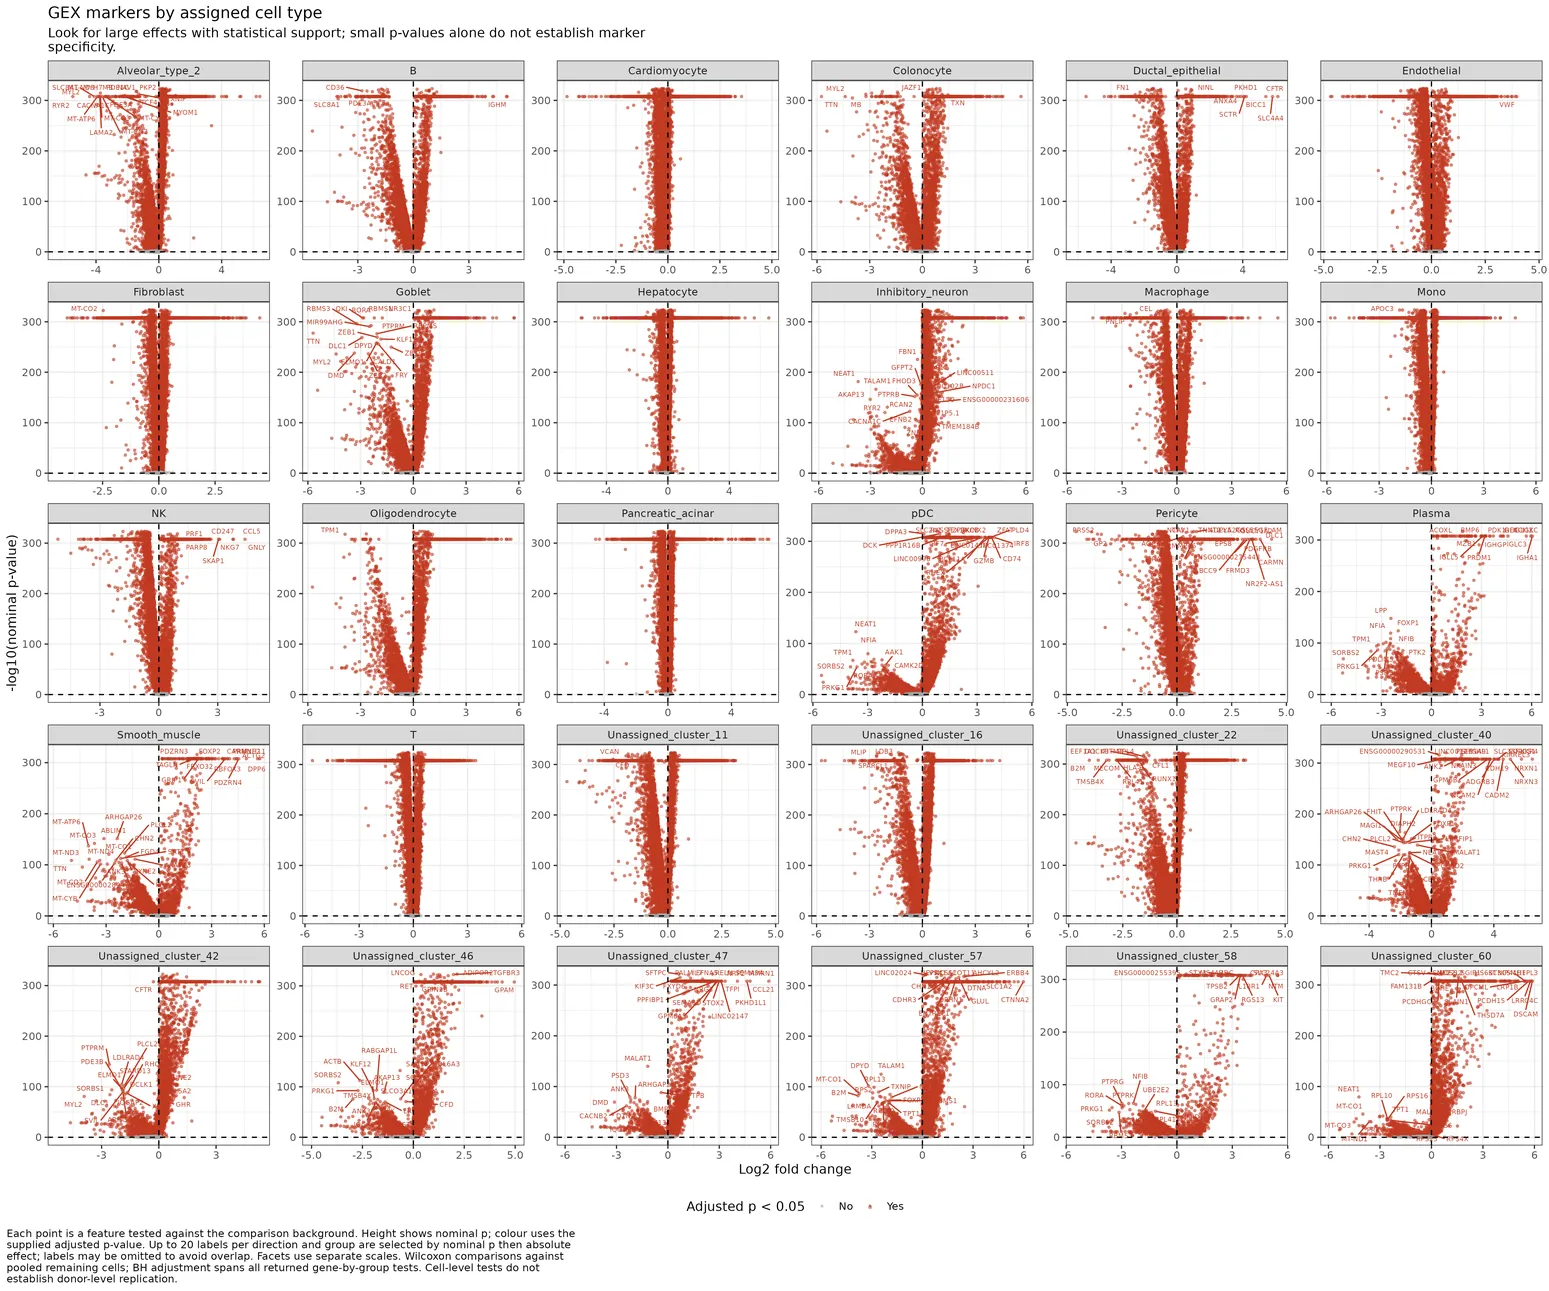
Facetted volcano plot of BPCells marker genes per GEX cell type. cell_type_marker_volcano_plots.3_GEX_QC
UMAPs colored by categorical metadata variables. harmony.categorical.UMAPs.3_GEX_QC
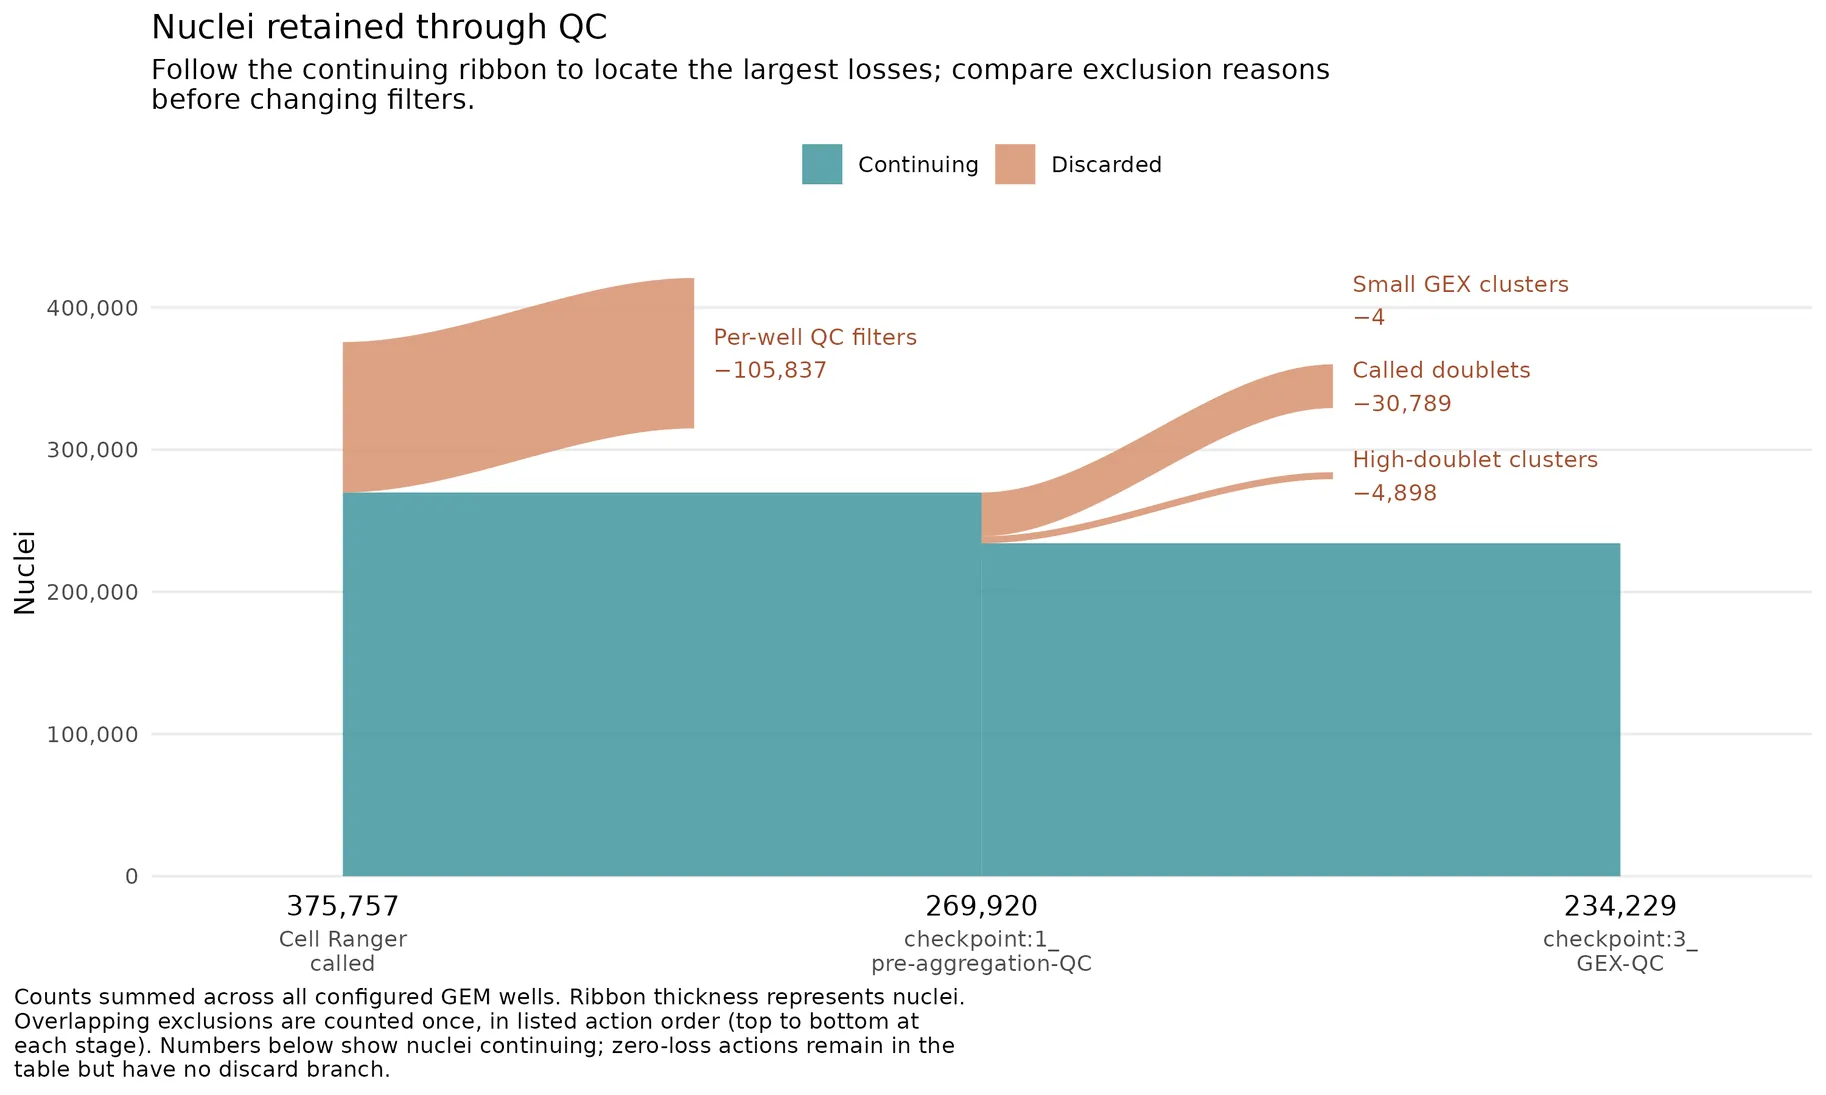
Plot cumulative nuclei retention through GEX QC. cell_retention_flow_plot.3_GEX_QC
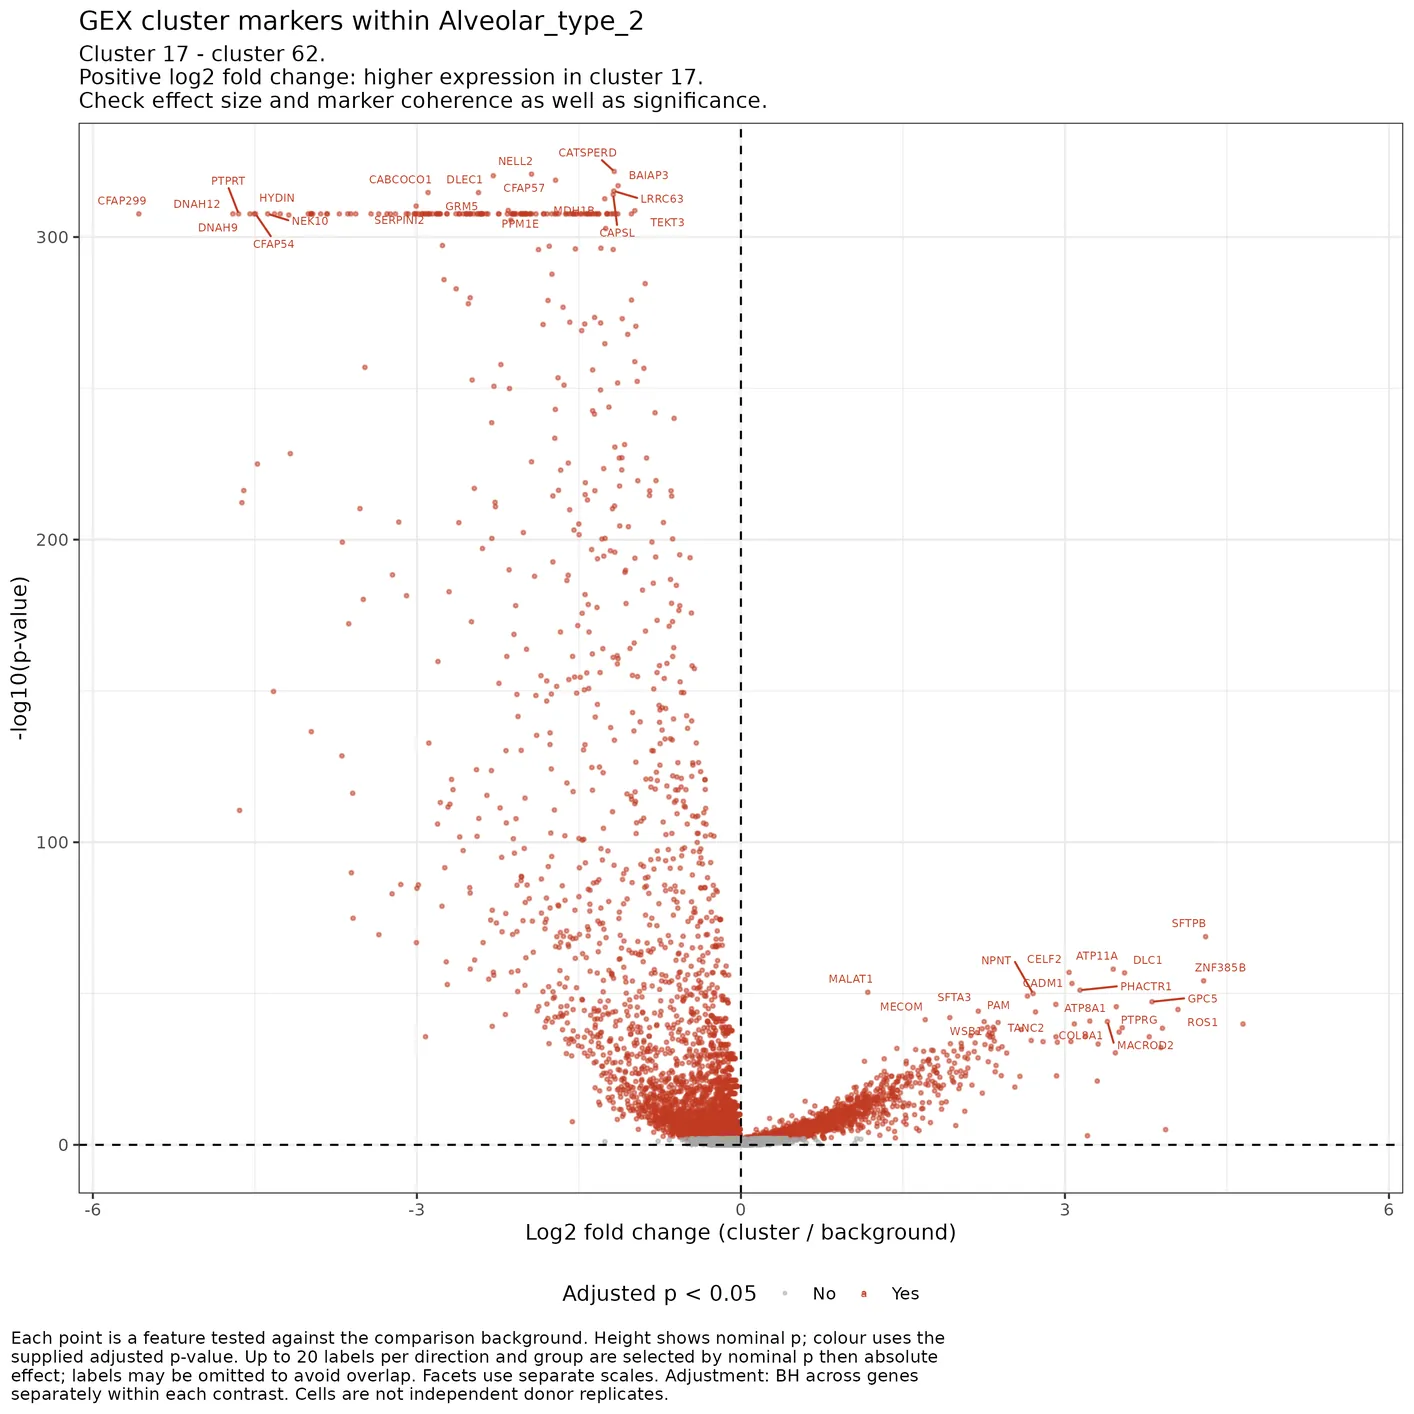
One cluster-marker volcano file per multicluster cell type; two clusters share one directed comparison. cluster_marker_volcano_plots.3_GEX_QC
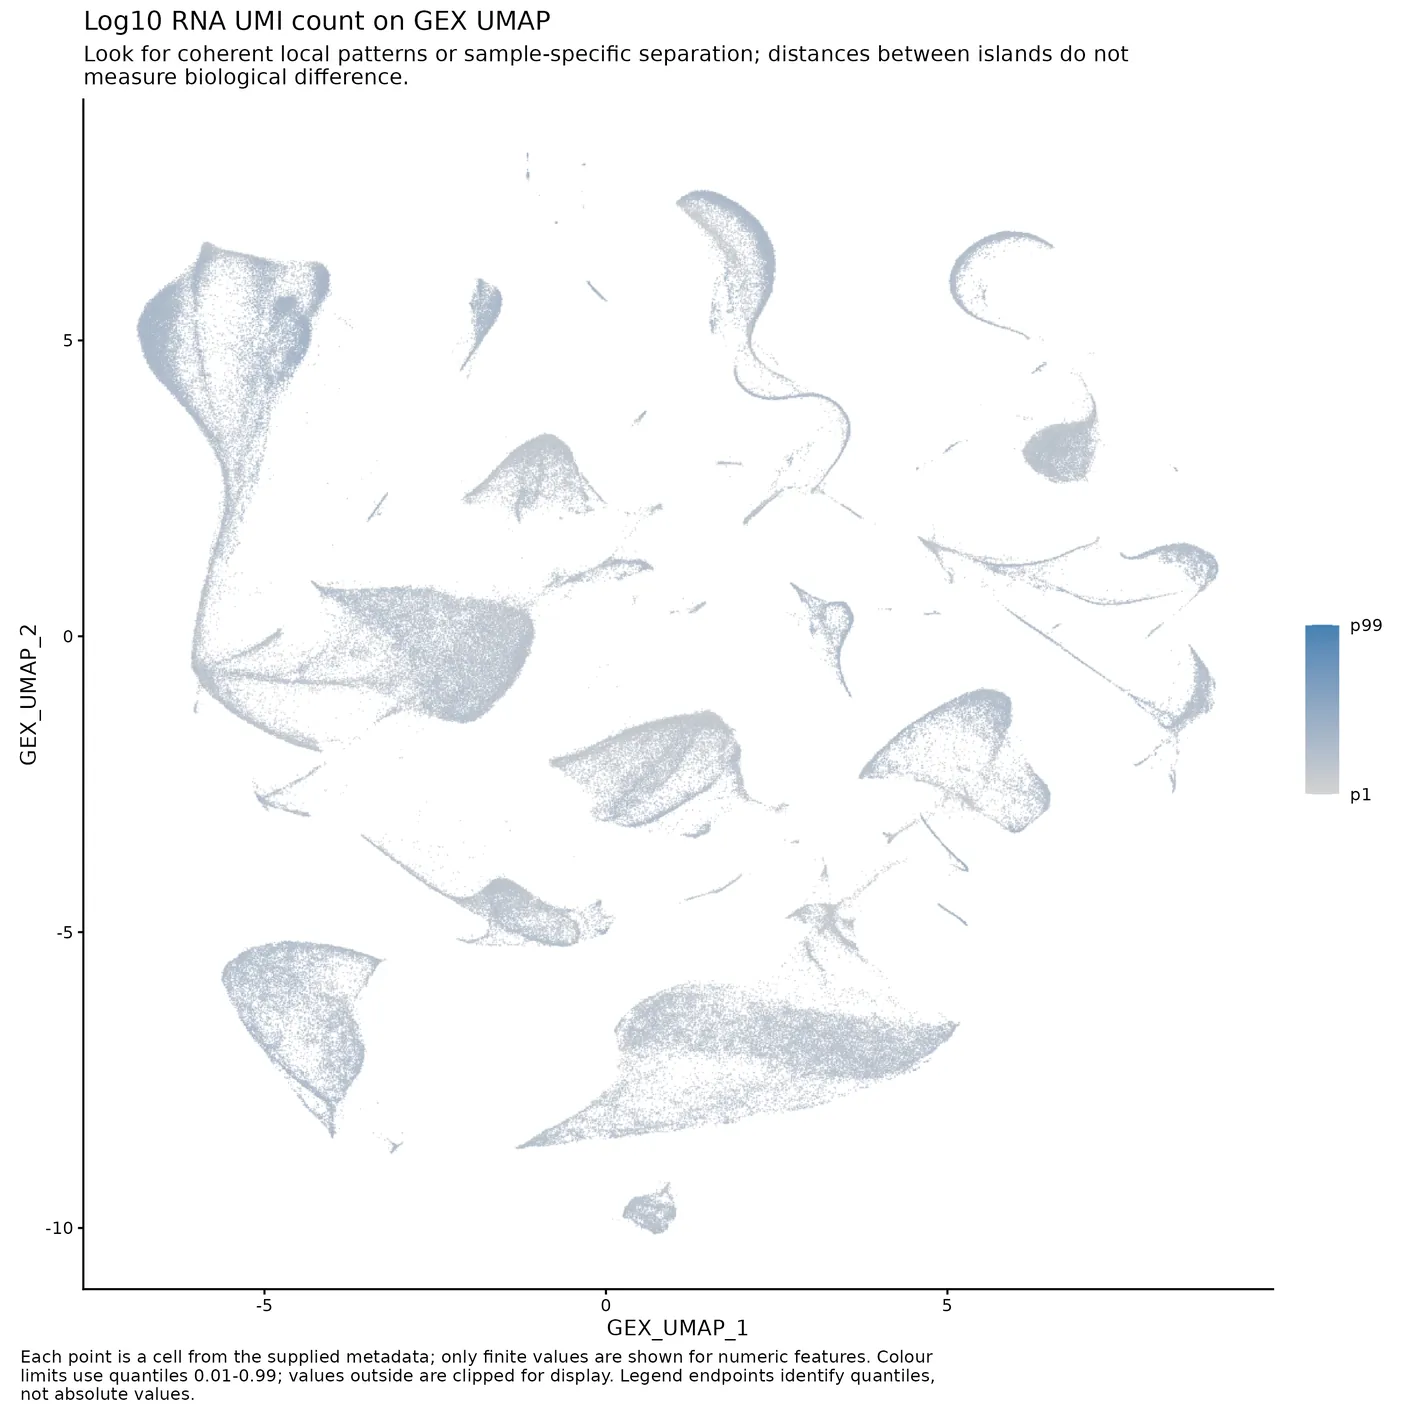
UMAPs colored by continuous QC and gene expression features. harmony.continuous.UMAPs.3_GEX_QC
4. Peak QC
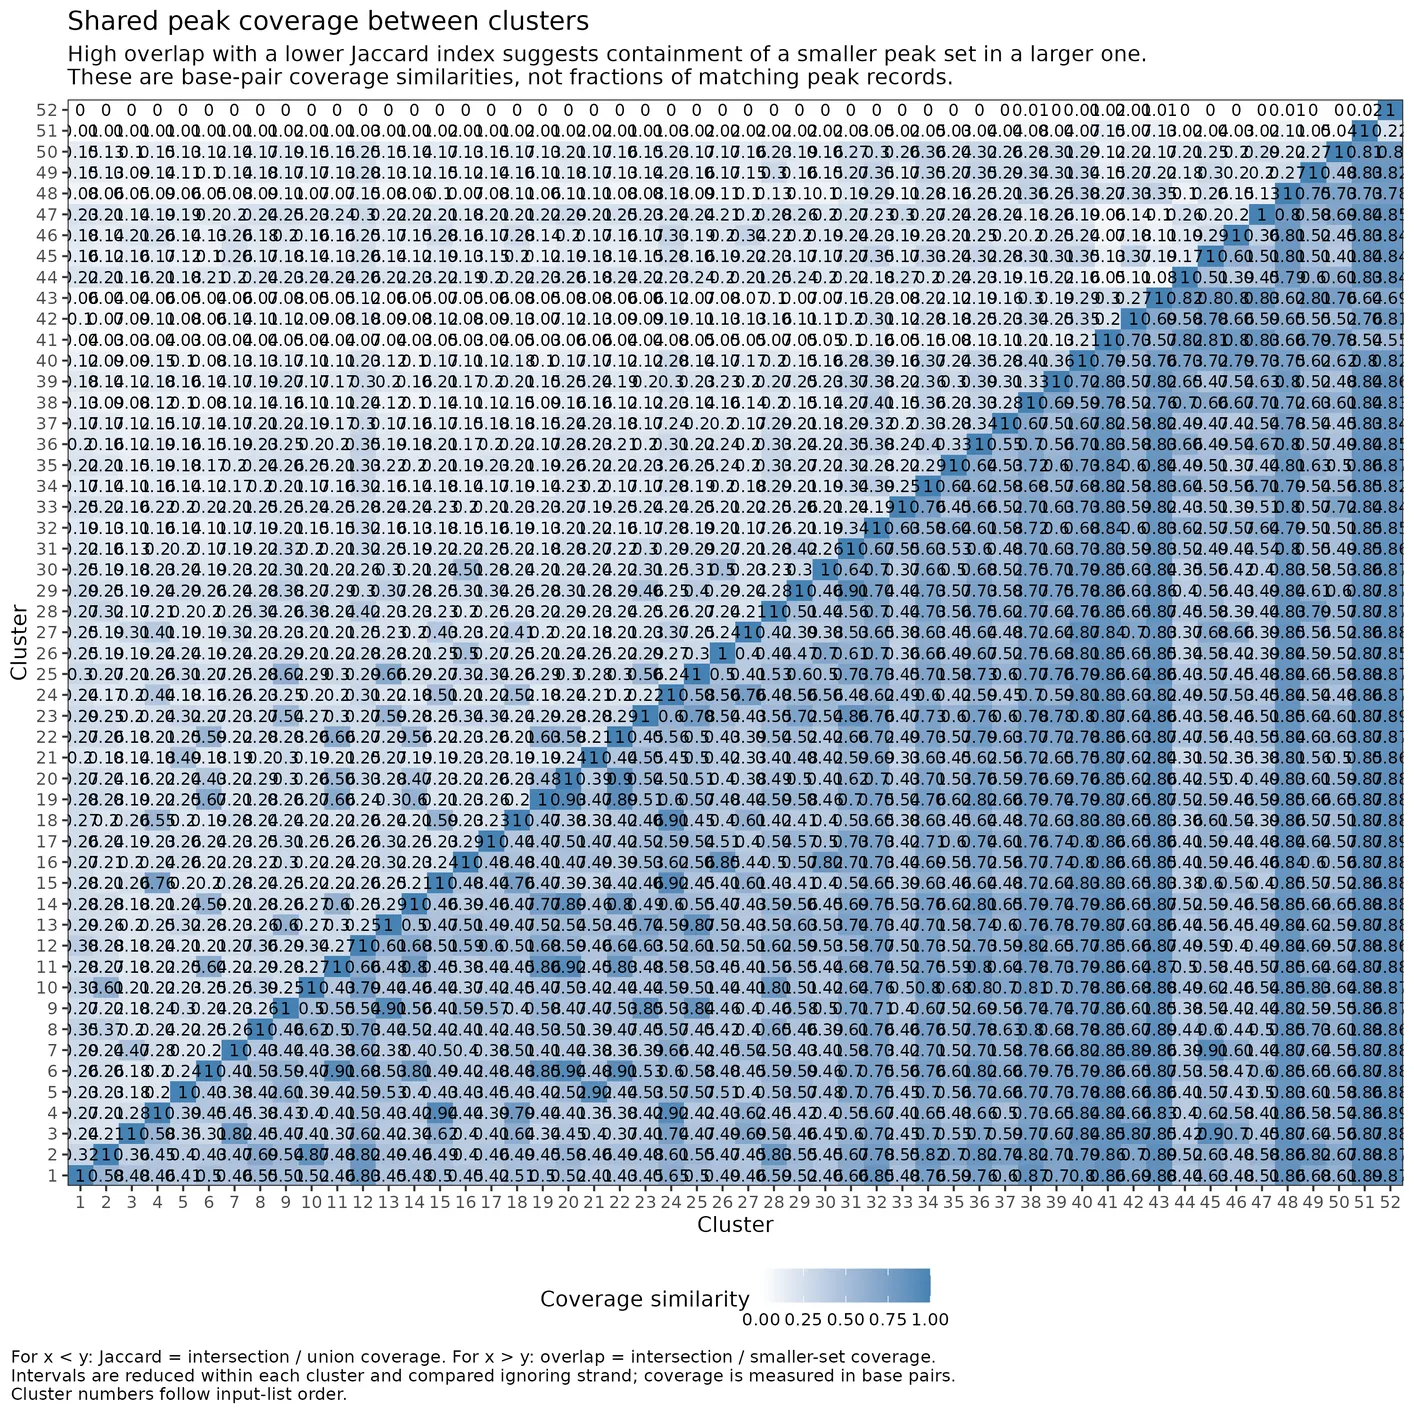
Plot pairwise peak-set similarity matrix across clusters. peaks_similarity_tiles_plot.4_peak_QC
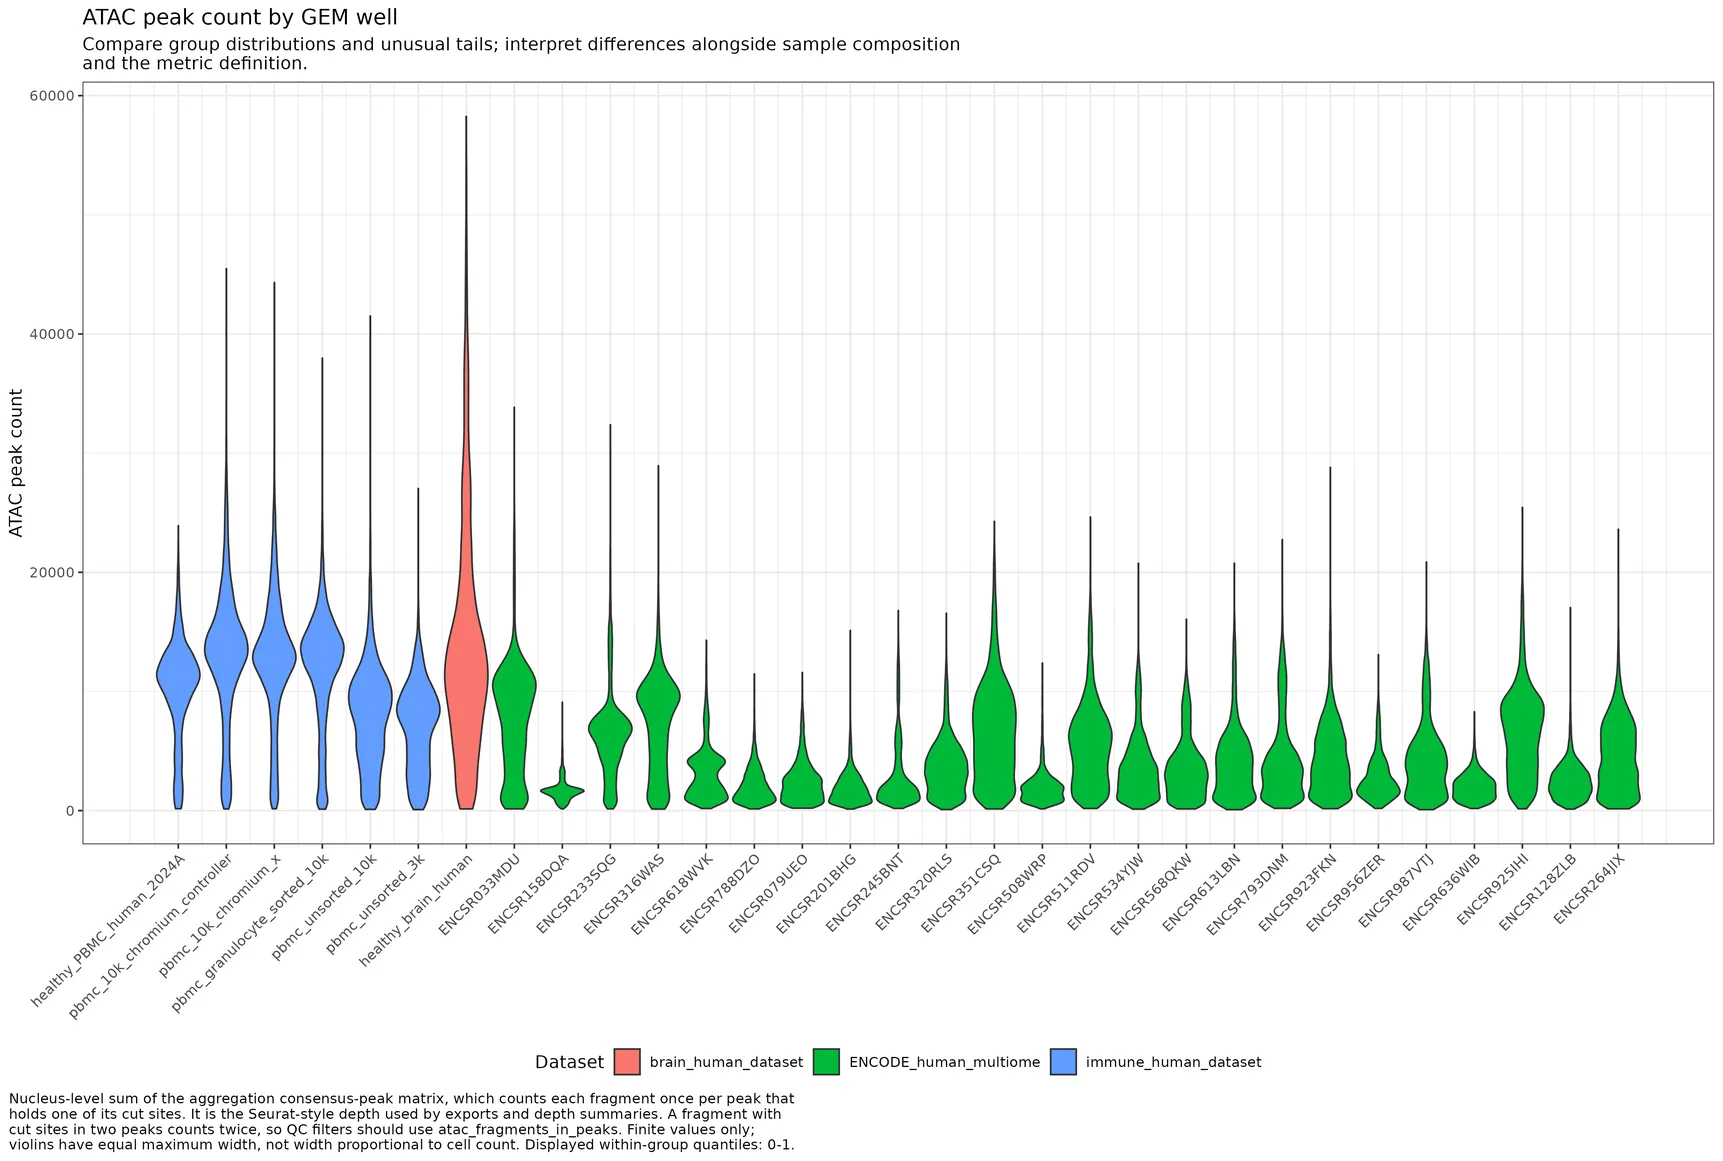
Violin plots of peak-based ATAC QC metrics per GEM well. peaks_QC_violins_plot.4_peak_QC
5. ATAC filtering
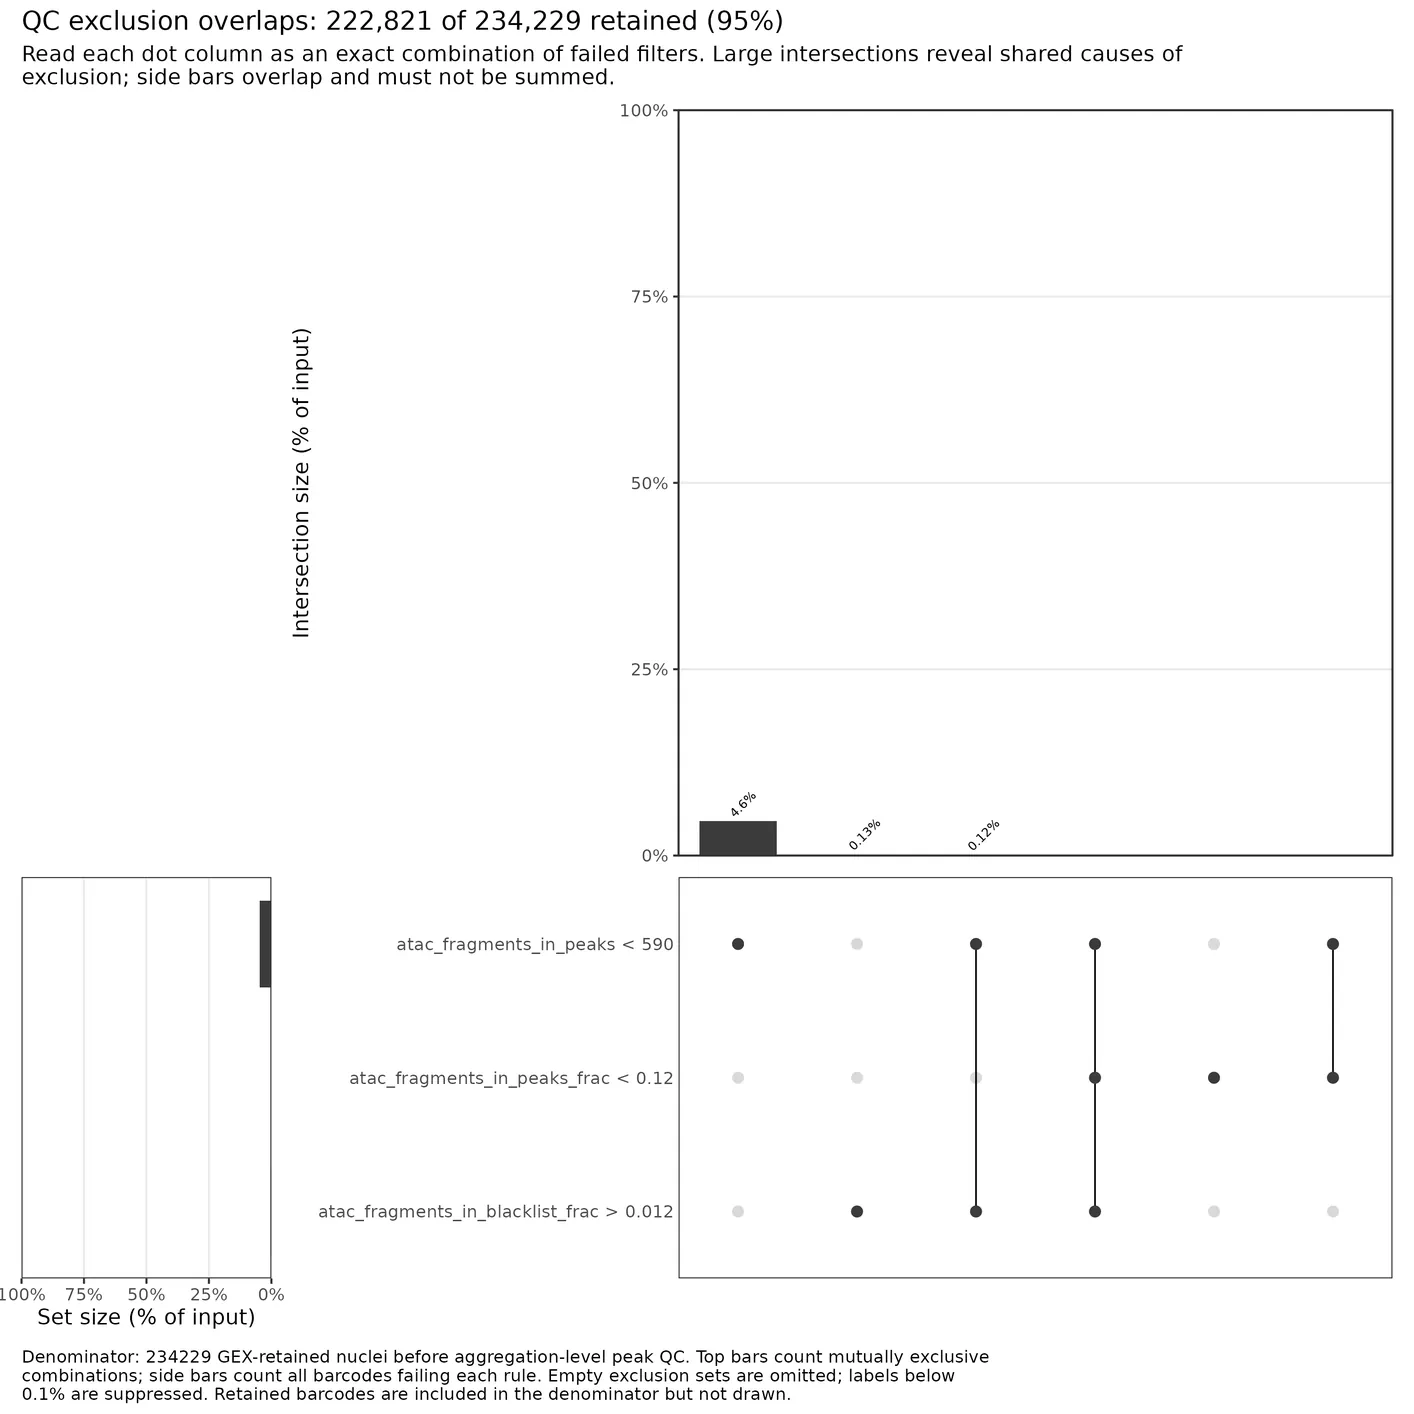
UpSet plot of overlapping ATAC QC exclusion reasons. QC_excluded_upset_plot.5_pre_LSI_QC
Plot cumulative nuclei retention through peak QC. cell_retention_flow_plot.5_pre_LSI_QC
6. ATAC dimension reduction
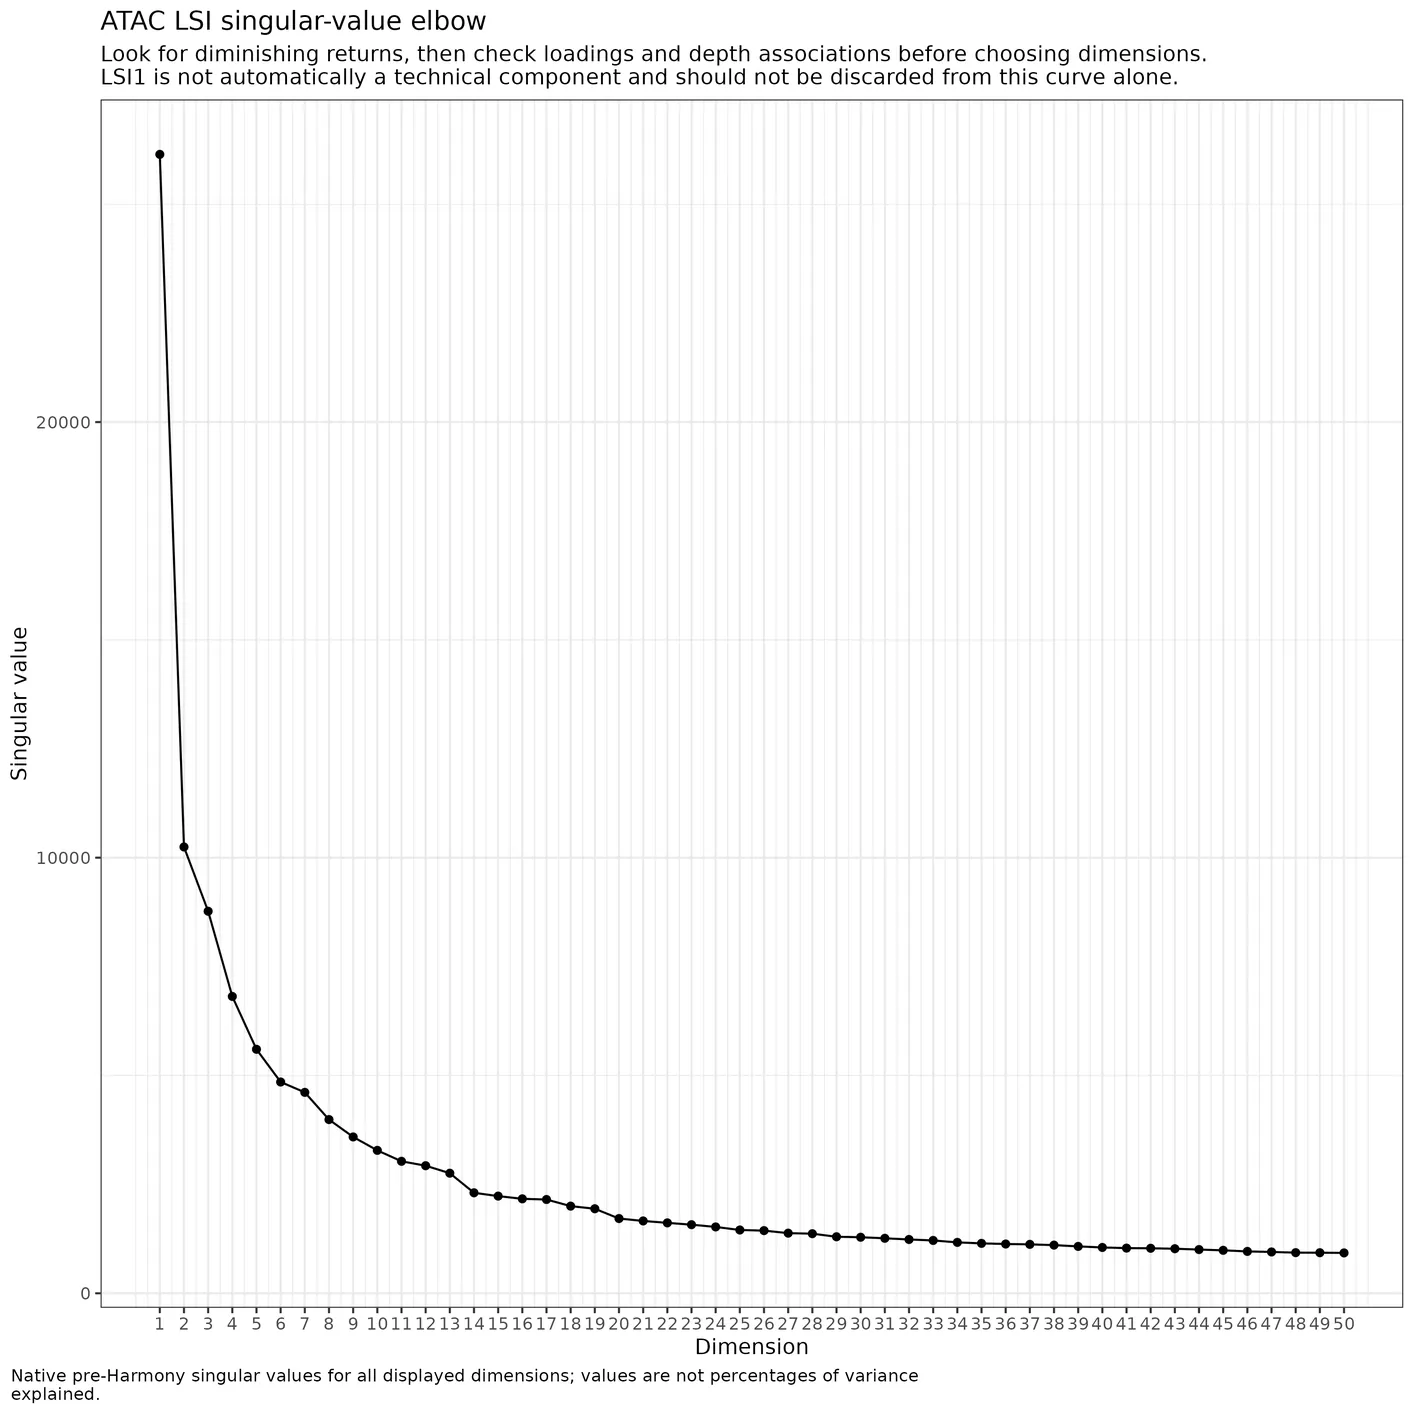
Elbow plot of native ATAC LSI singular values. LSI_singular_values_elbow_plot.6_ATAC_LSI_QC
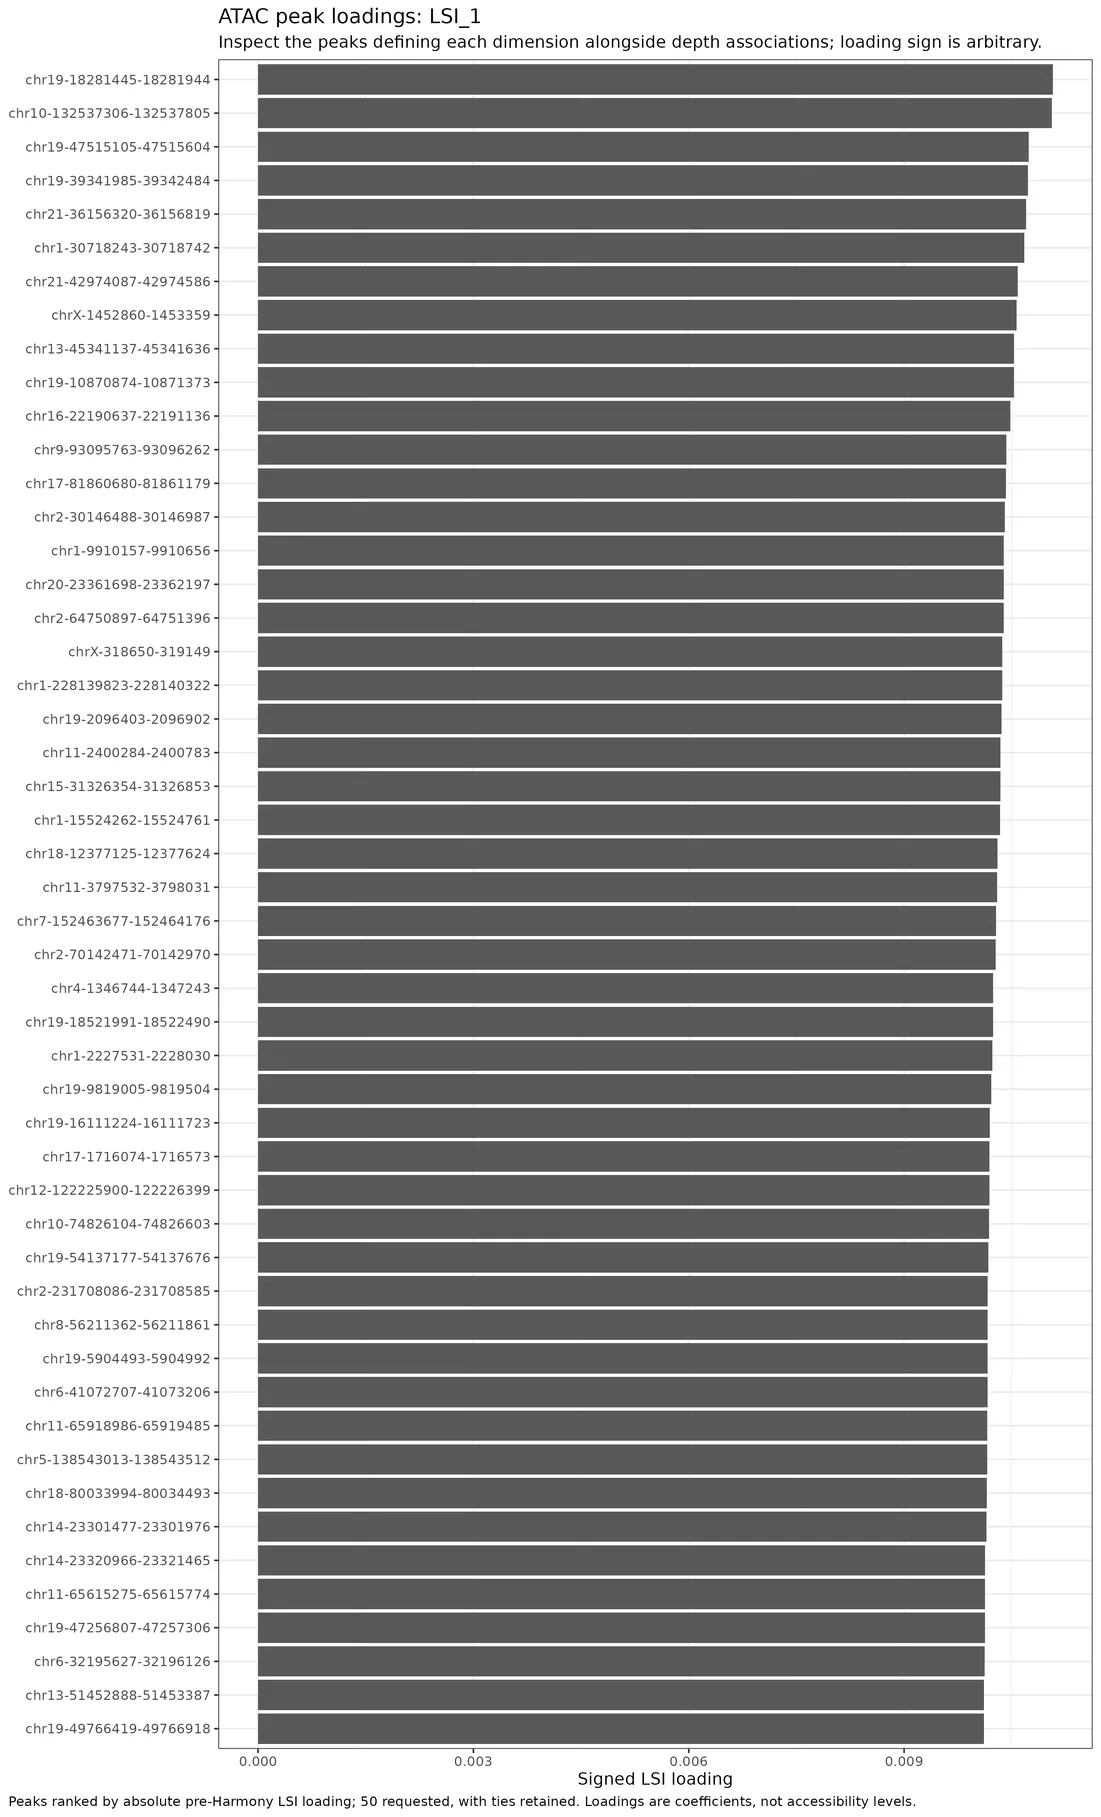
Plot top feature loadings for each LSI dimension. VizDimLoadings_plots.6_ATAC_LSI_QC
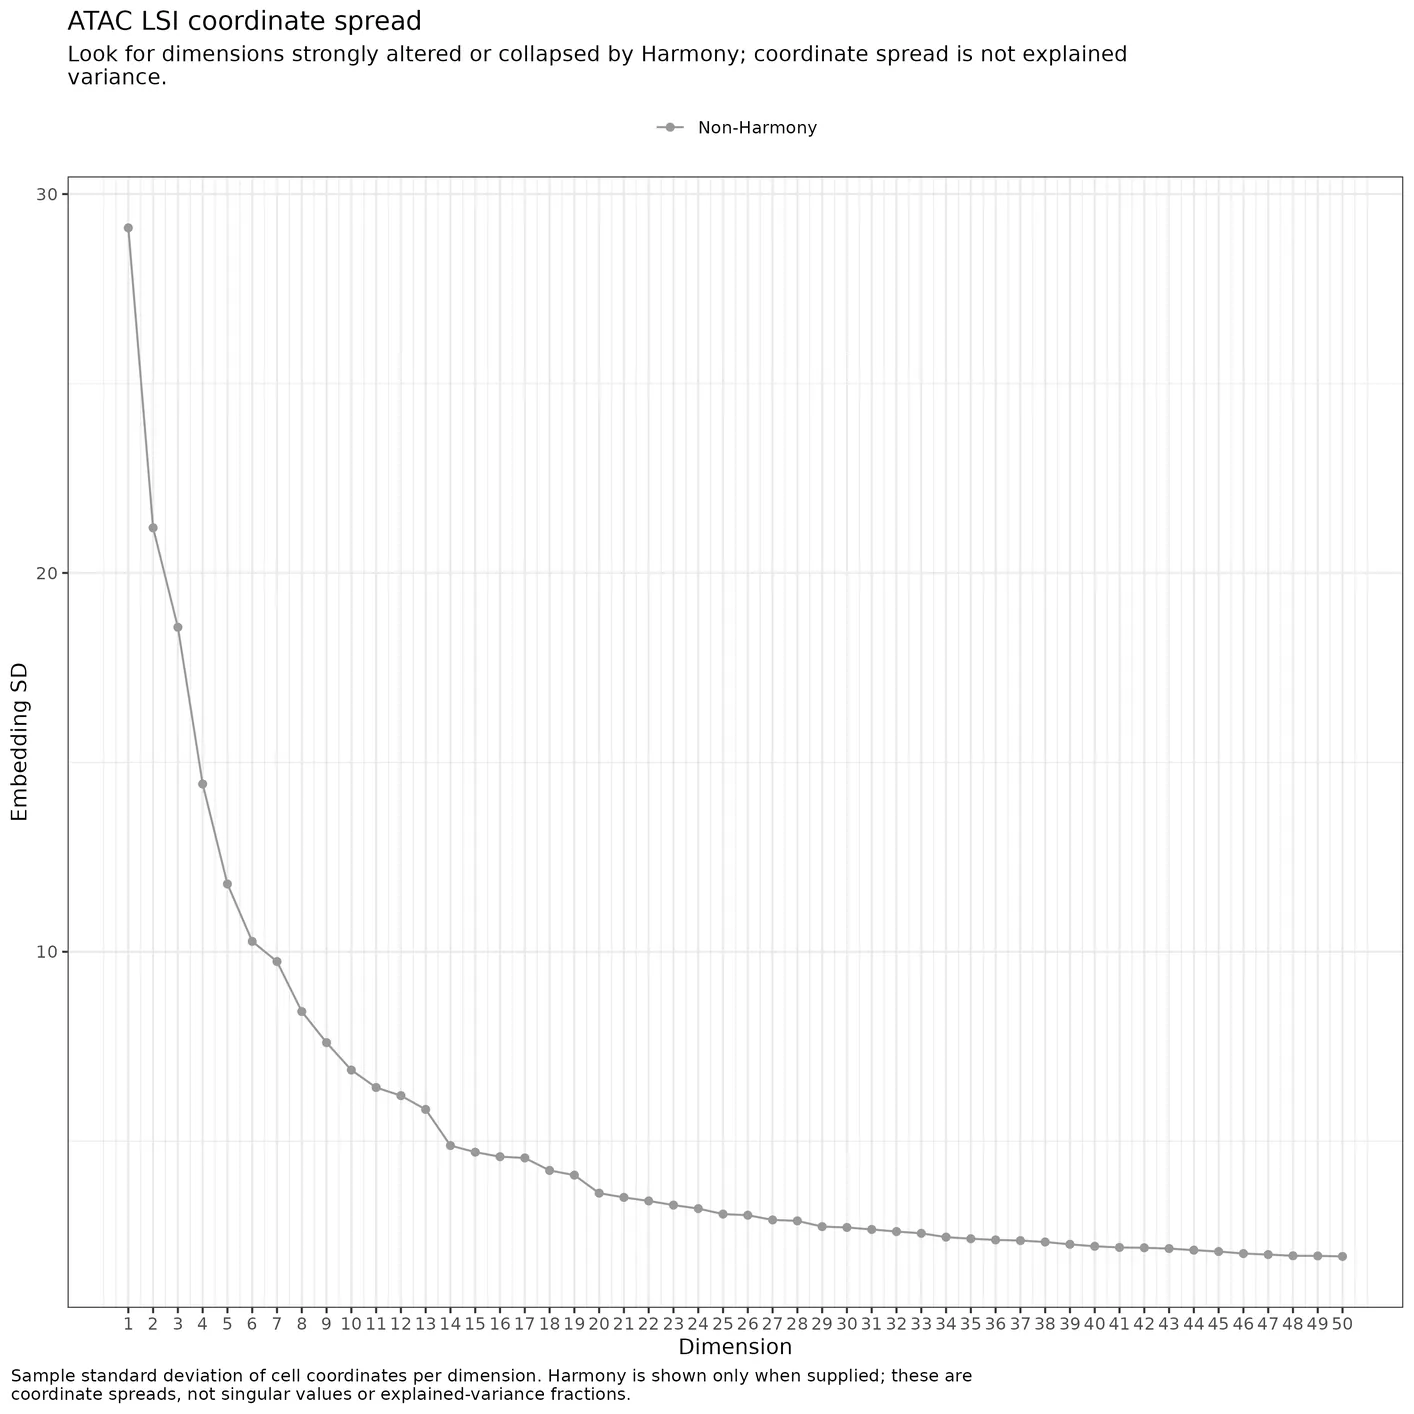
Non-Harmony and Harmony ATAC LSI embedding coordinate SD plot. LSI_embedding_sdev_plot.6_ATAC_LSI_QC
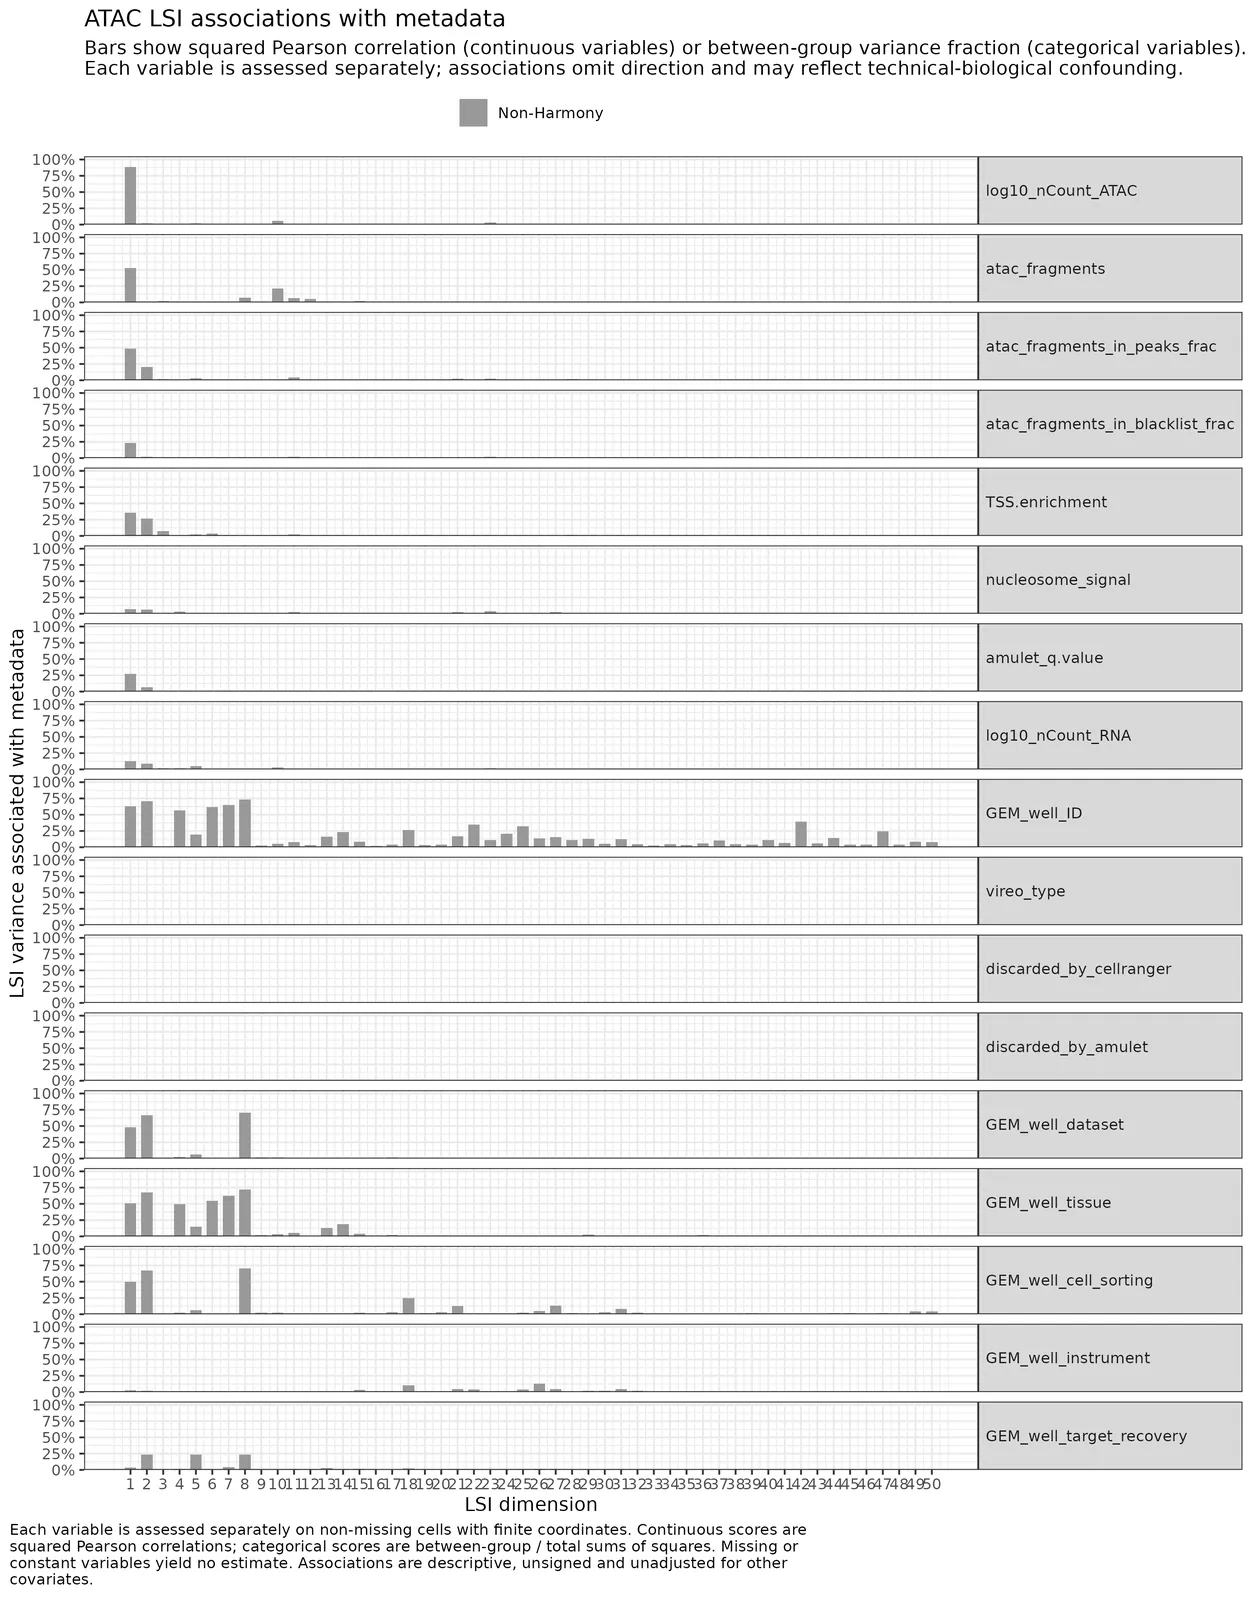
Non-Harmony and Harmony ATAC LSI metadata association bar plots. LSI_metadata_association_barplots.6_ATAC_LSI_QC
7. ATAC clusters and motifs
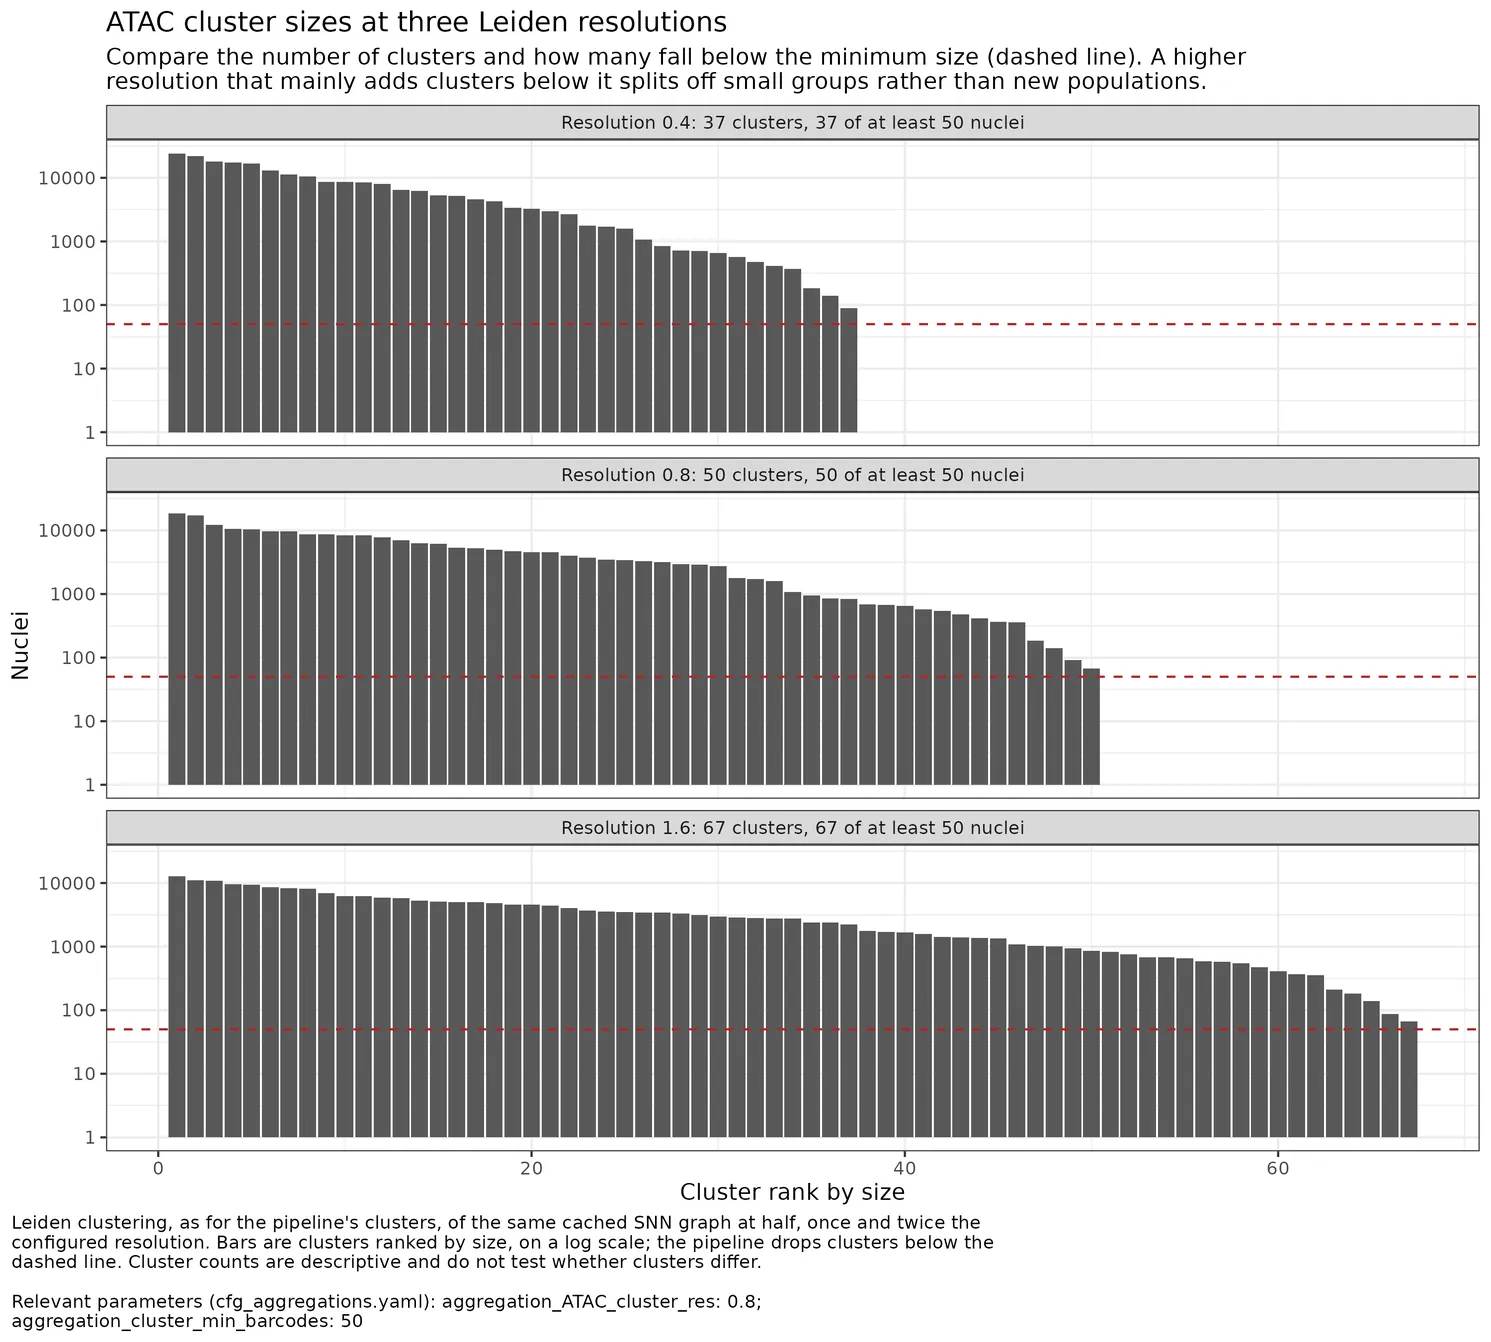
Plot ATAC cluster sizes at half, once and twice the configured Leiden resolution. resolution_sweep_plot.7_ATAC_QC
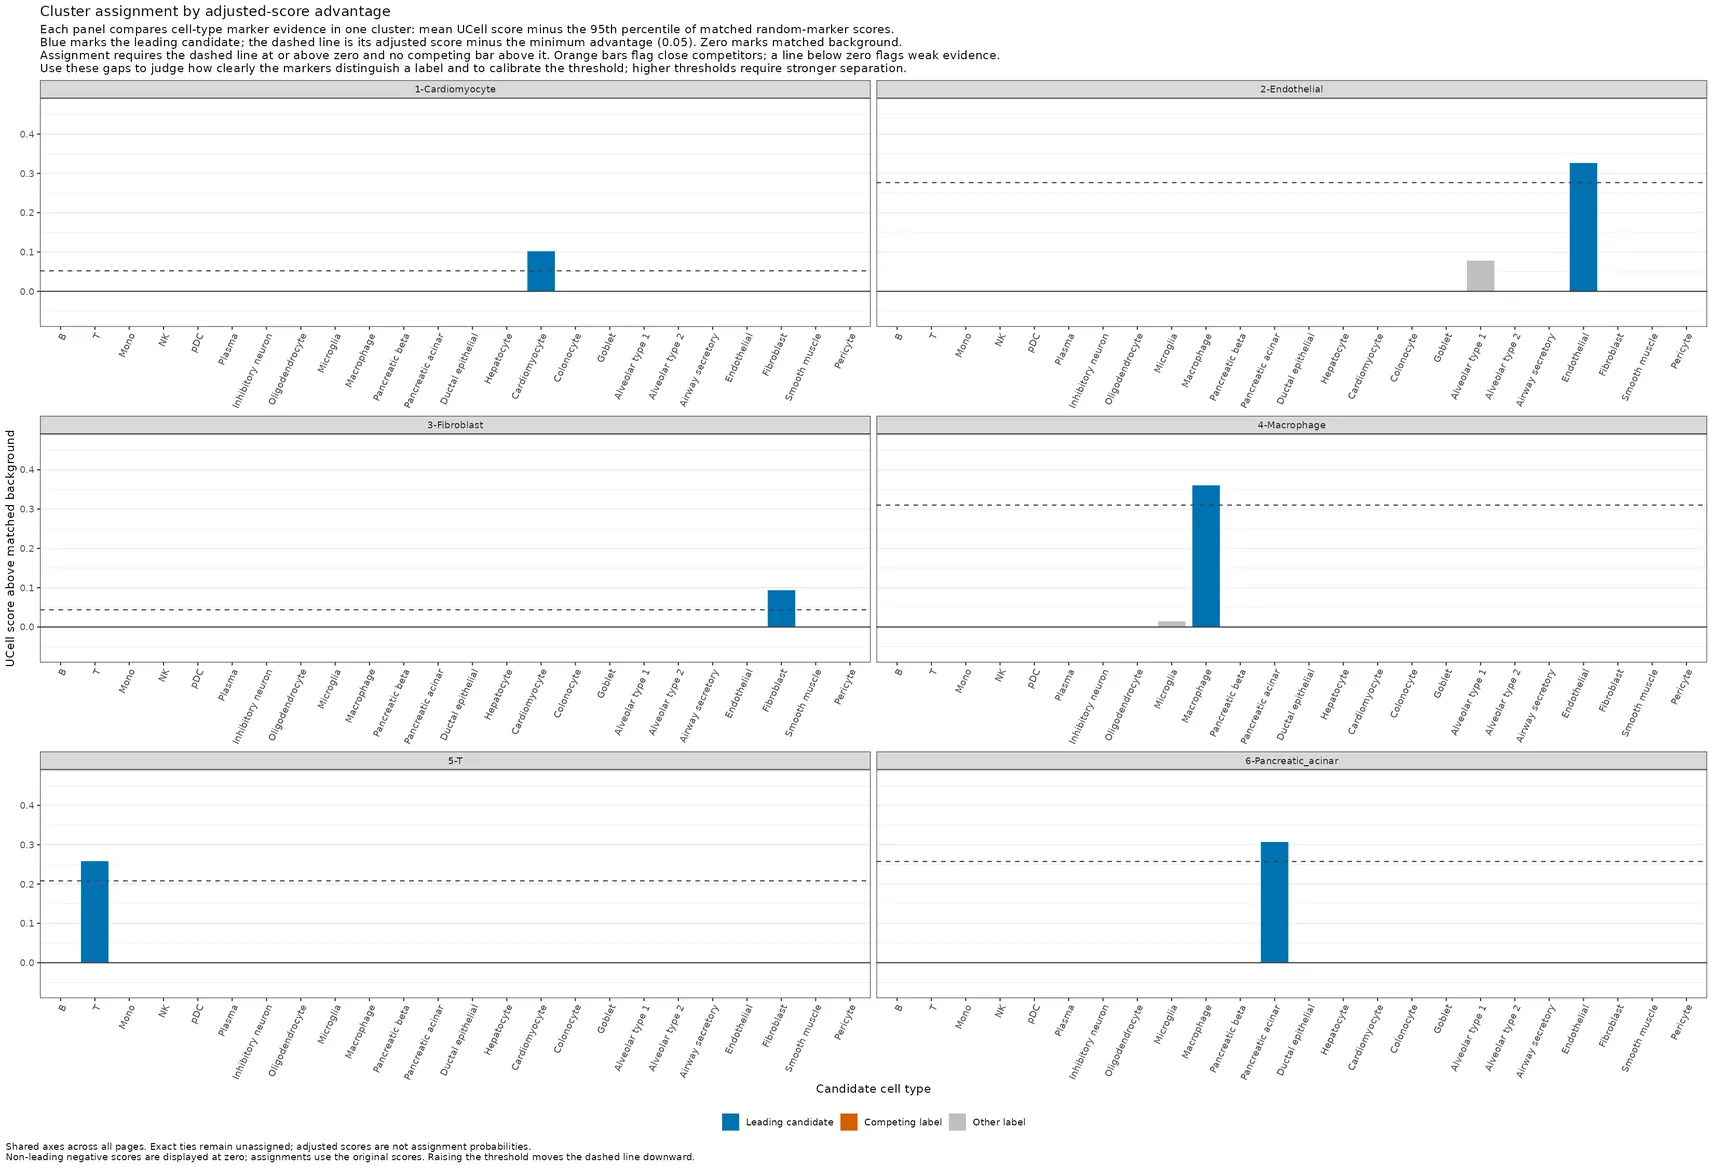
Faceted ATAC cluster adjusted GEX scores with matched background and the competition cutoff. cluster_UCell_advantage_plots.7_ATAC_QC
Plot ATAC coverage tracks at marker gene and DA peak loci. coverage_tracks_plots.7_ATAC_QC
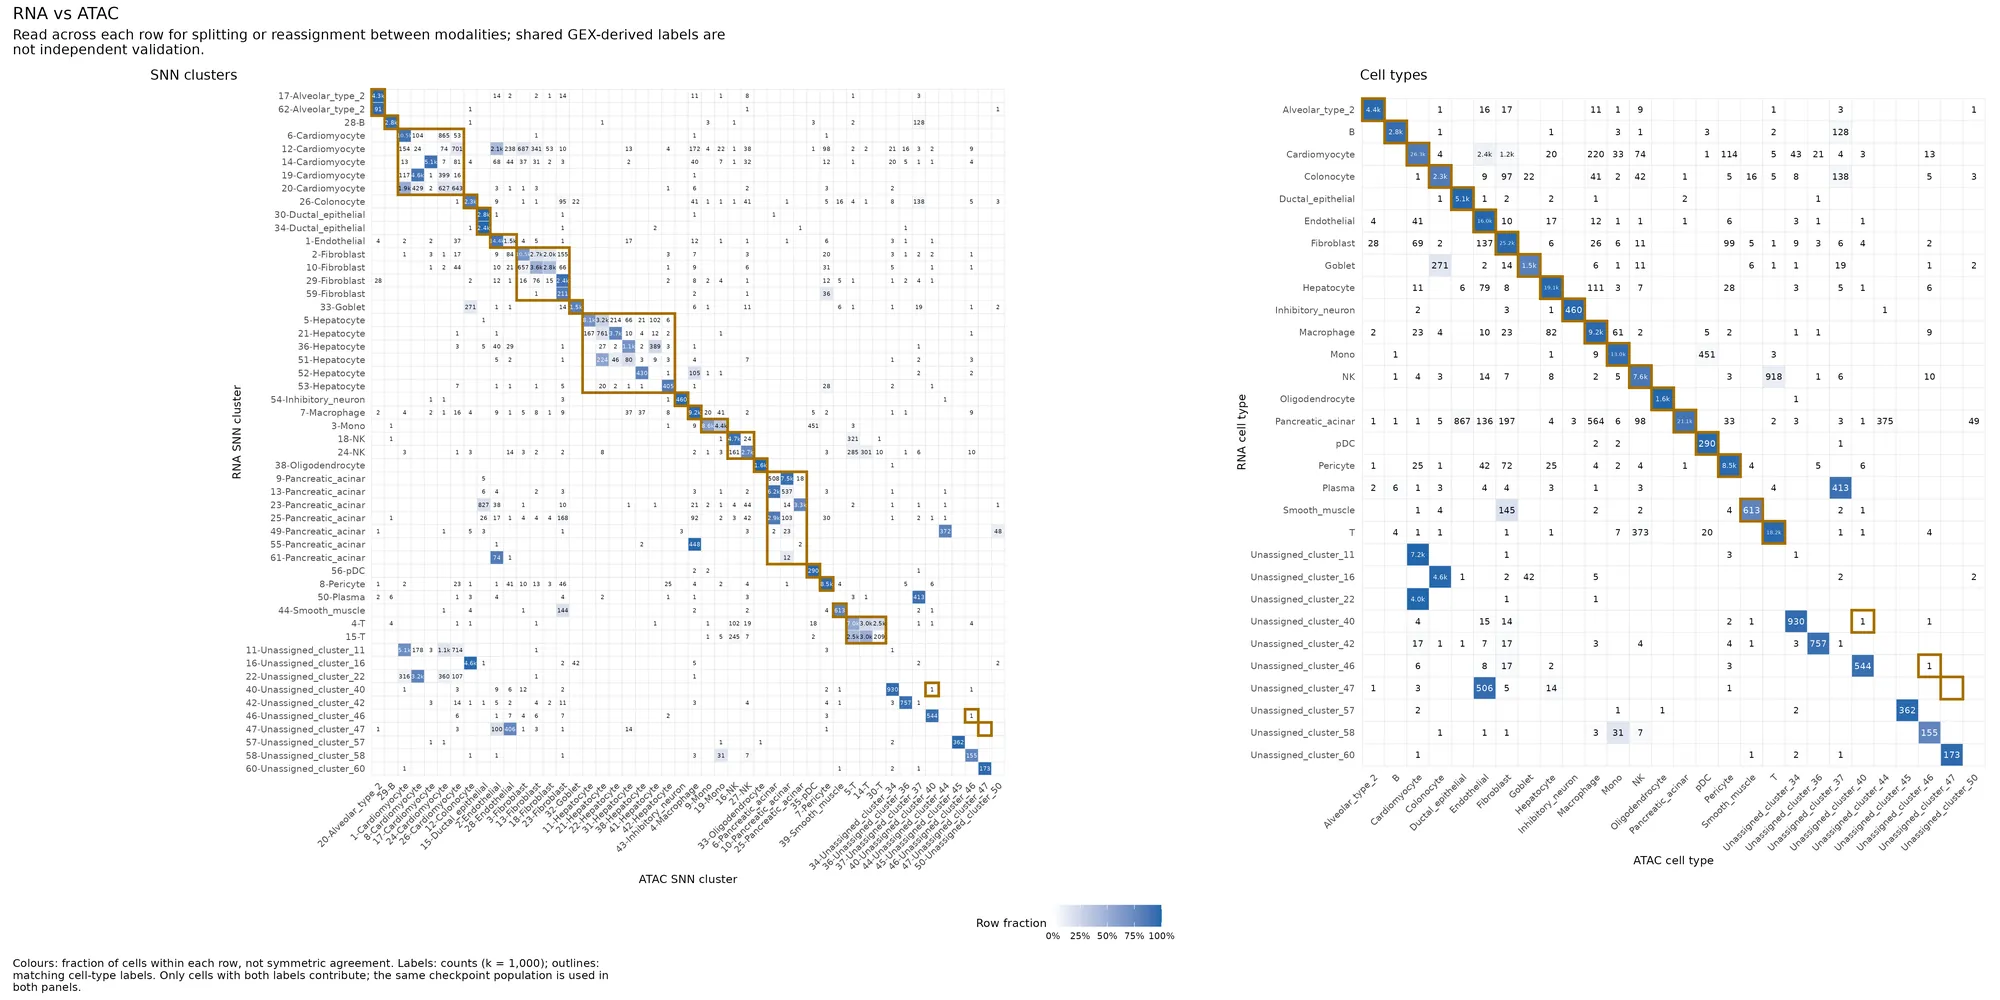
Paired RNA versus ATAC cluster and cell-type confusion matrices before WNN integration. confusion_matrices_plots.7_ATAC_QC
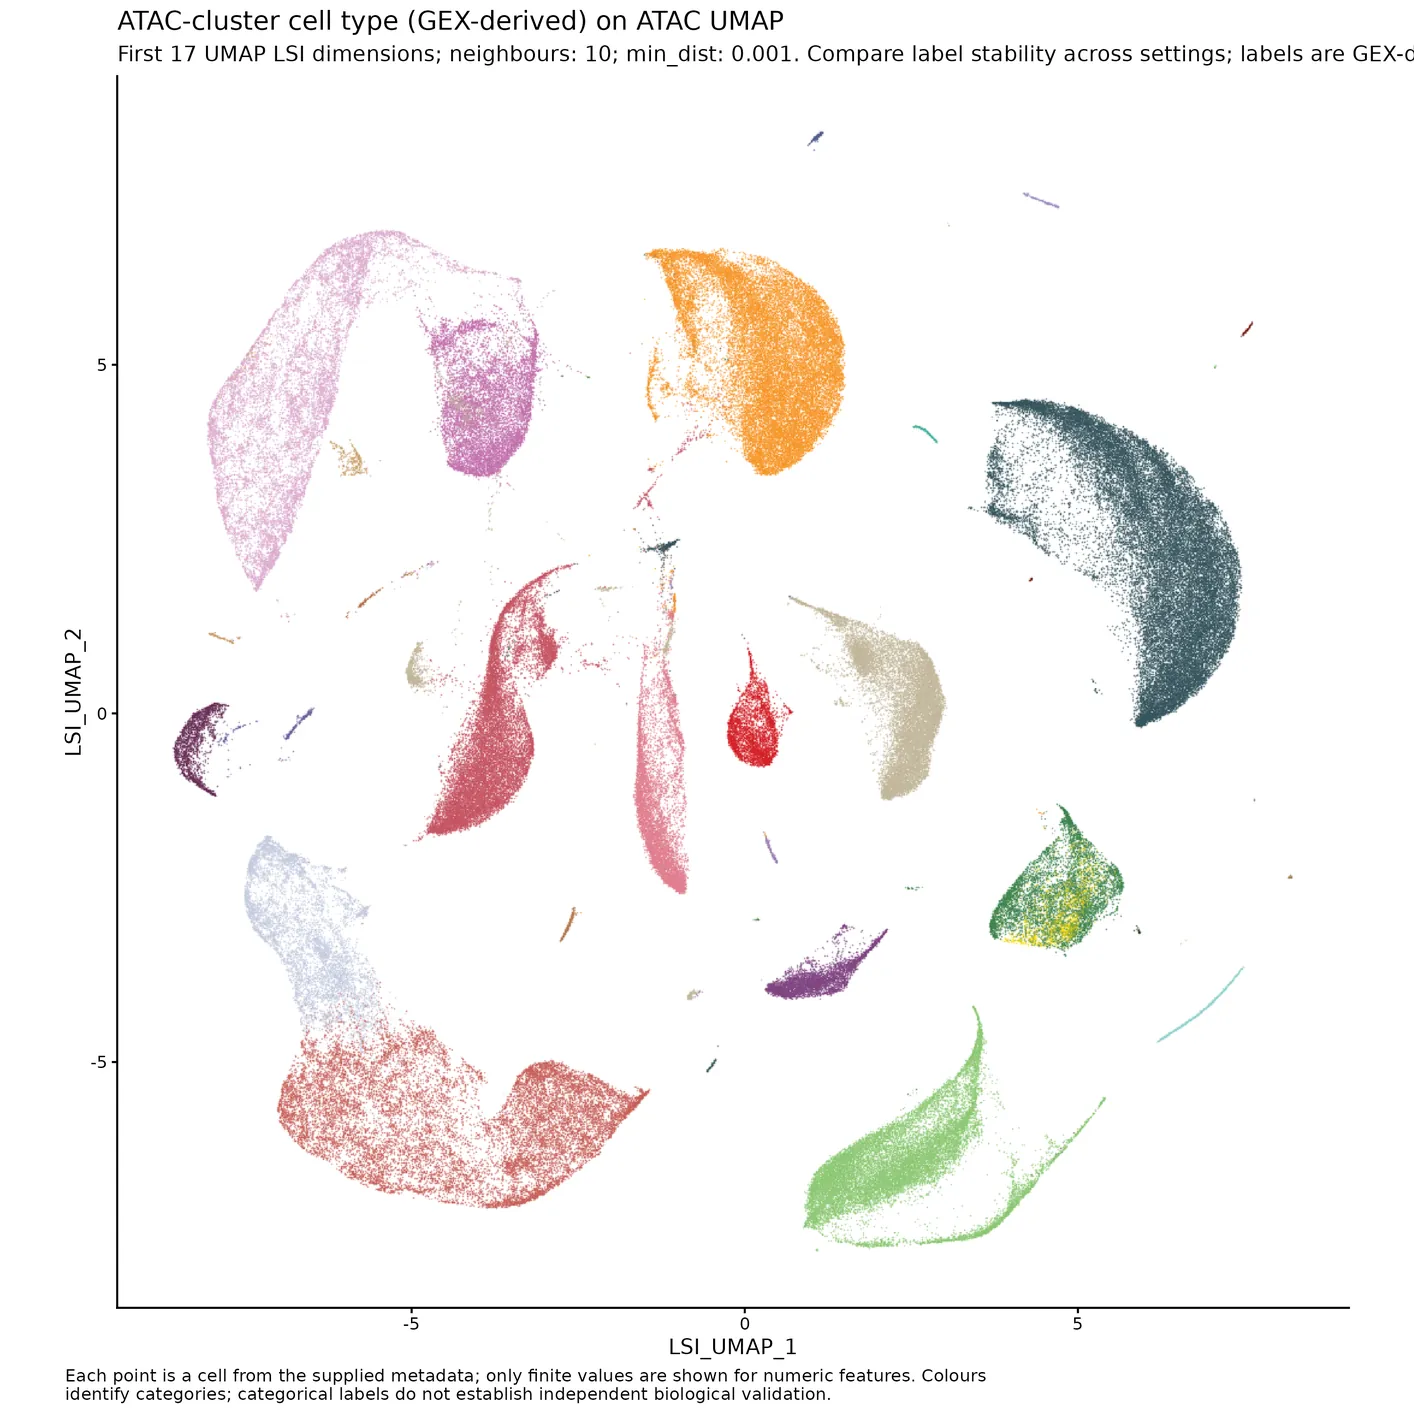
Plot the retained ATAC nuclei’s cell types on UMAPs across a sweep of LSI dimension counts and neighbor counts. cross.UMAPs.7_ATAC_QC
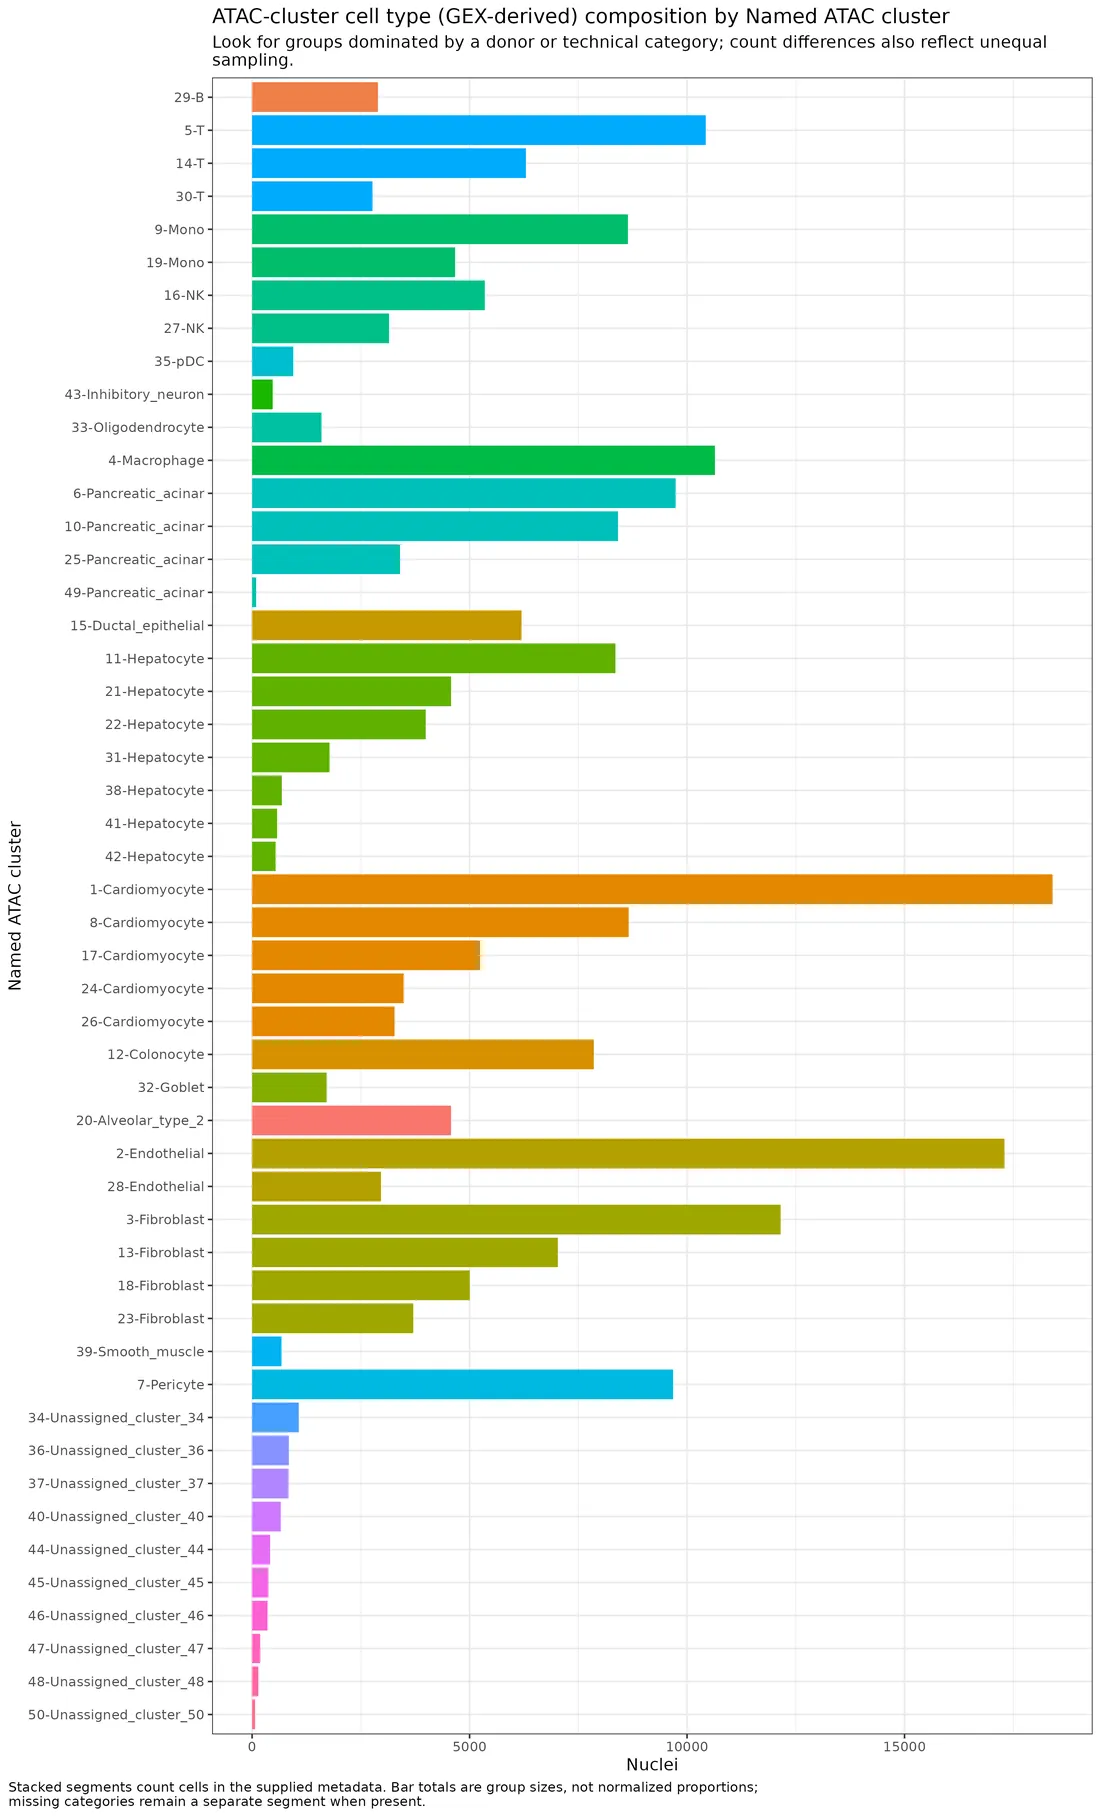
Bar plots of categorical metadata composition per SNN cluster before ATAC doublet filtering. categorical_by_cluster_bars_plots.7_ATAC_QC
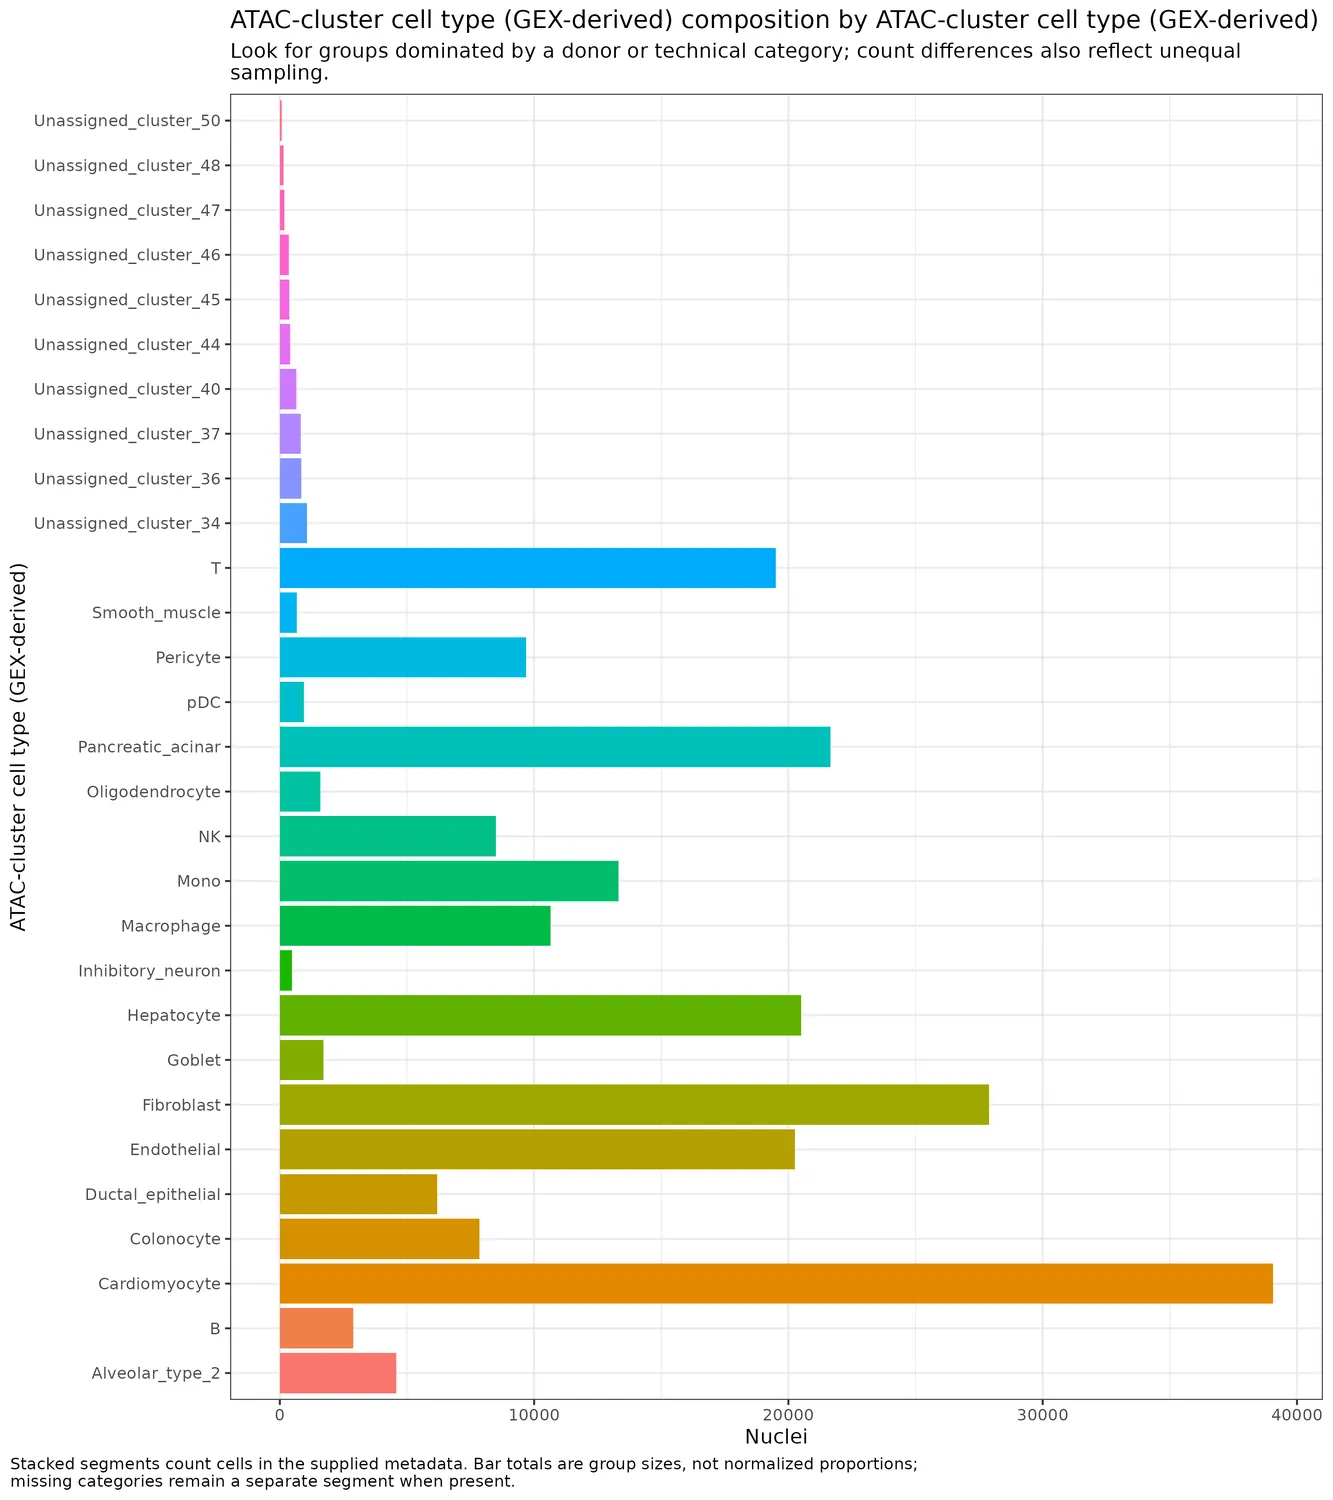
Bar plots of categorical metadata composition per cell type before ATAC doublet filtering. categorical_by_cell_type_bars_plots.7_ATAC_QC
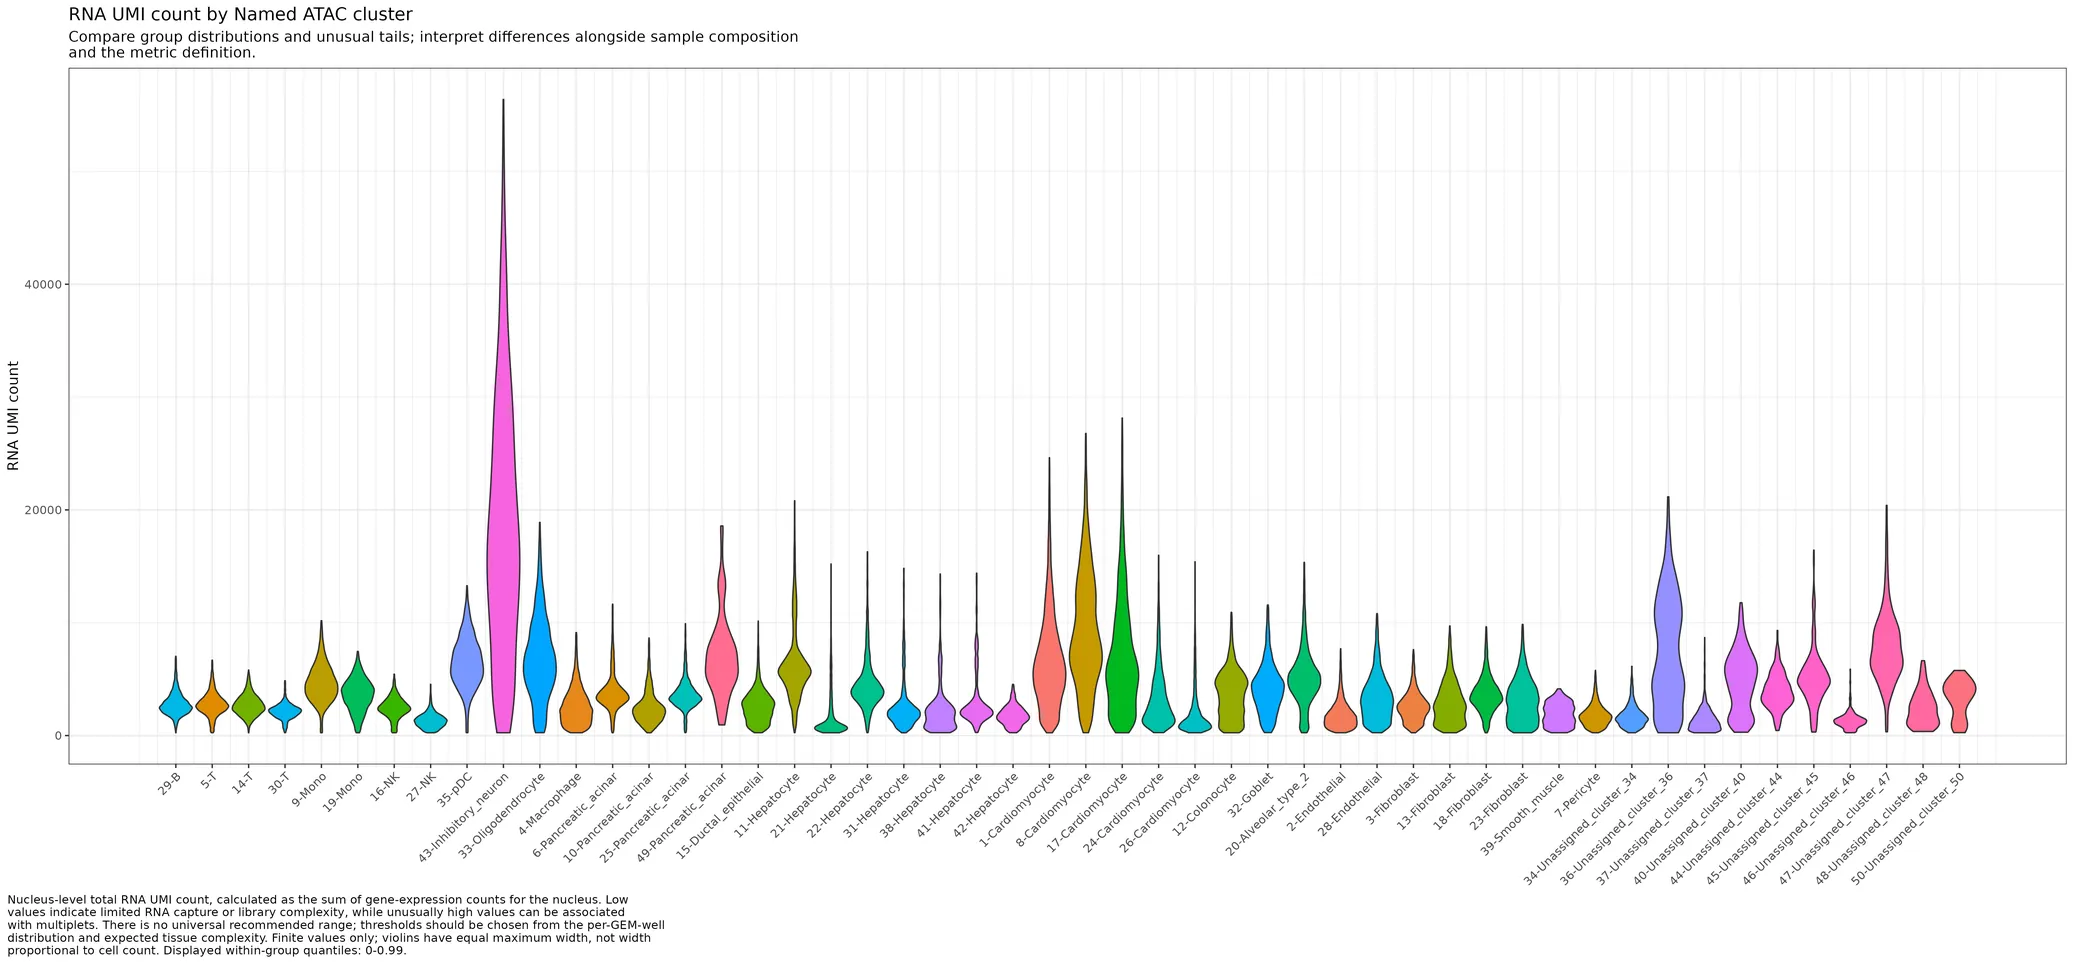
Violin plots of continuous QC and cell-cycle features per SNN cluster before ATAC doublet filtering. continuous_by_cluster_violin_plot.7_ATAC_QC
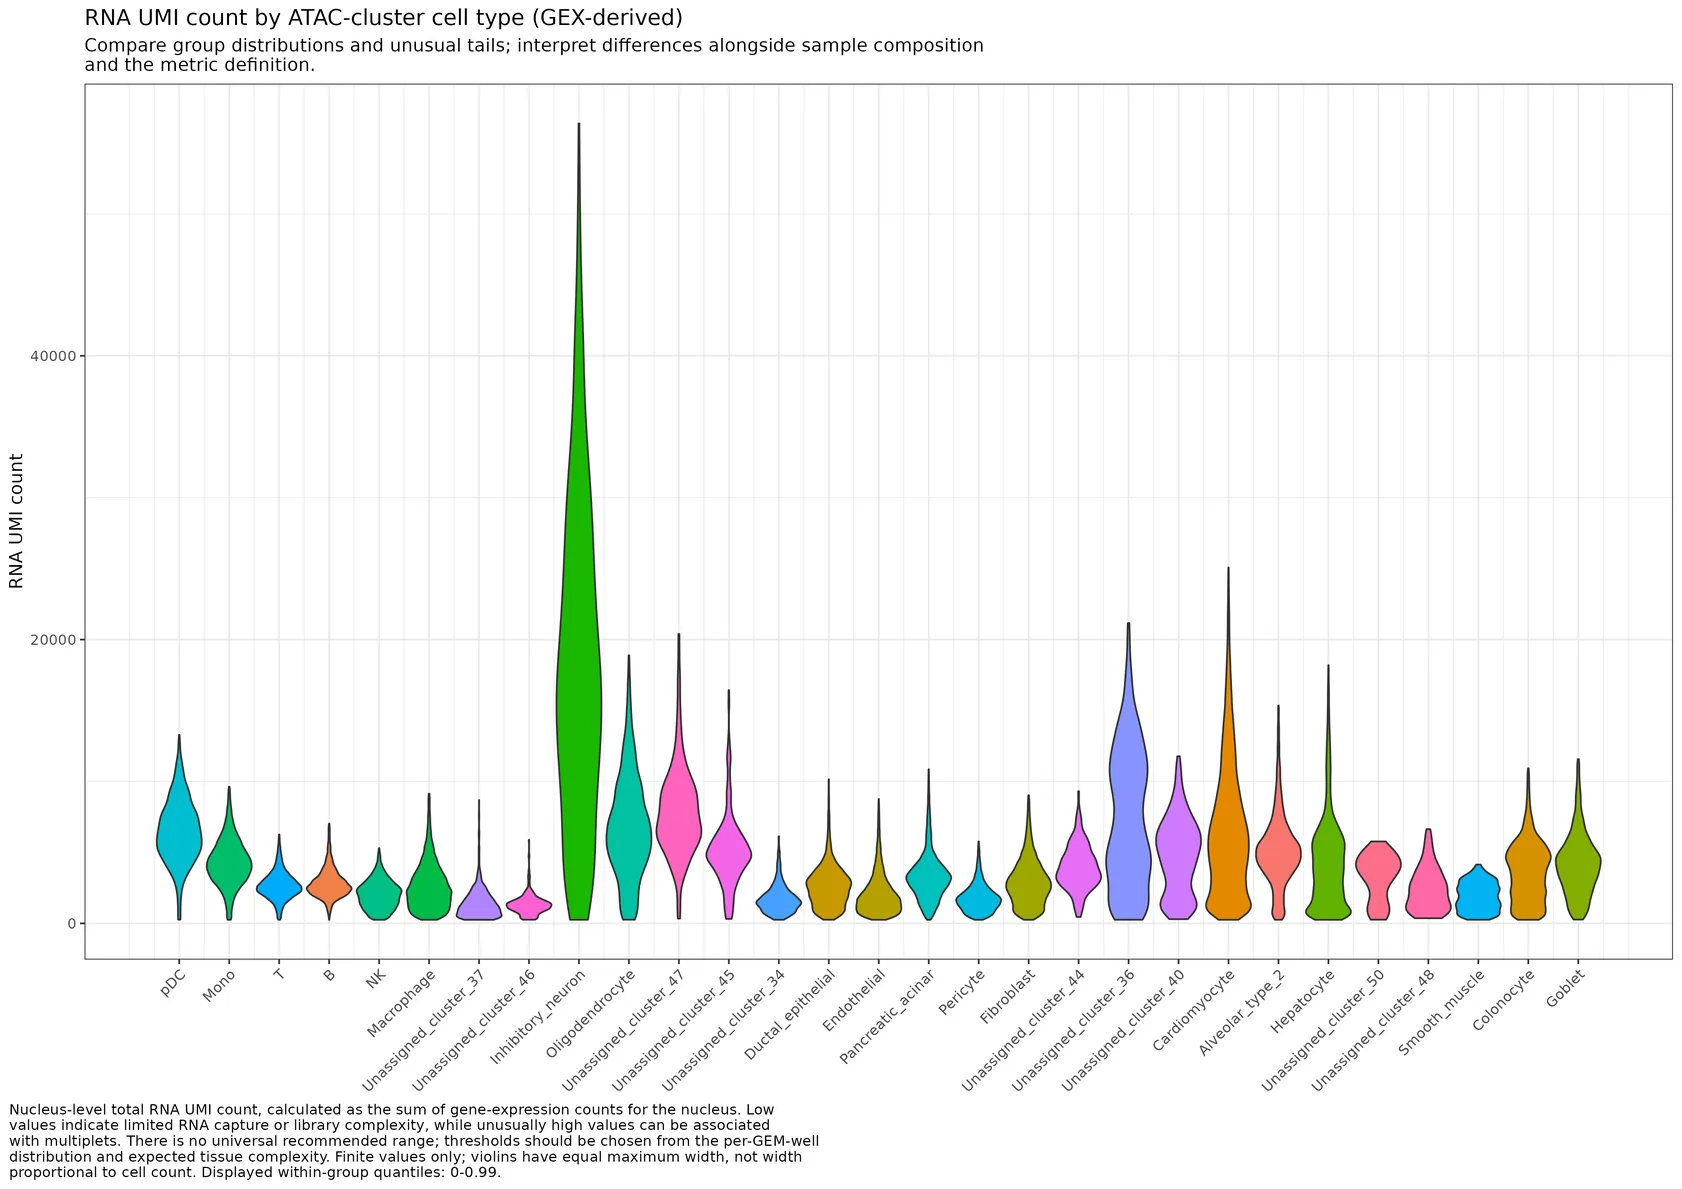
Violin plots of continuous QC and cell-cycle features per cell type before ATAC doublet filtering. continuous_by_cell_type_violin_plot.7_ATAC_QC
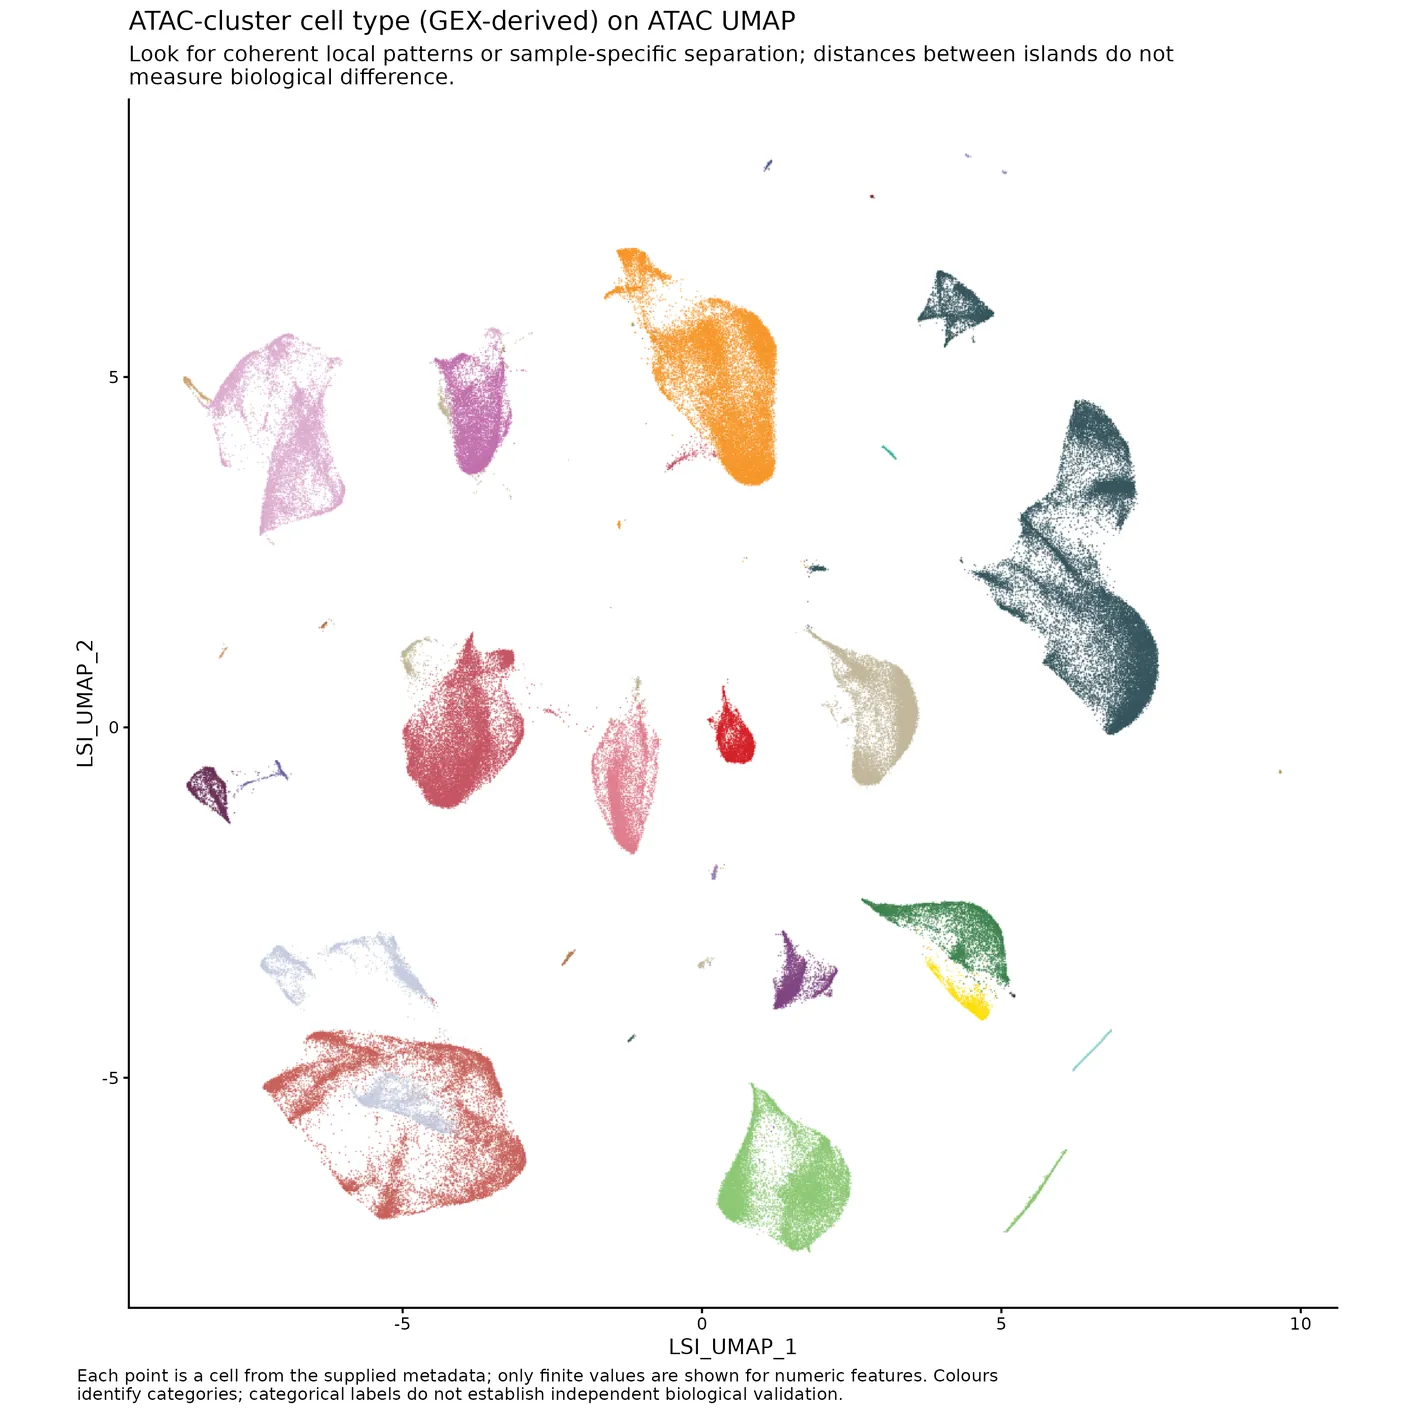
UMAPs colored by categorical metadata variables. categorical.UMAPs.7_ATAC_QC
Plot cumulative nuclei retention through ATAC QC. cell_retention_flow_plot.7_ATAC_QC
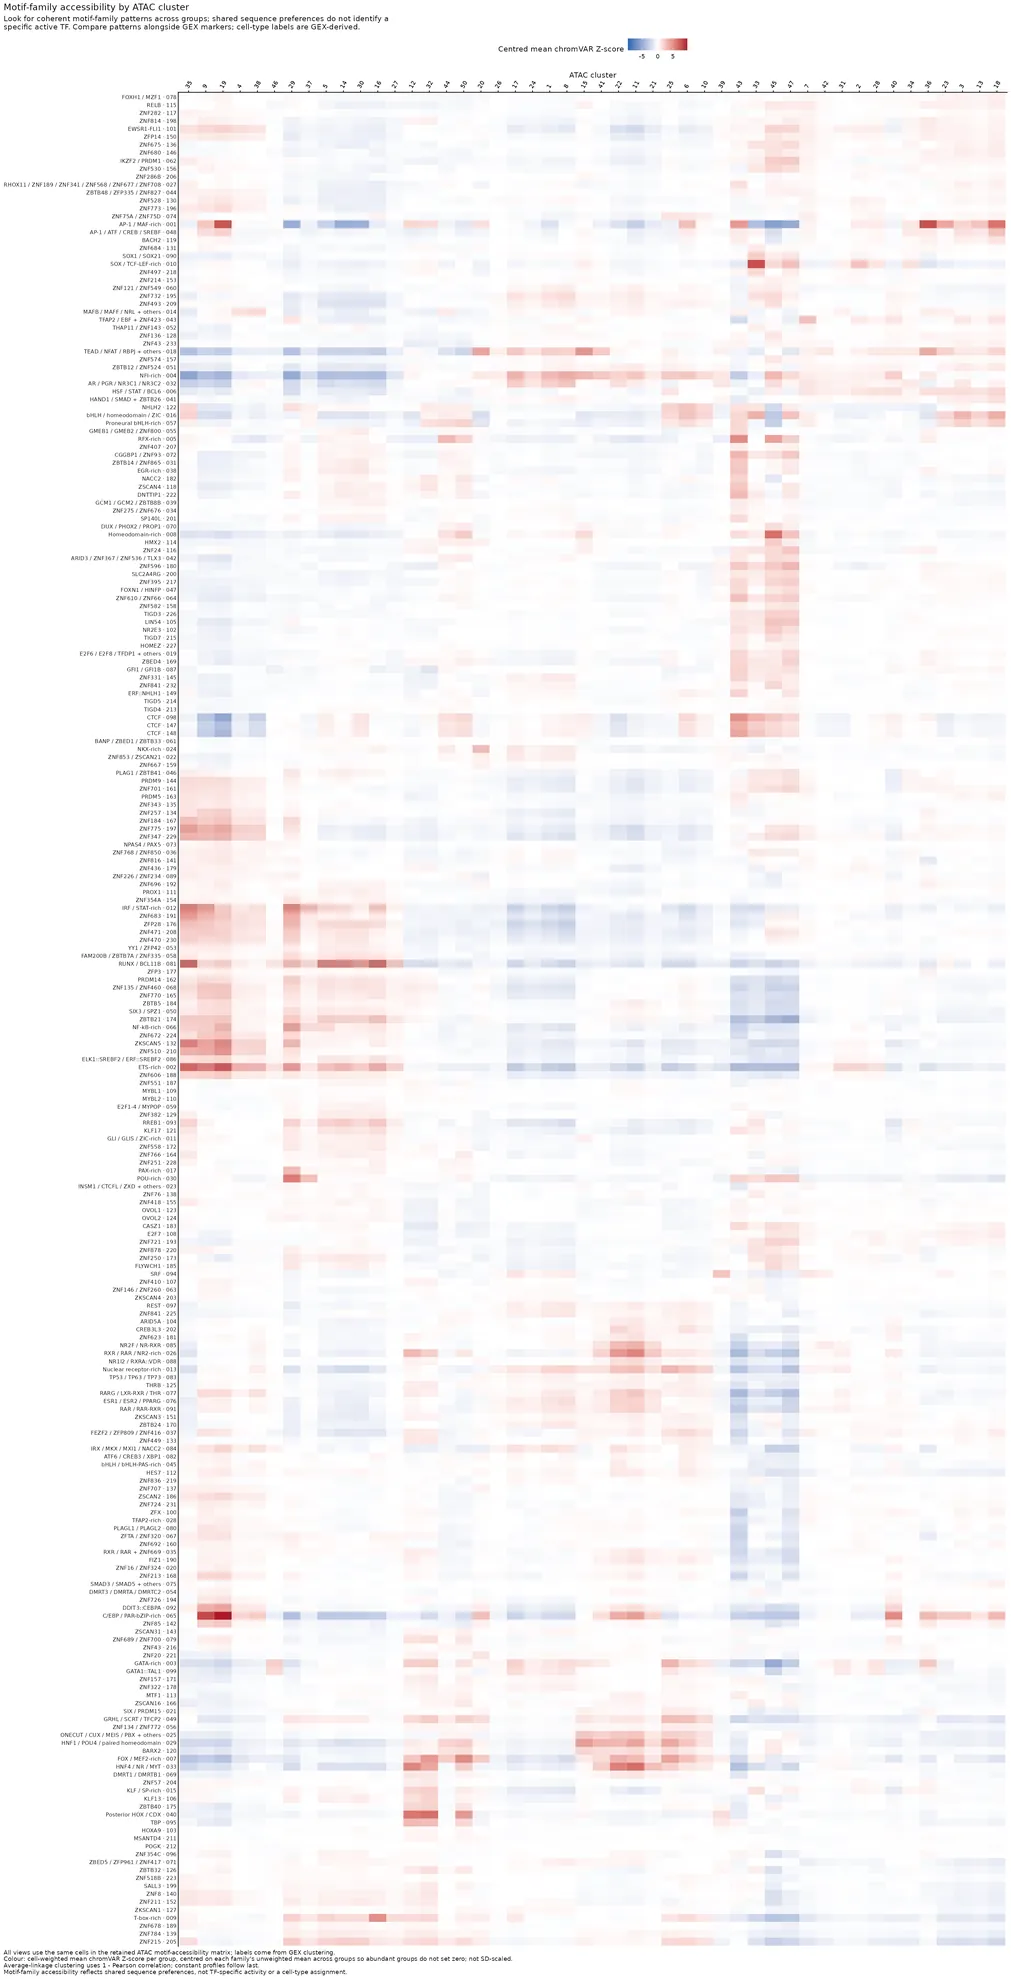
All motif families by ATAC_cluster with independently clustered rows and columns and GEX-derived labels. motif_family_accessibility_by_ATAC_cluster_heatmap.7_ATAC_QC
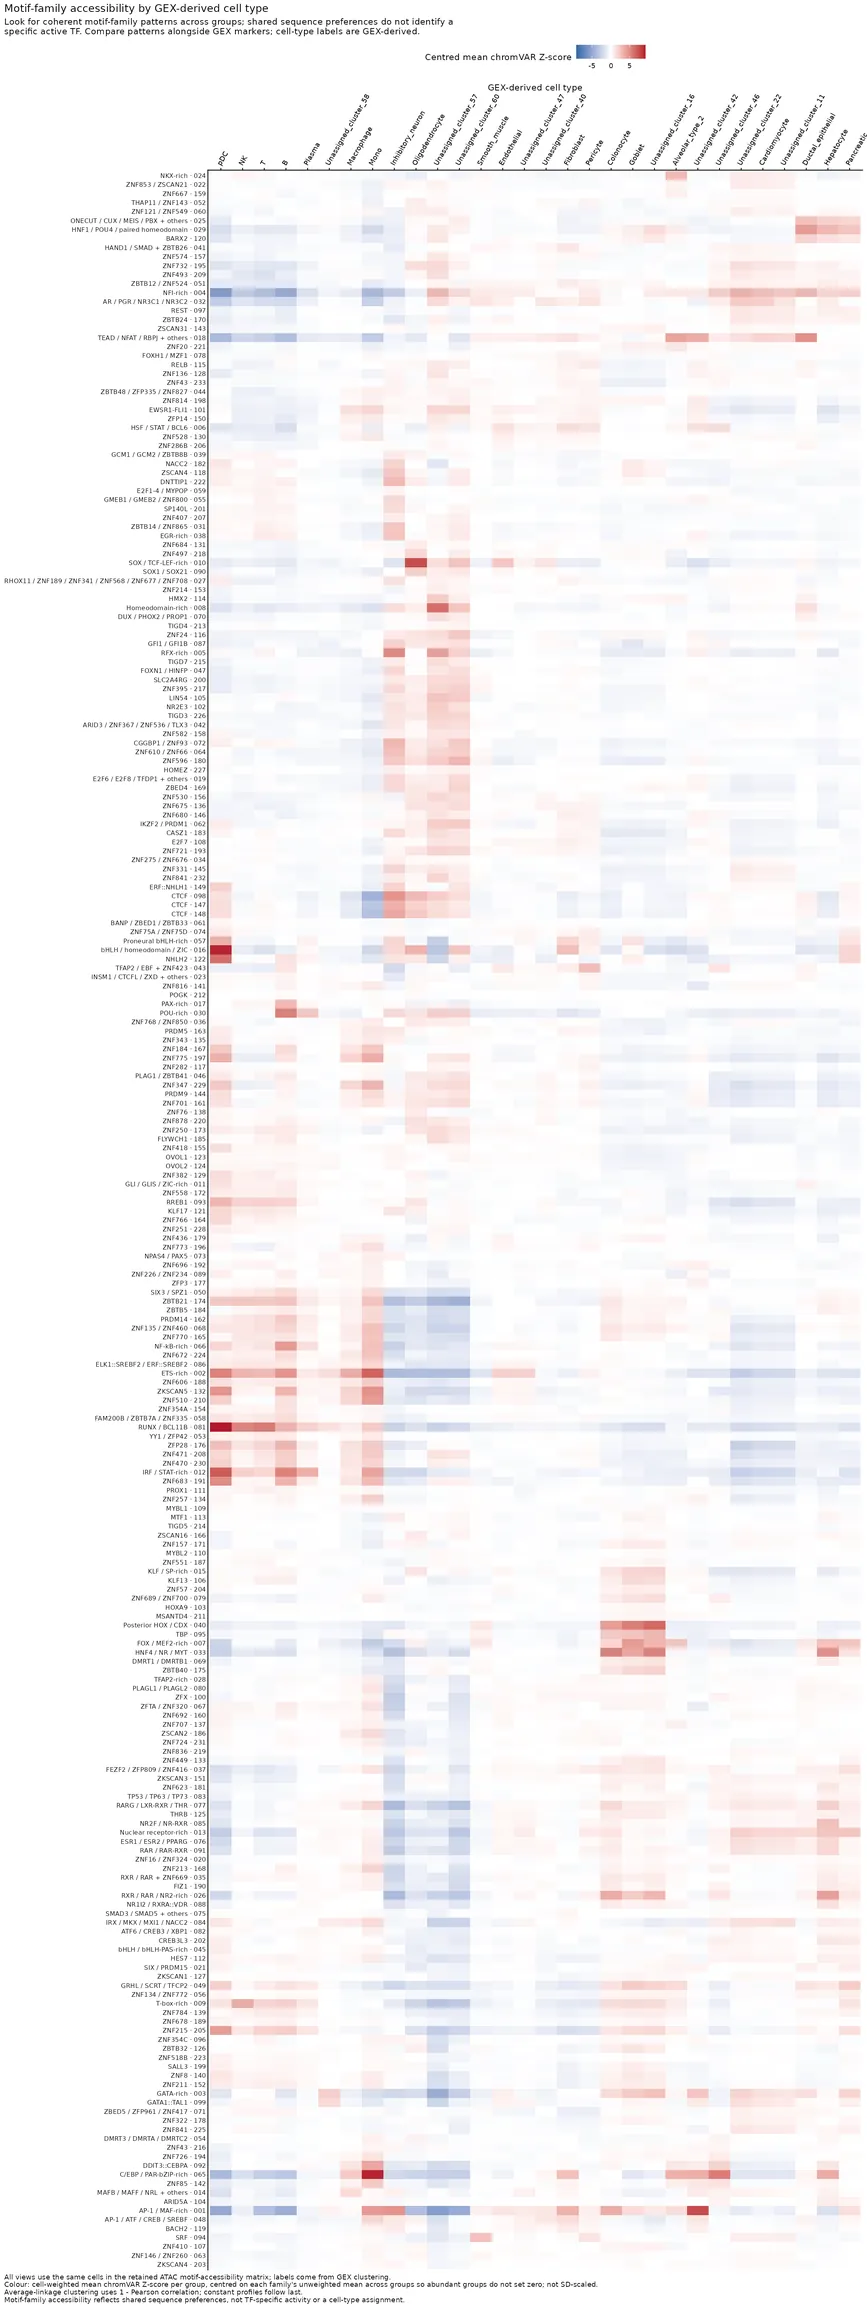
All motif families by GEX_cell_type with independently clustered rows and columns and GEX-derived labels. motif_family_accessibility_by_GEX_cell_type_heatmap.7_ATAC_QC
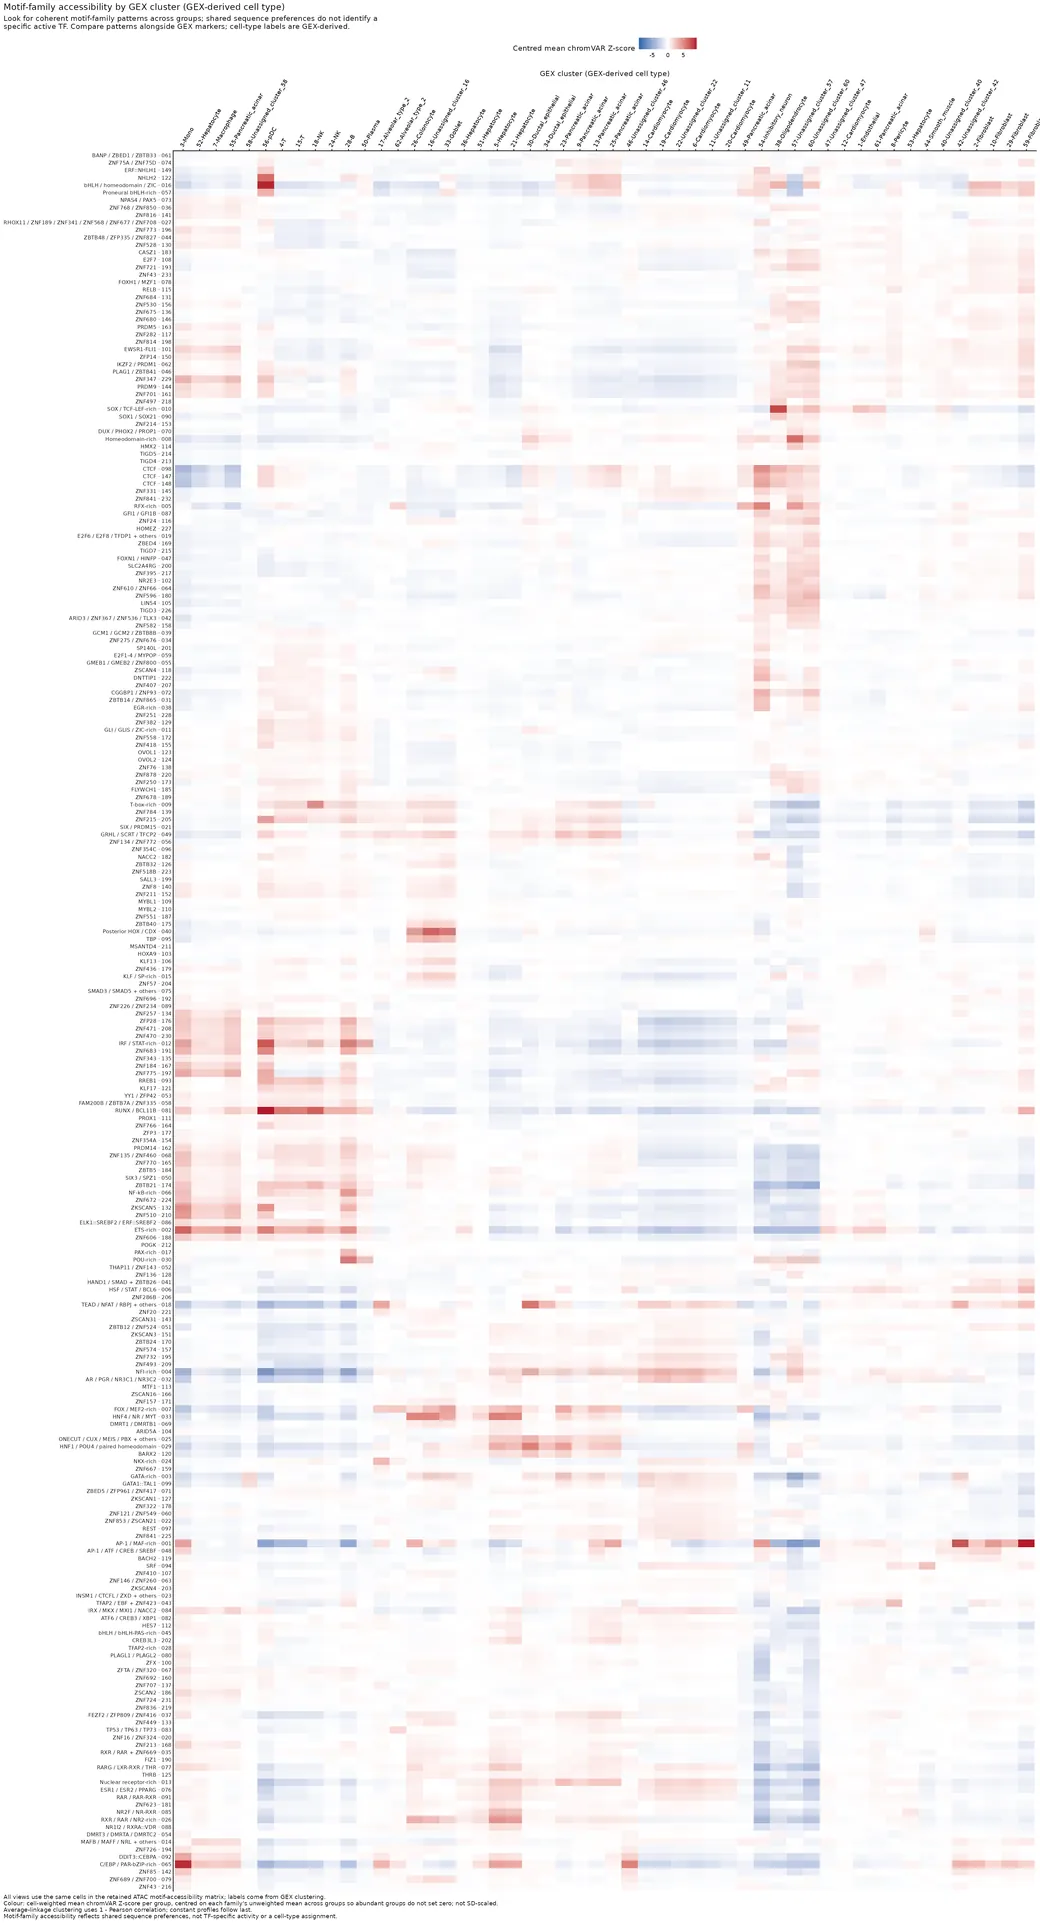
All motif families by GEX_cluster with independently clustered rows and columns and GEX-derived labels. motif_family_accessibility_by_GEX_cluster_heatmap.7_ATAC_QC
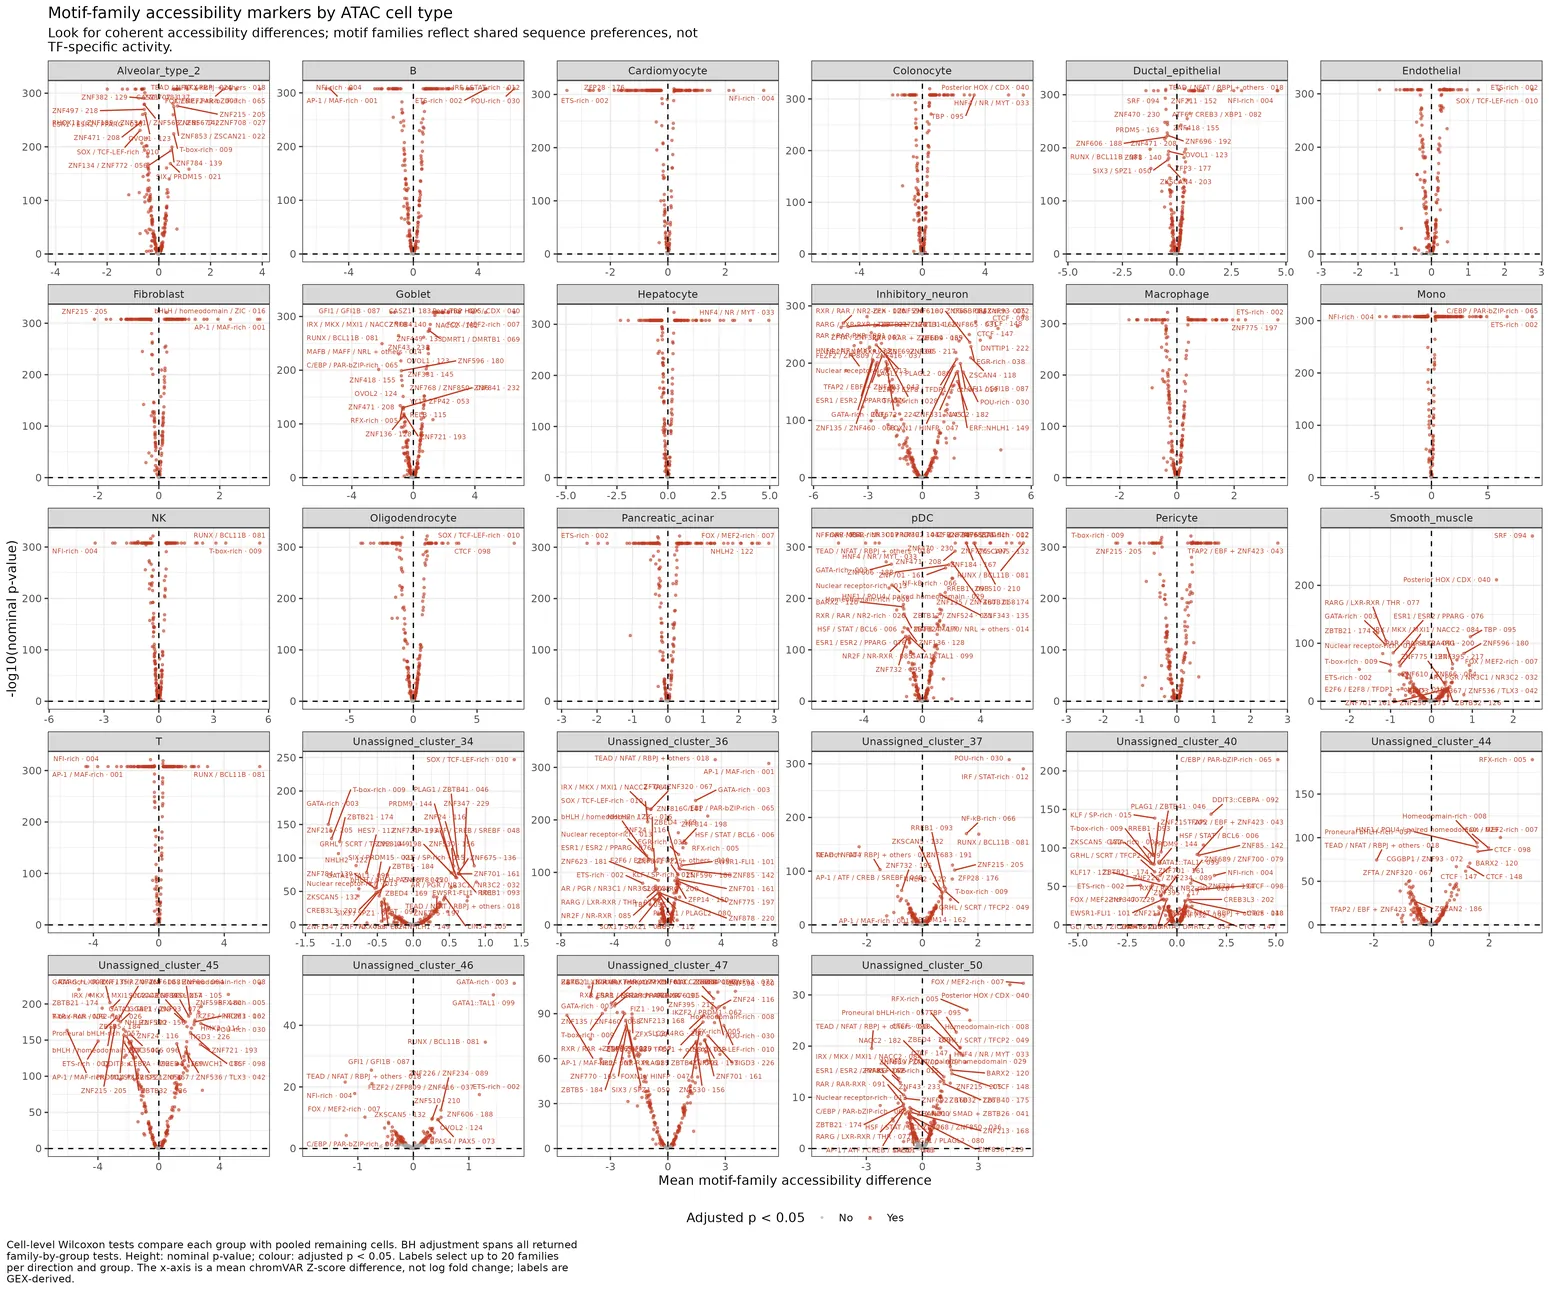
Facetted volcano plot of marker motif-family accessibility per ATAC cell type. motif_family_accessibility_marker_volcano_plots.7_ATAC_QC
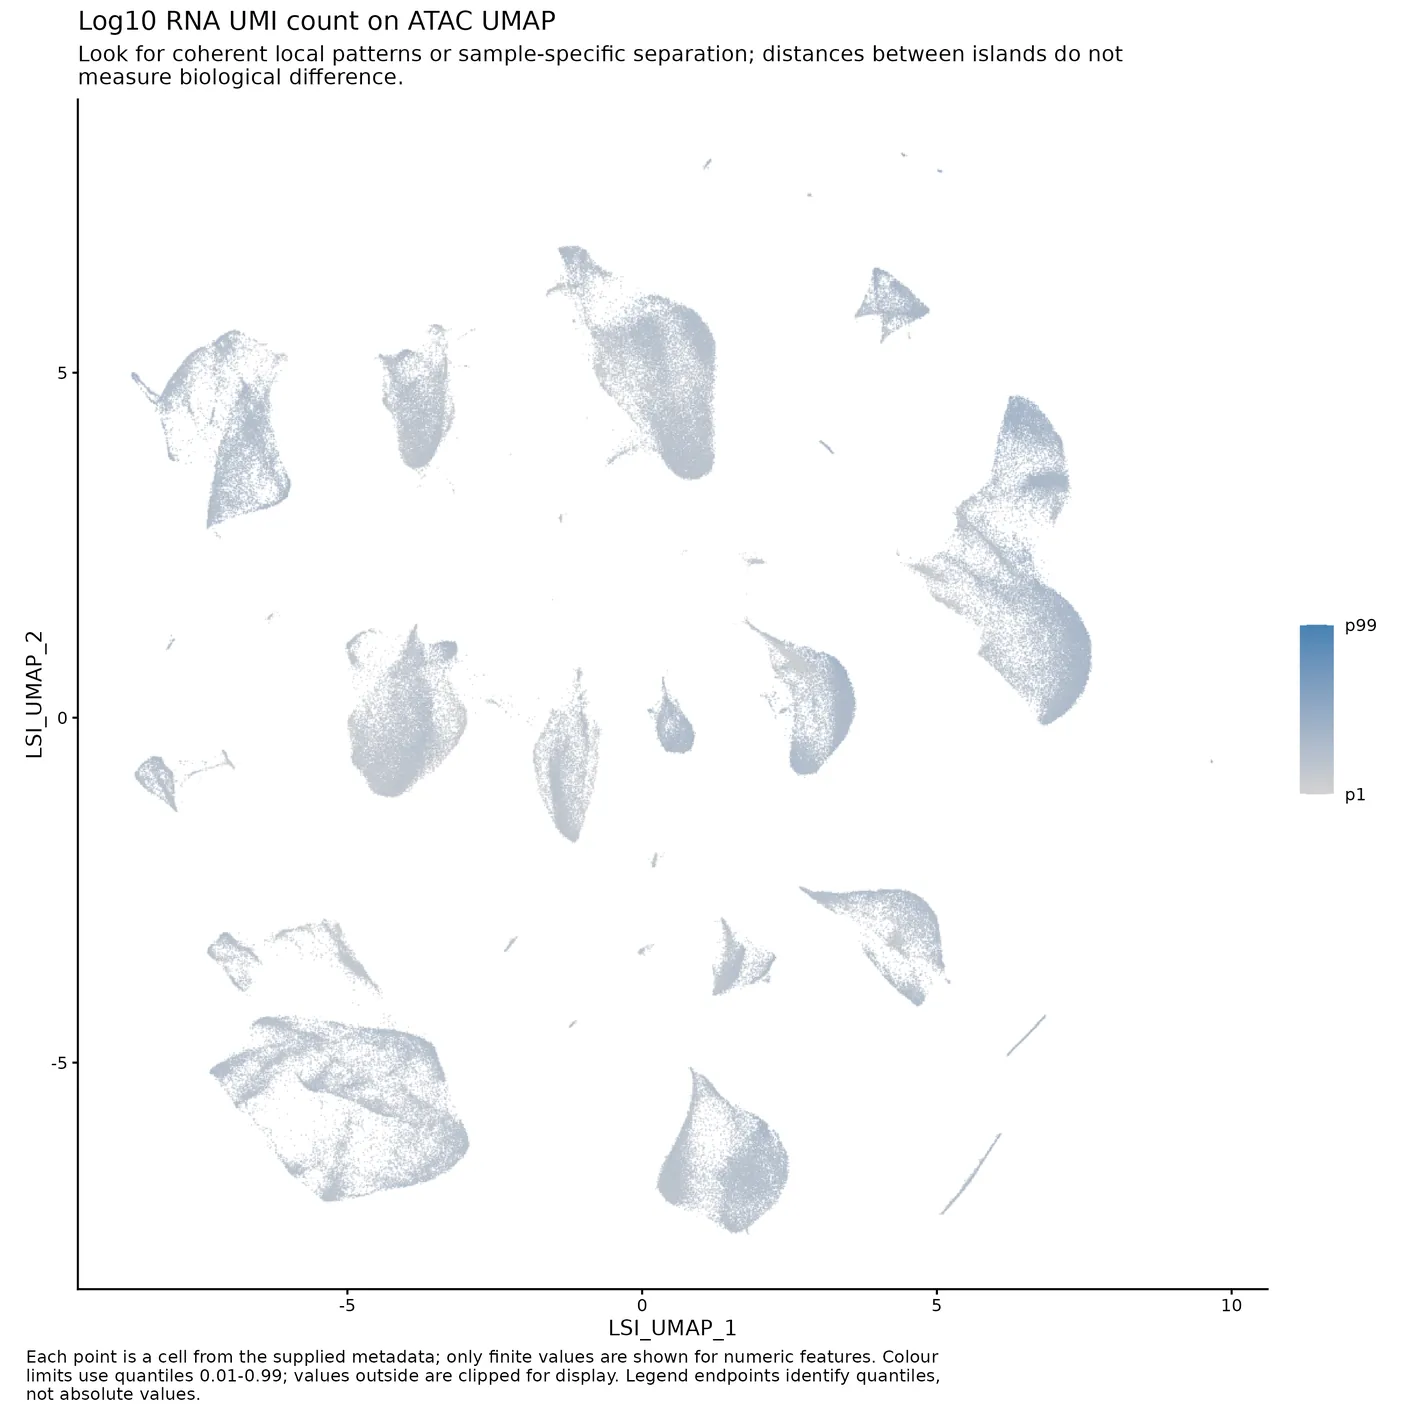
UMAPs colored by continuous motif-family accessibility and peak accessibility metrics. continuous.UMAPs.7_ATAC_QC
8. WNN integration
Faceted WNN adjusted GEX scores with matched background and the competition cutoff. cluster_UCell_advantage_plots.8_multimodal_QC
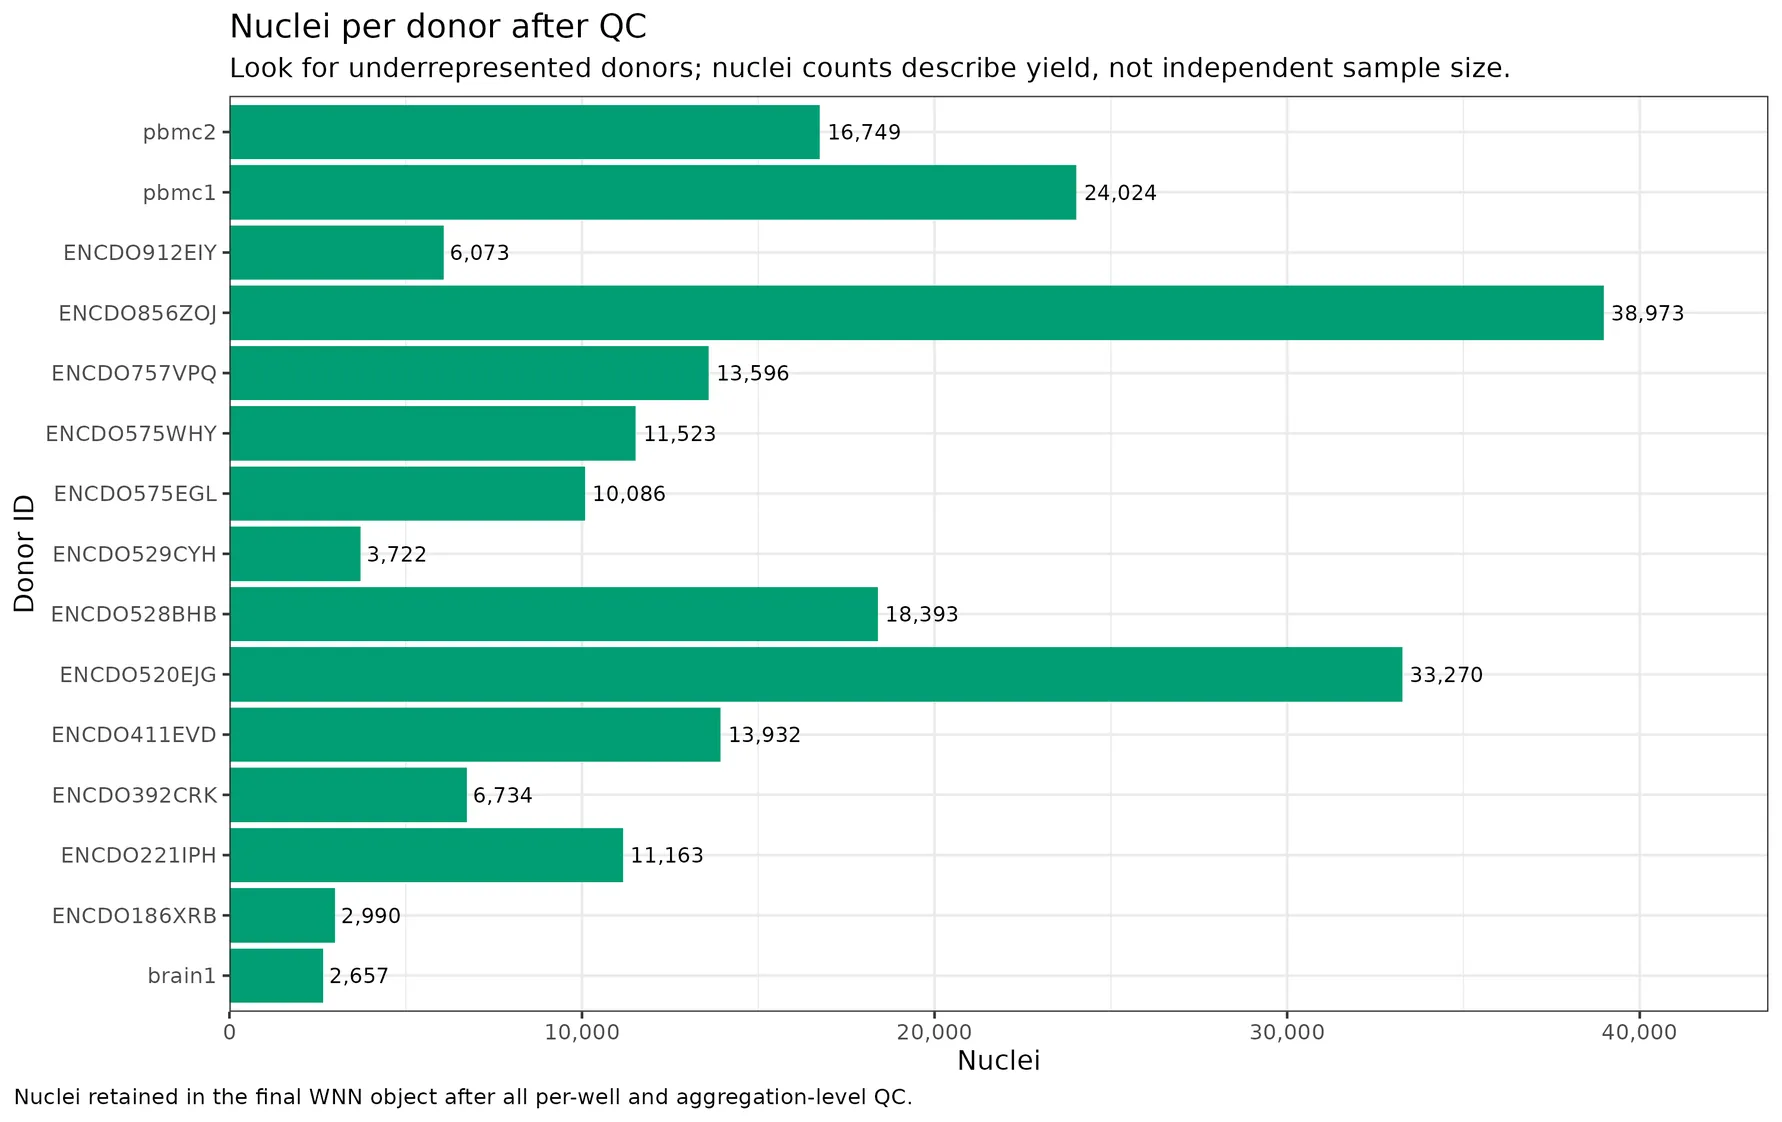
Plot the nuclei per donor that pass all QC into the final WNN object. nuclei_per_donor_id_bars.8_multimodal_QC
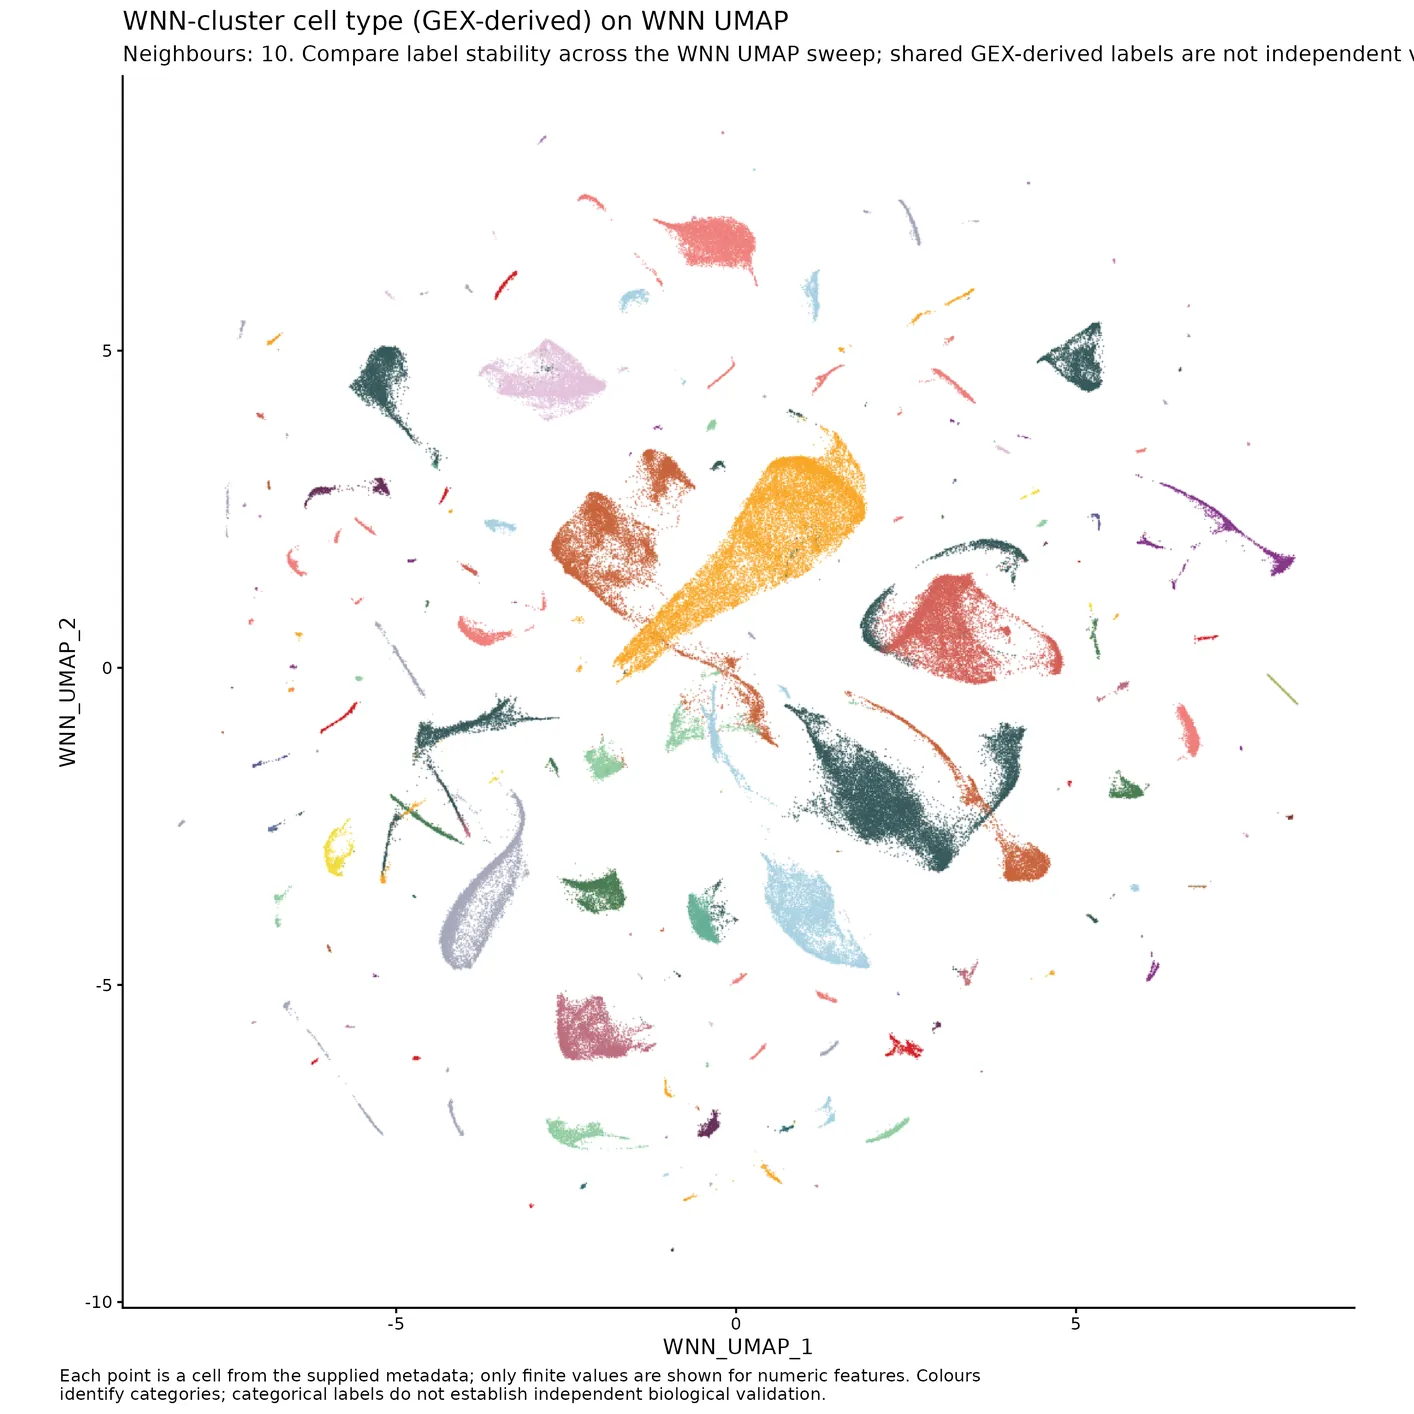
Plot WNN cell types on UMAPs across a sweep of nNN counts. cross.UMAPs.8_multimodal_QC
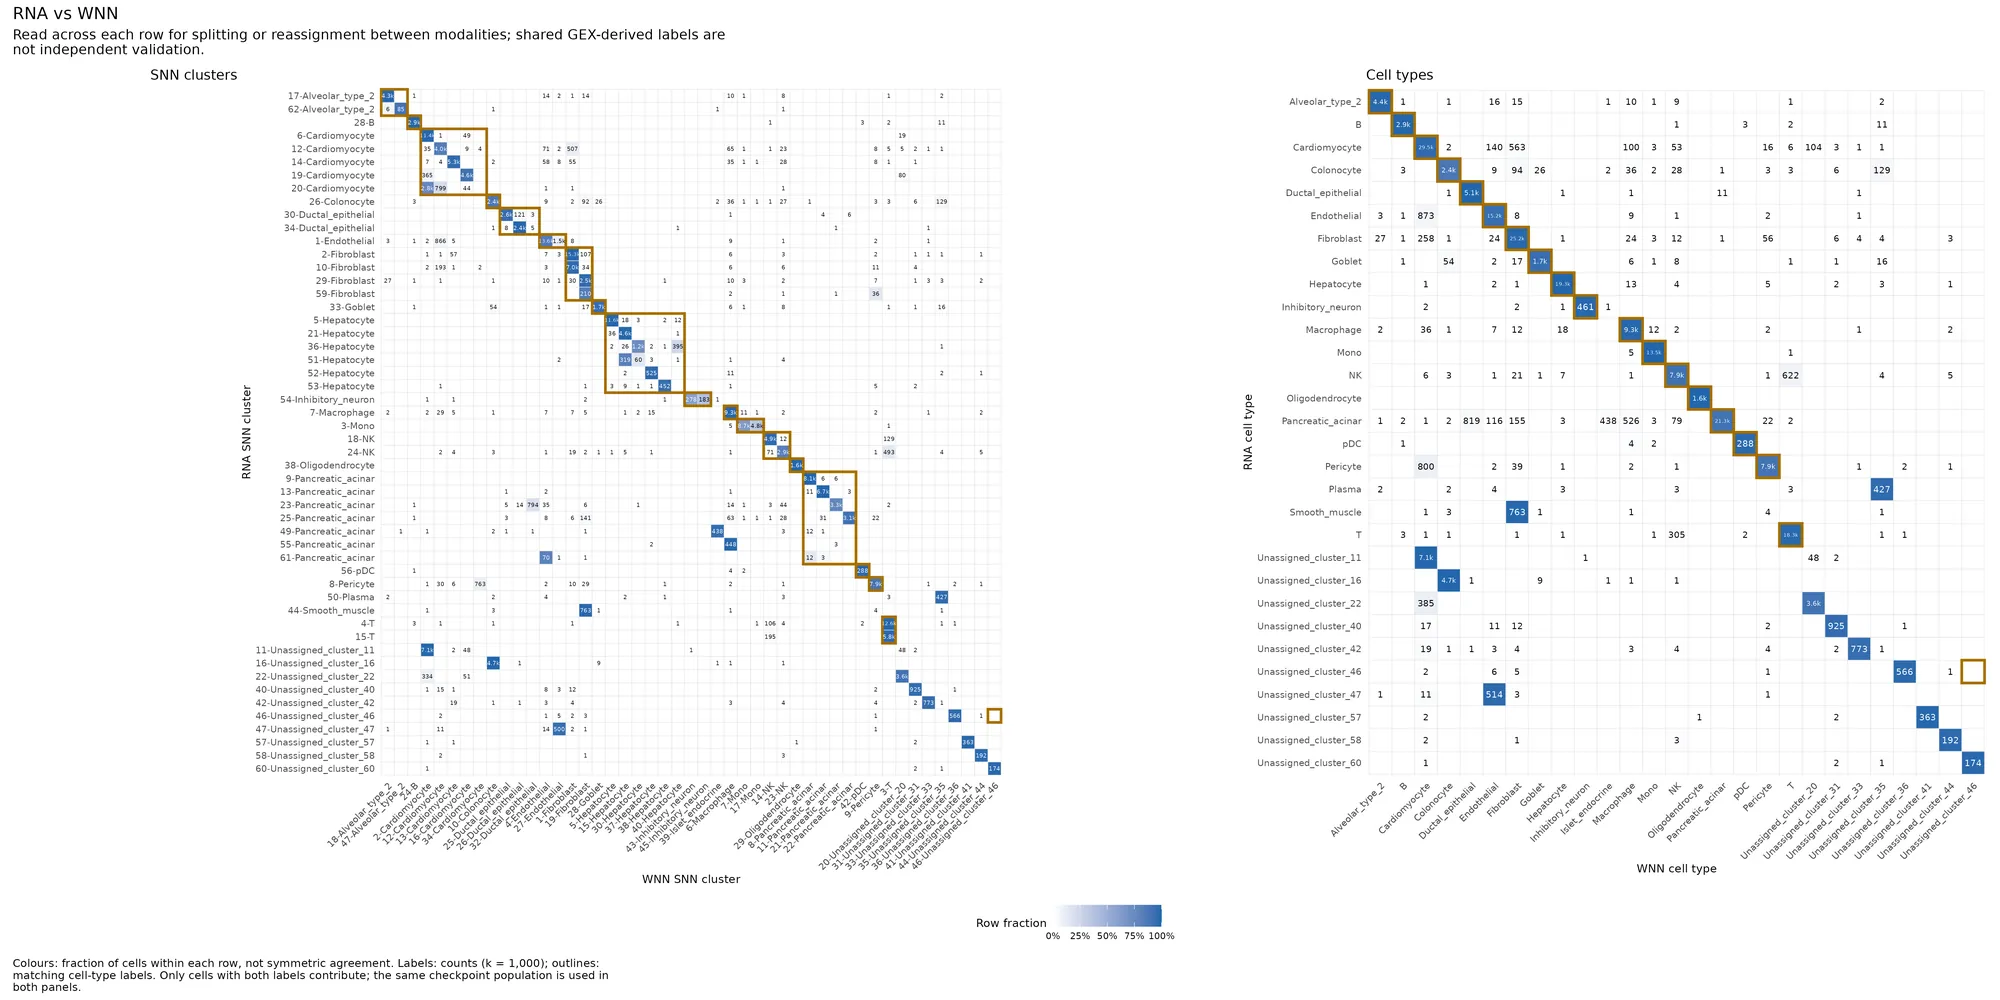
Paired RNA versus WNN and ATAC versus WNN confusion matrices for SNN clusters and cell types. confusion_matrices_plots.8_multimodal_QC
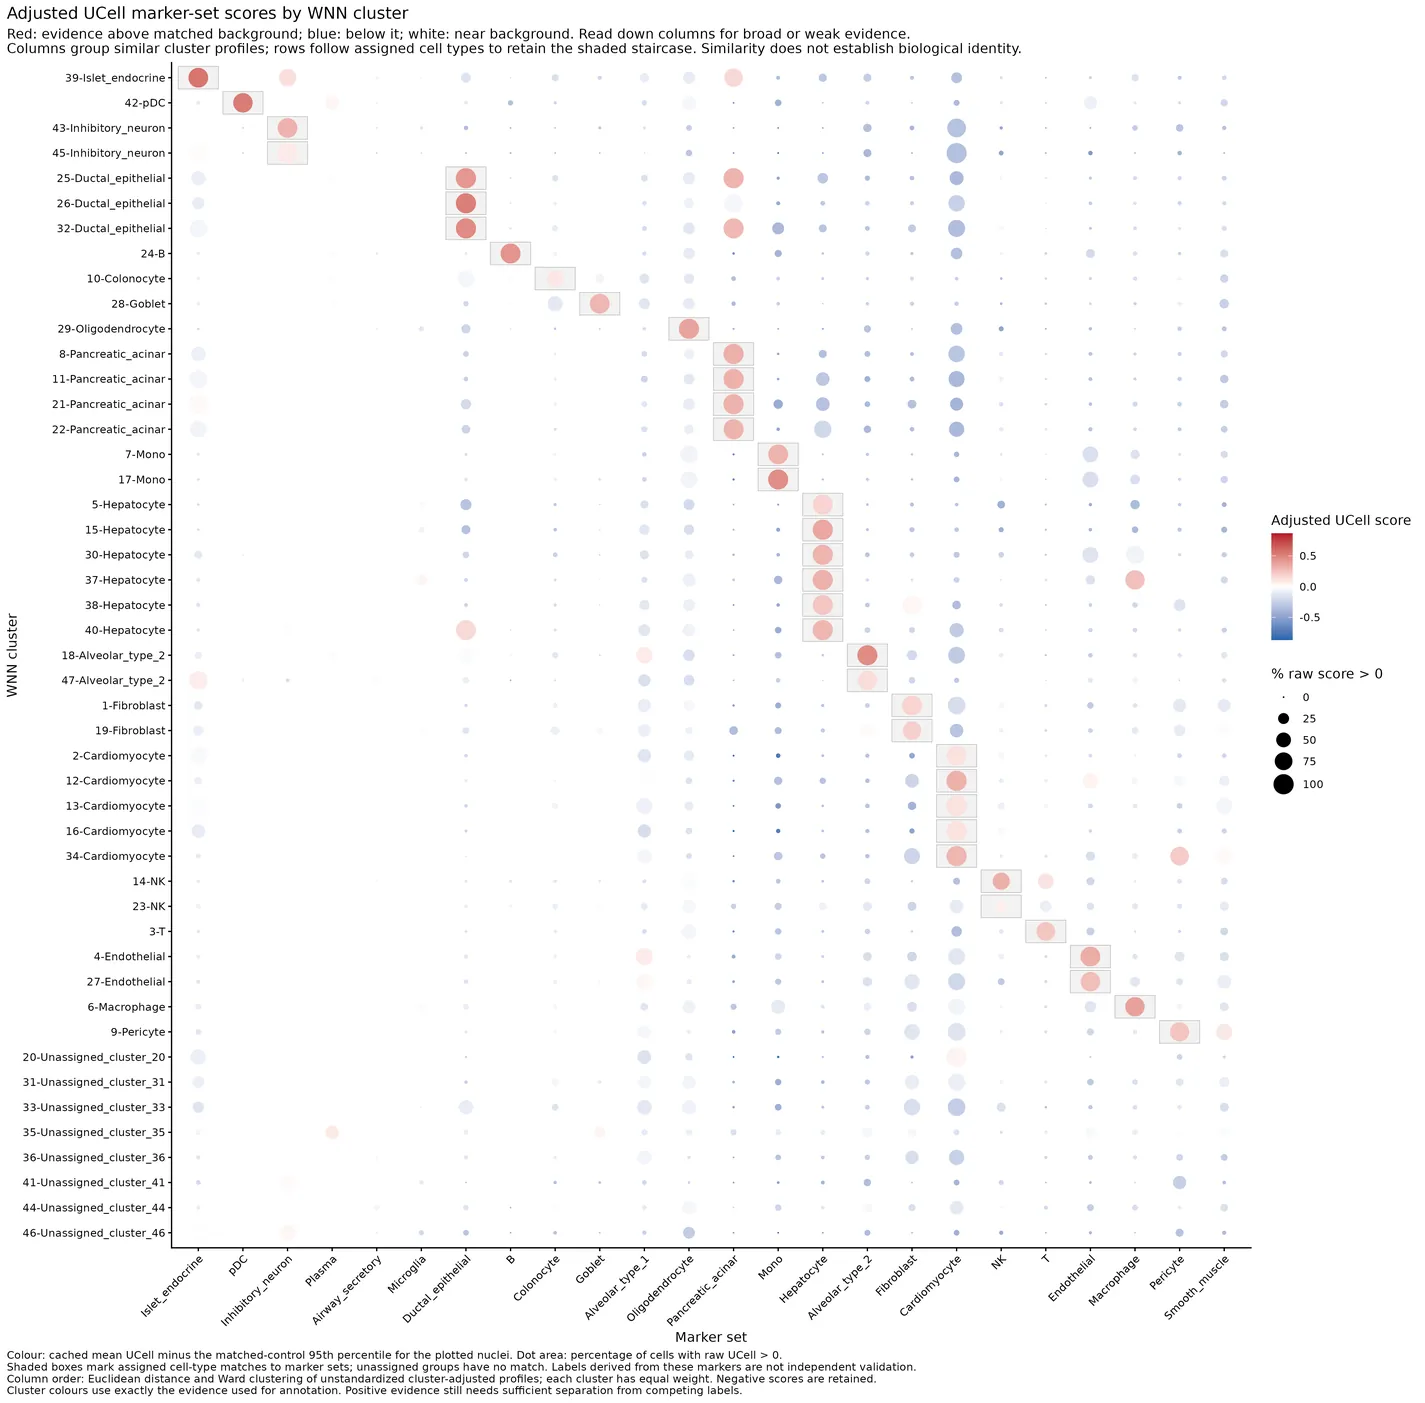
Cached adjusted GEX UCell evidence per WNN cluster, with distance-ordered marker sets. module_scores_by_cluster_dot_plot.8_multimodal_QC
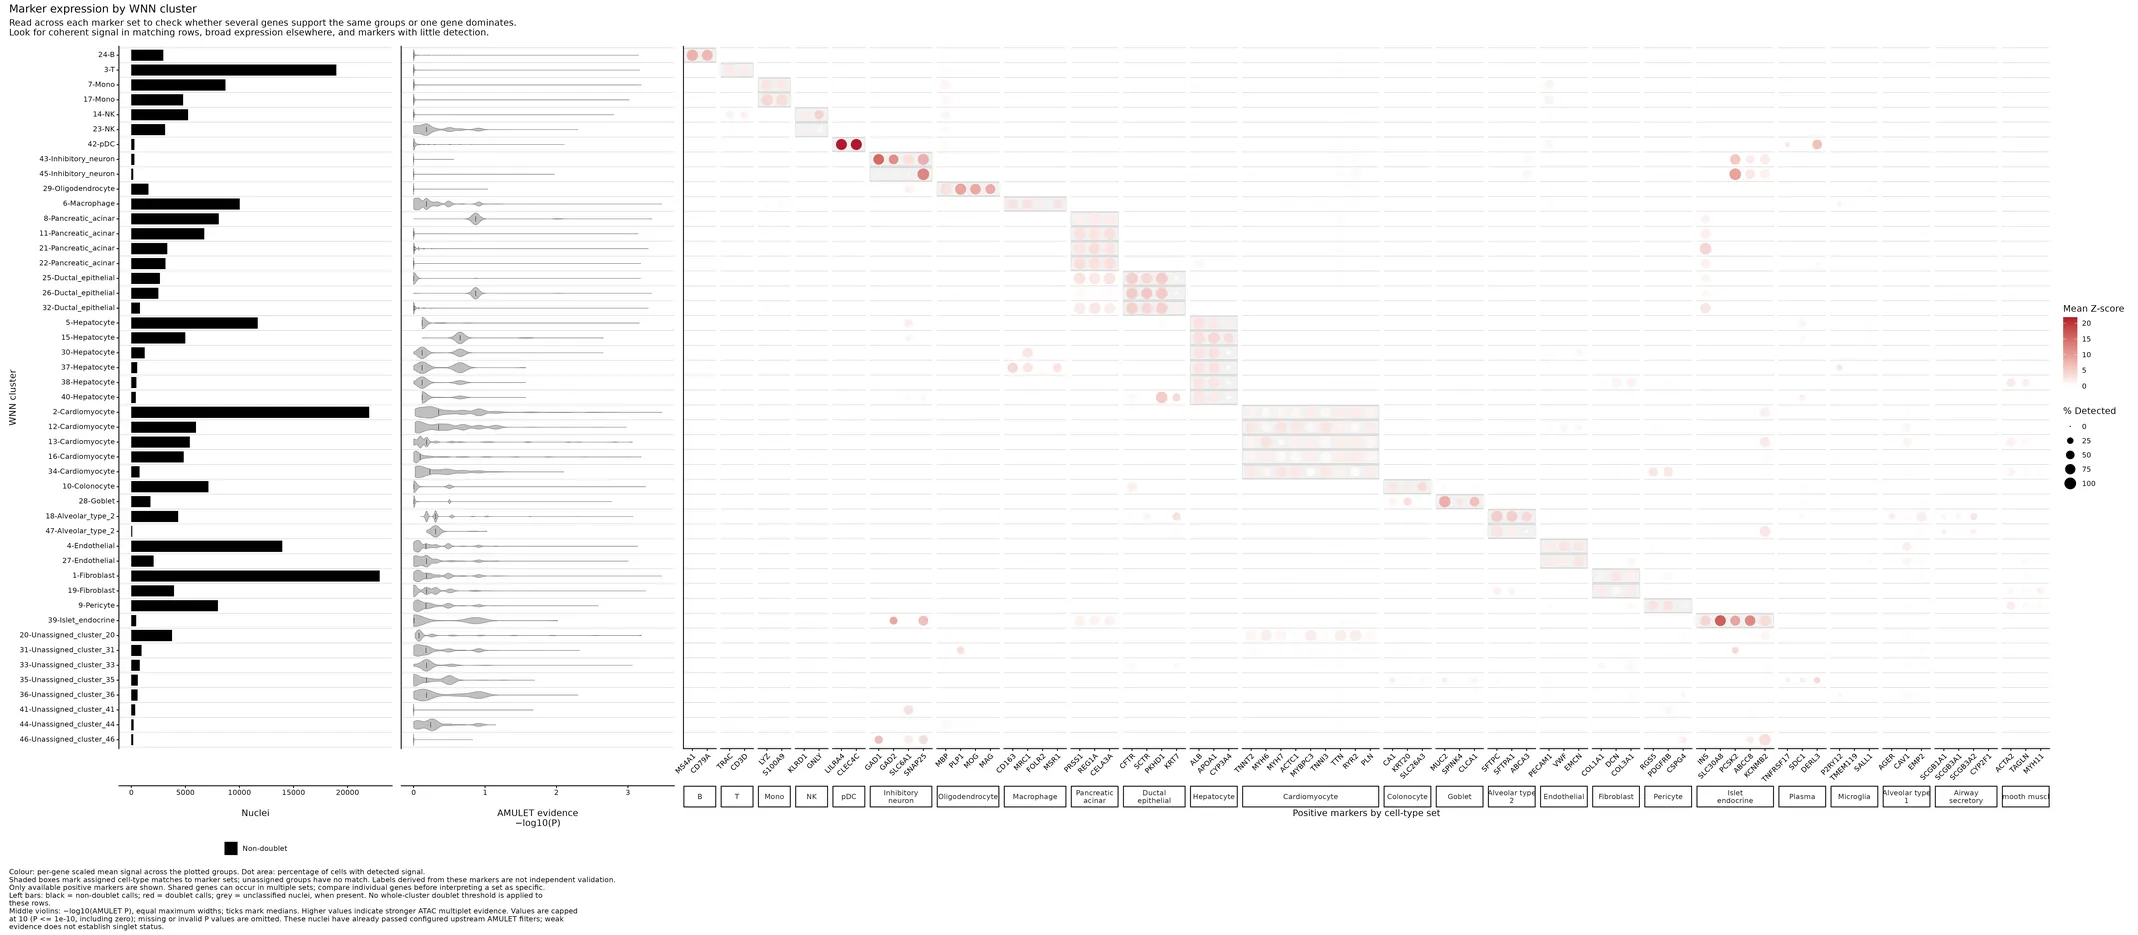
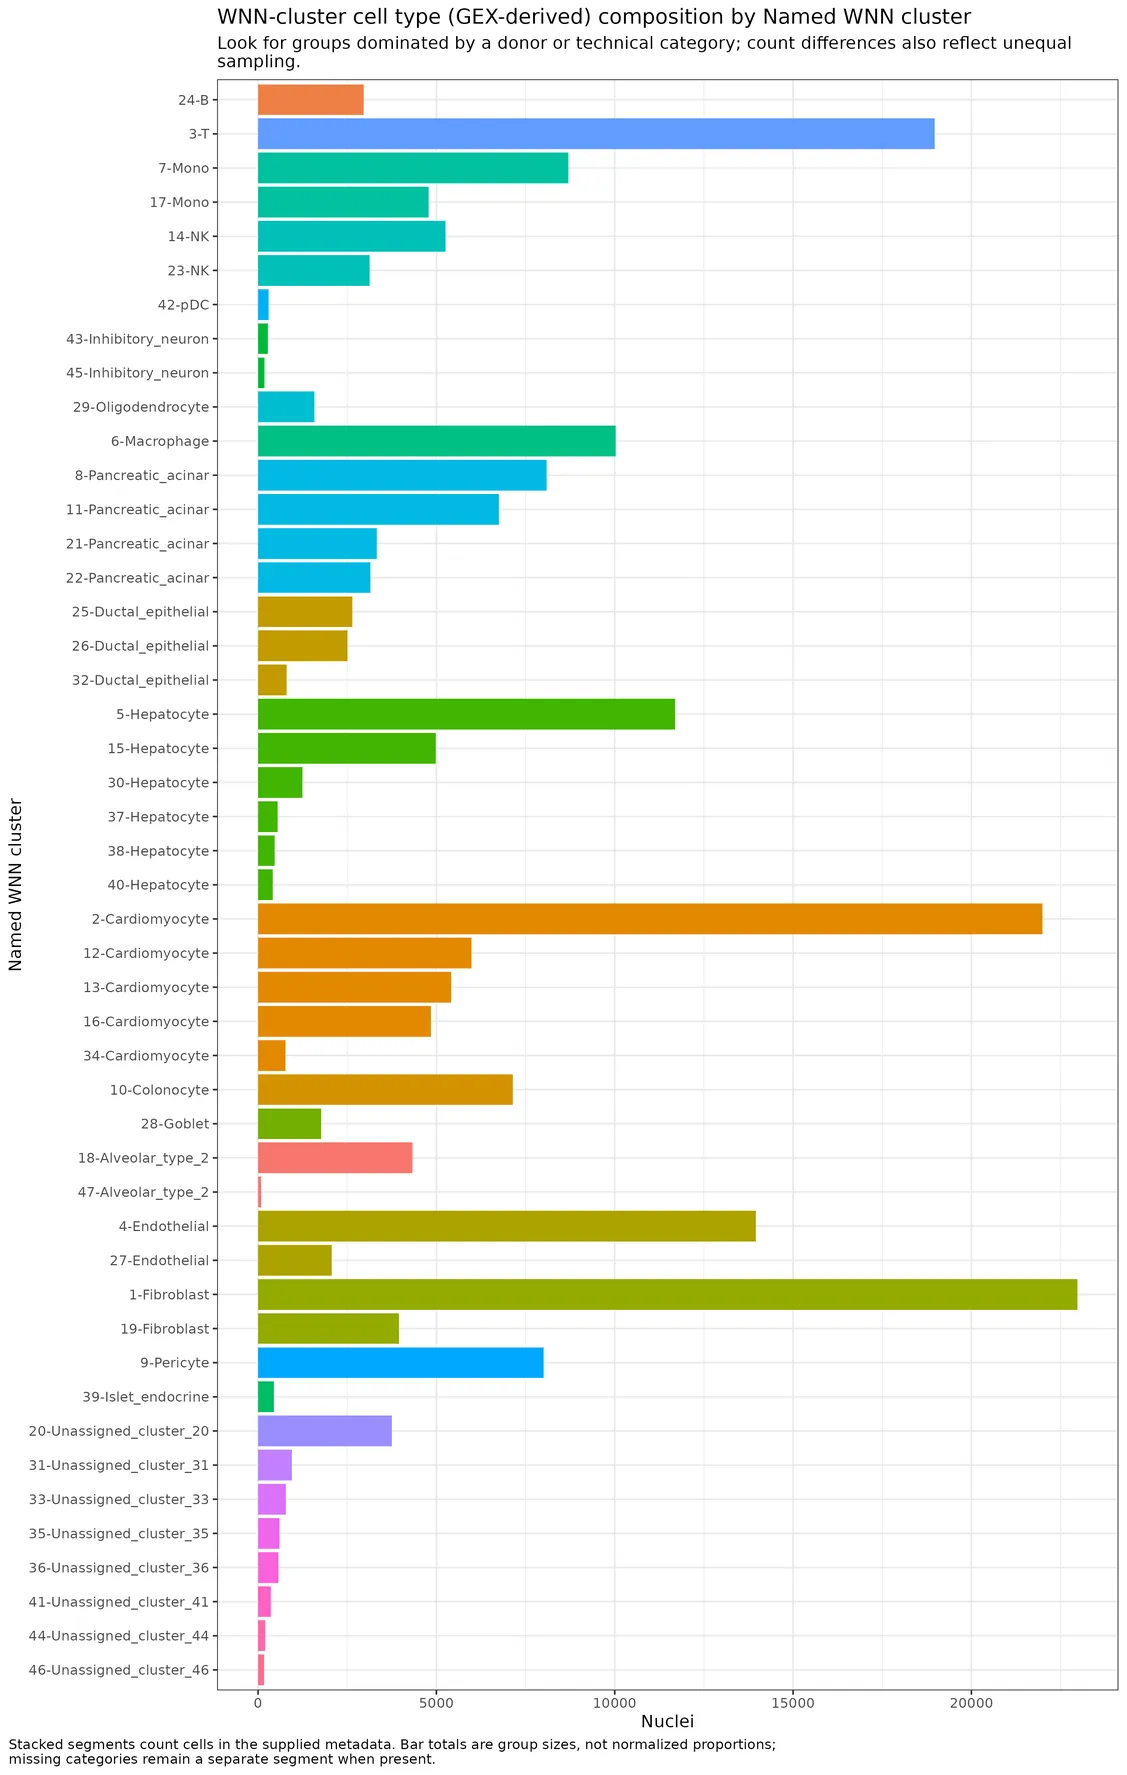
GEX marker expression per named WNN cluster, with nuclei counts and doublet evidence for retained WNN nuclei. markers_by_cluster_dot_plot.8_multimodal_QC
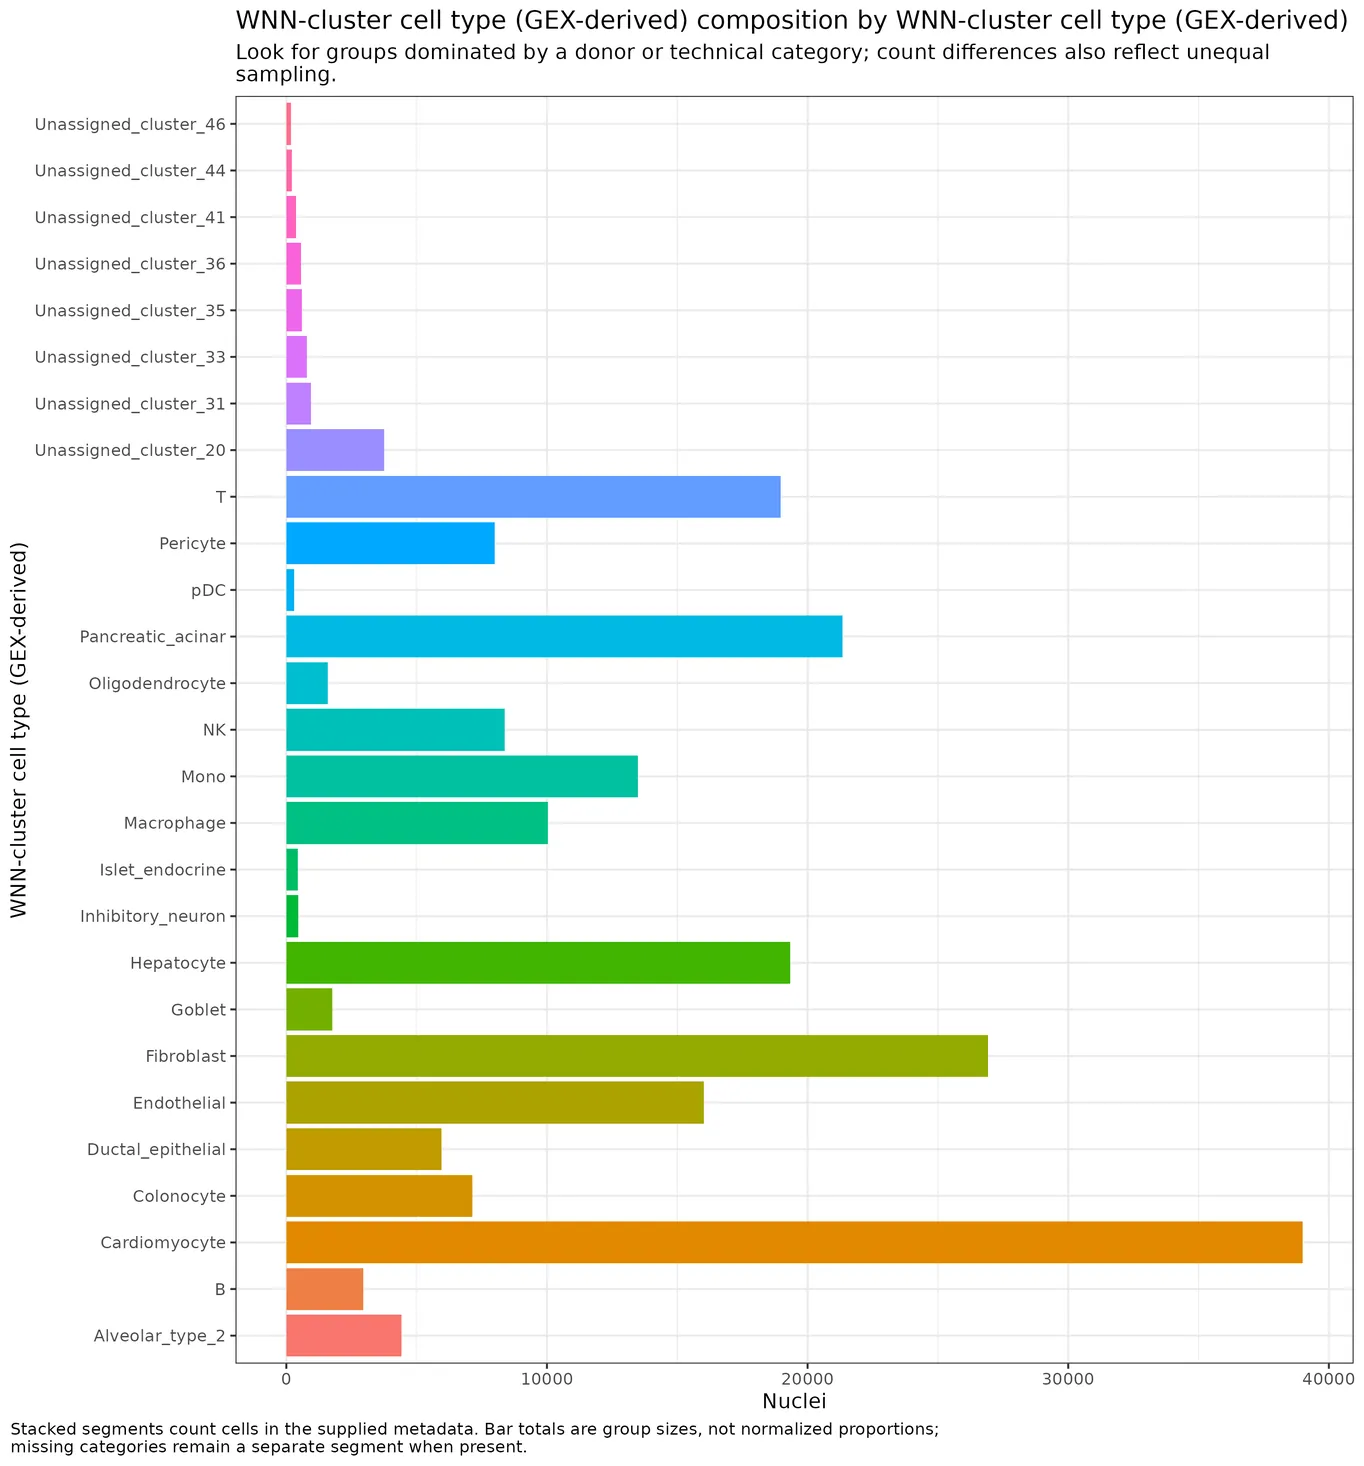
Bar plots of categorical metadata composition per cell type among all WNN nuclei. categorical_by_cell_type_bars_plots.8_multimodal_QC
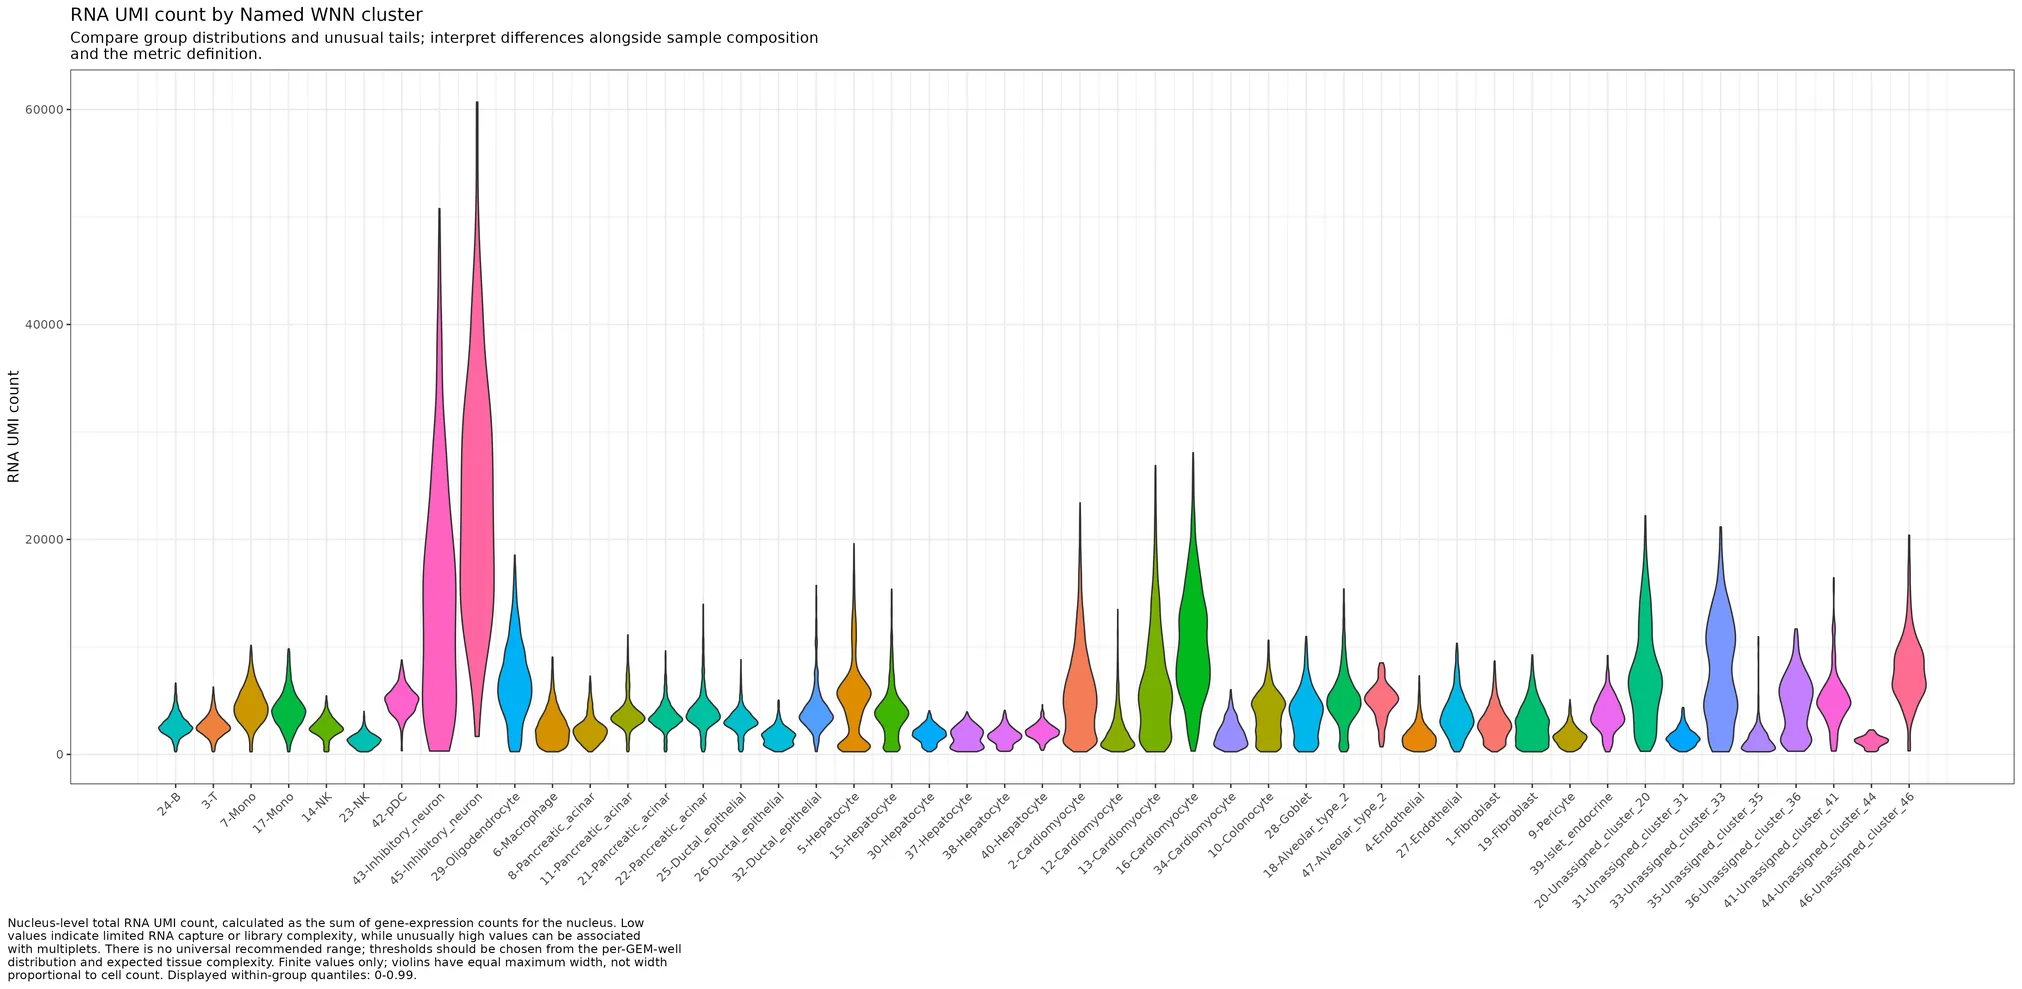
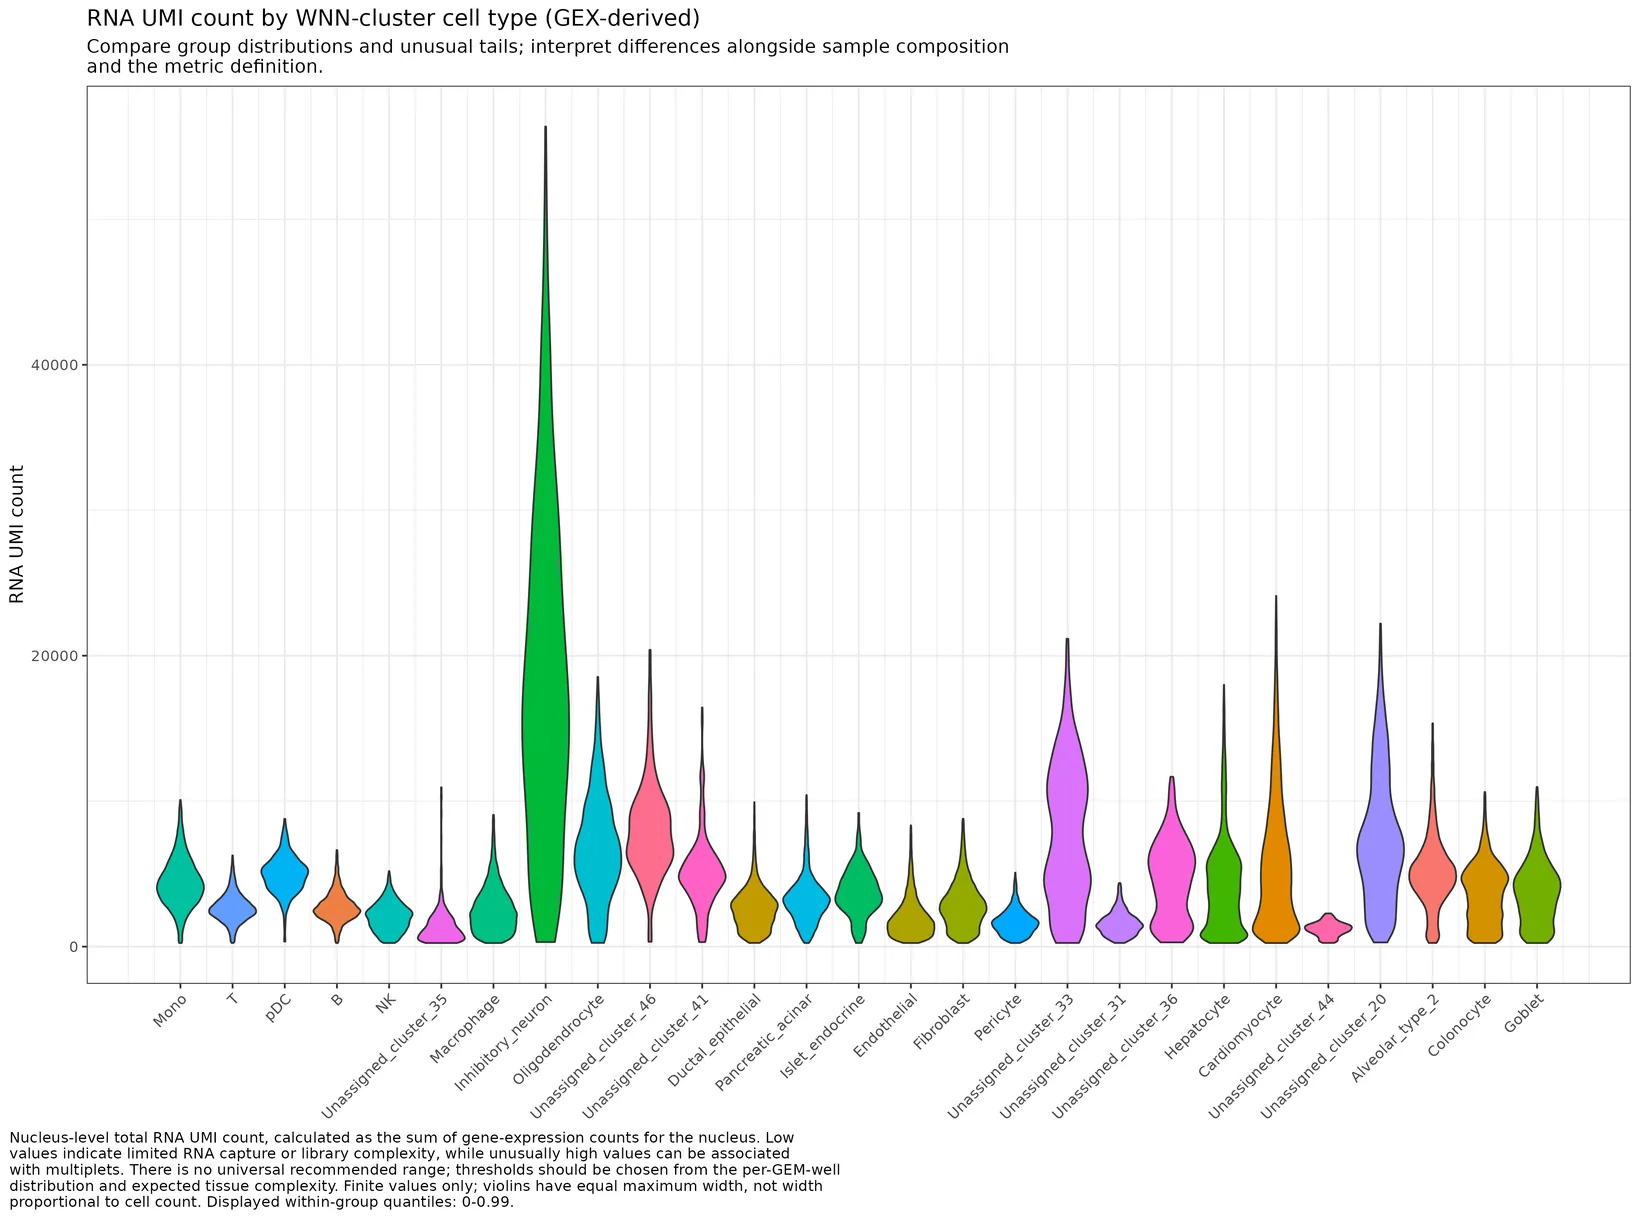
Violin plots of continuous QC and cell-cycle features per SNN cluster among all WNN nuclei. continuous_by_cluster_violin_plot.8_multimodal_QC
Bar plots of categorical metadata composition per SNN cluster among all WNN nuclei. categorical_by_cluster_bars_plots.8_multimodal_QC
Violin plots of continuous QC and cell-cycle features per cell type among all WNN nuclei. continuous_by_cell_type_violin_plot.8_multimodal_QC
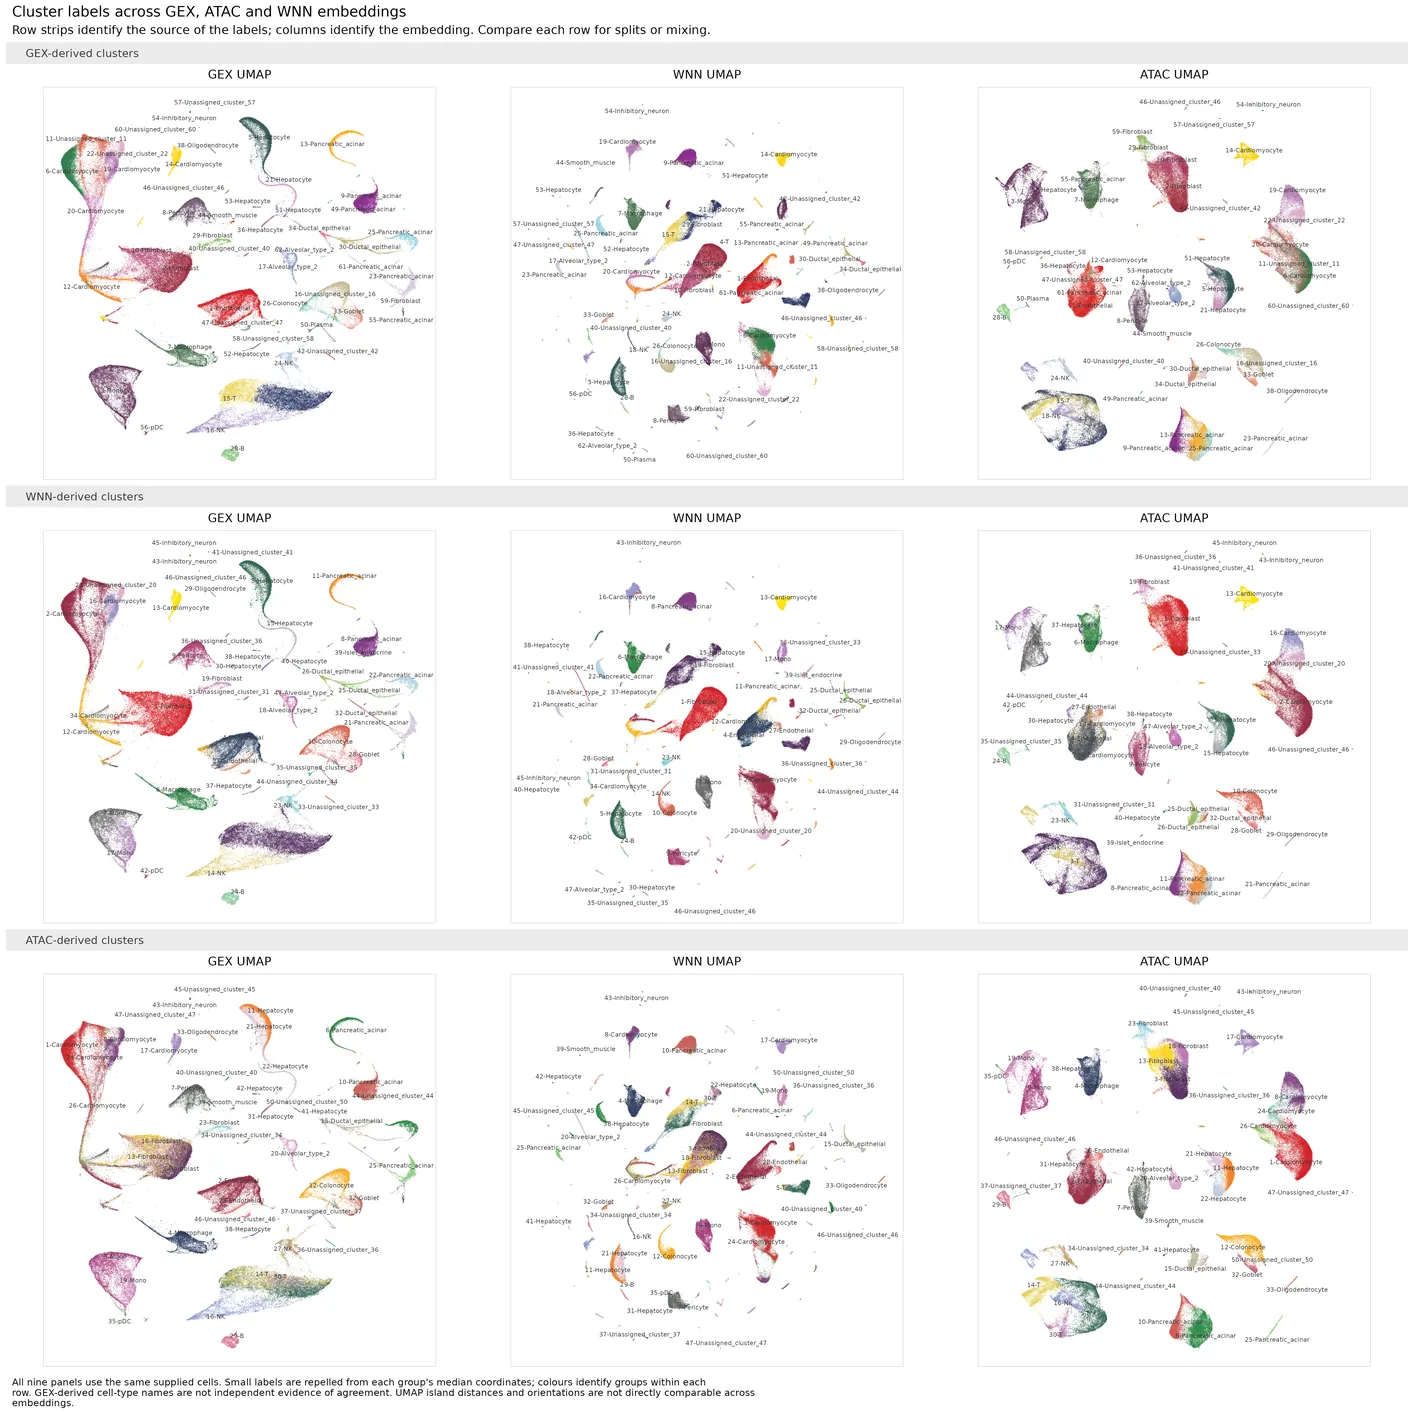
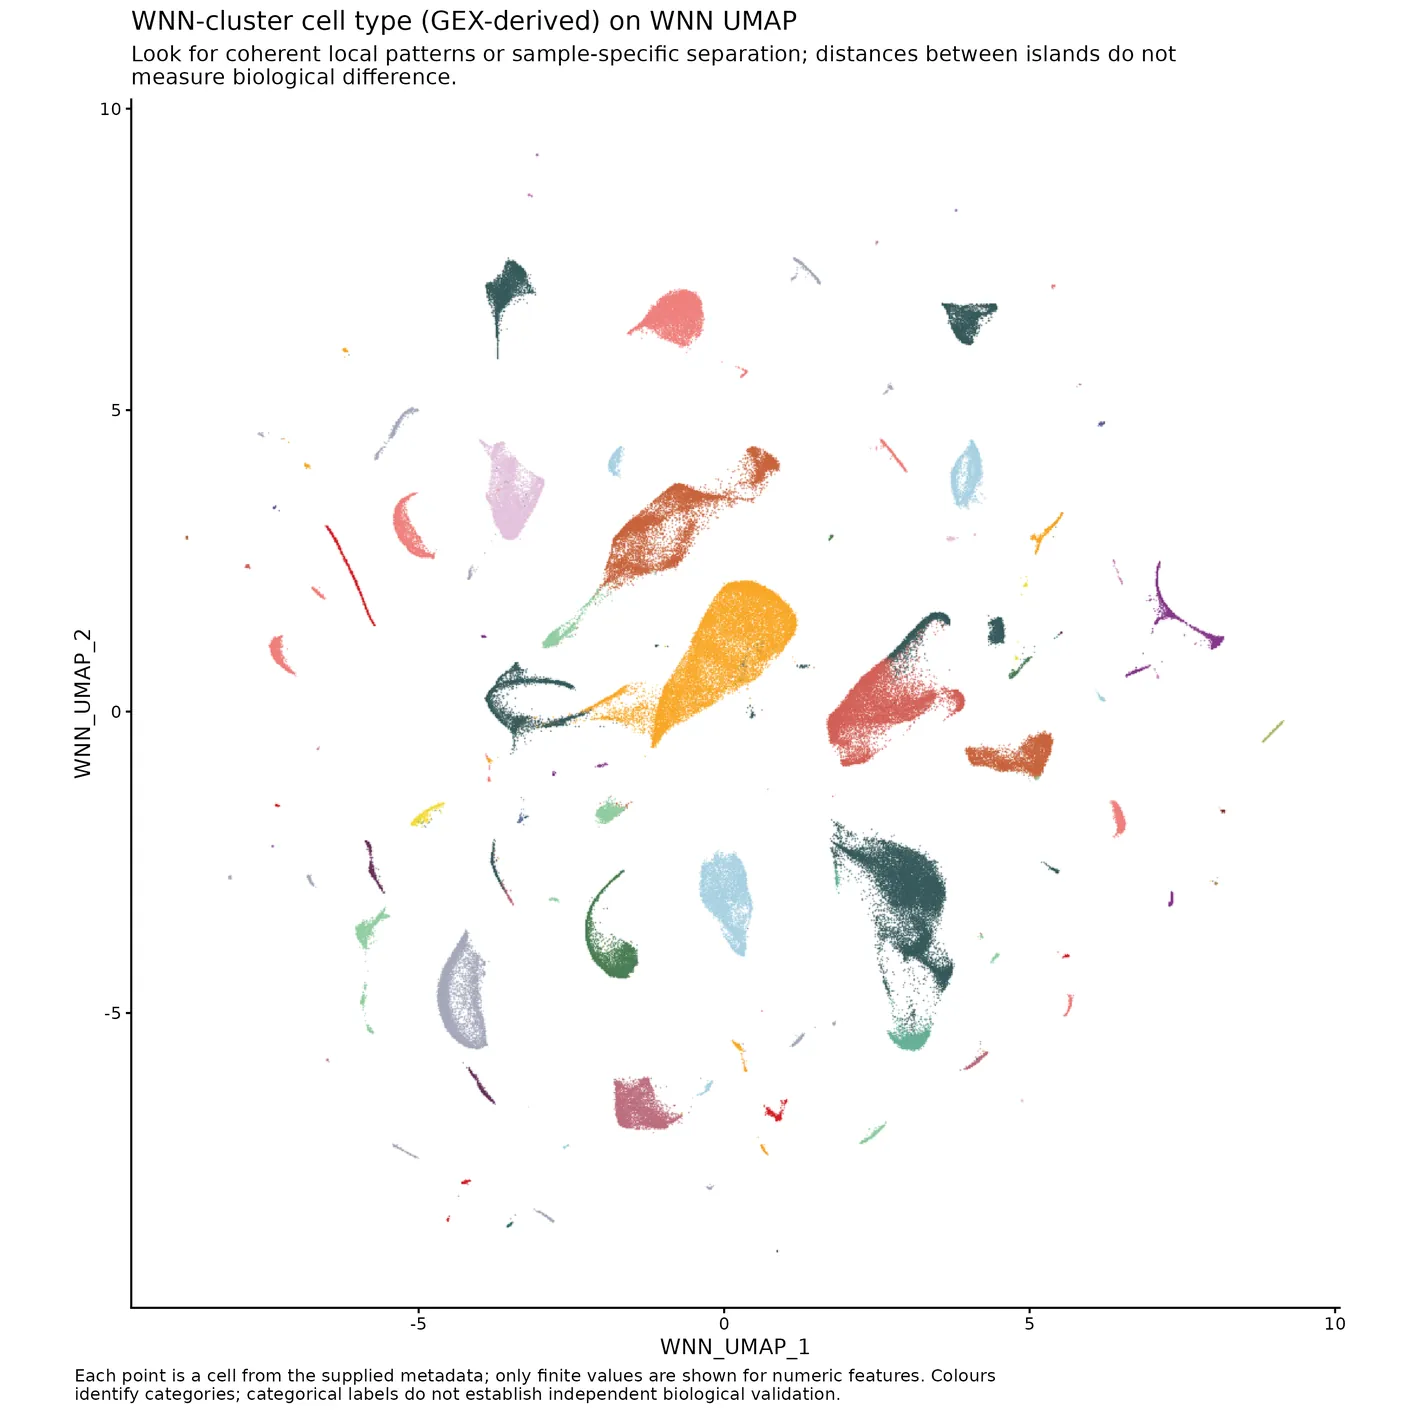
3×3 grid of UMAPs with cell-type-named cluster-level identities. cluster_named_dim_tri_plot.UMAPs.8_multimodal_QC
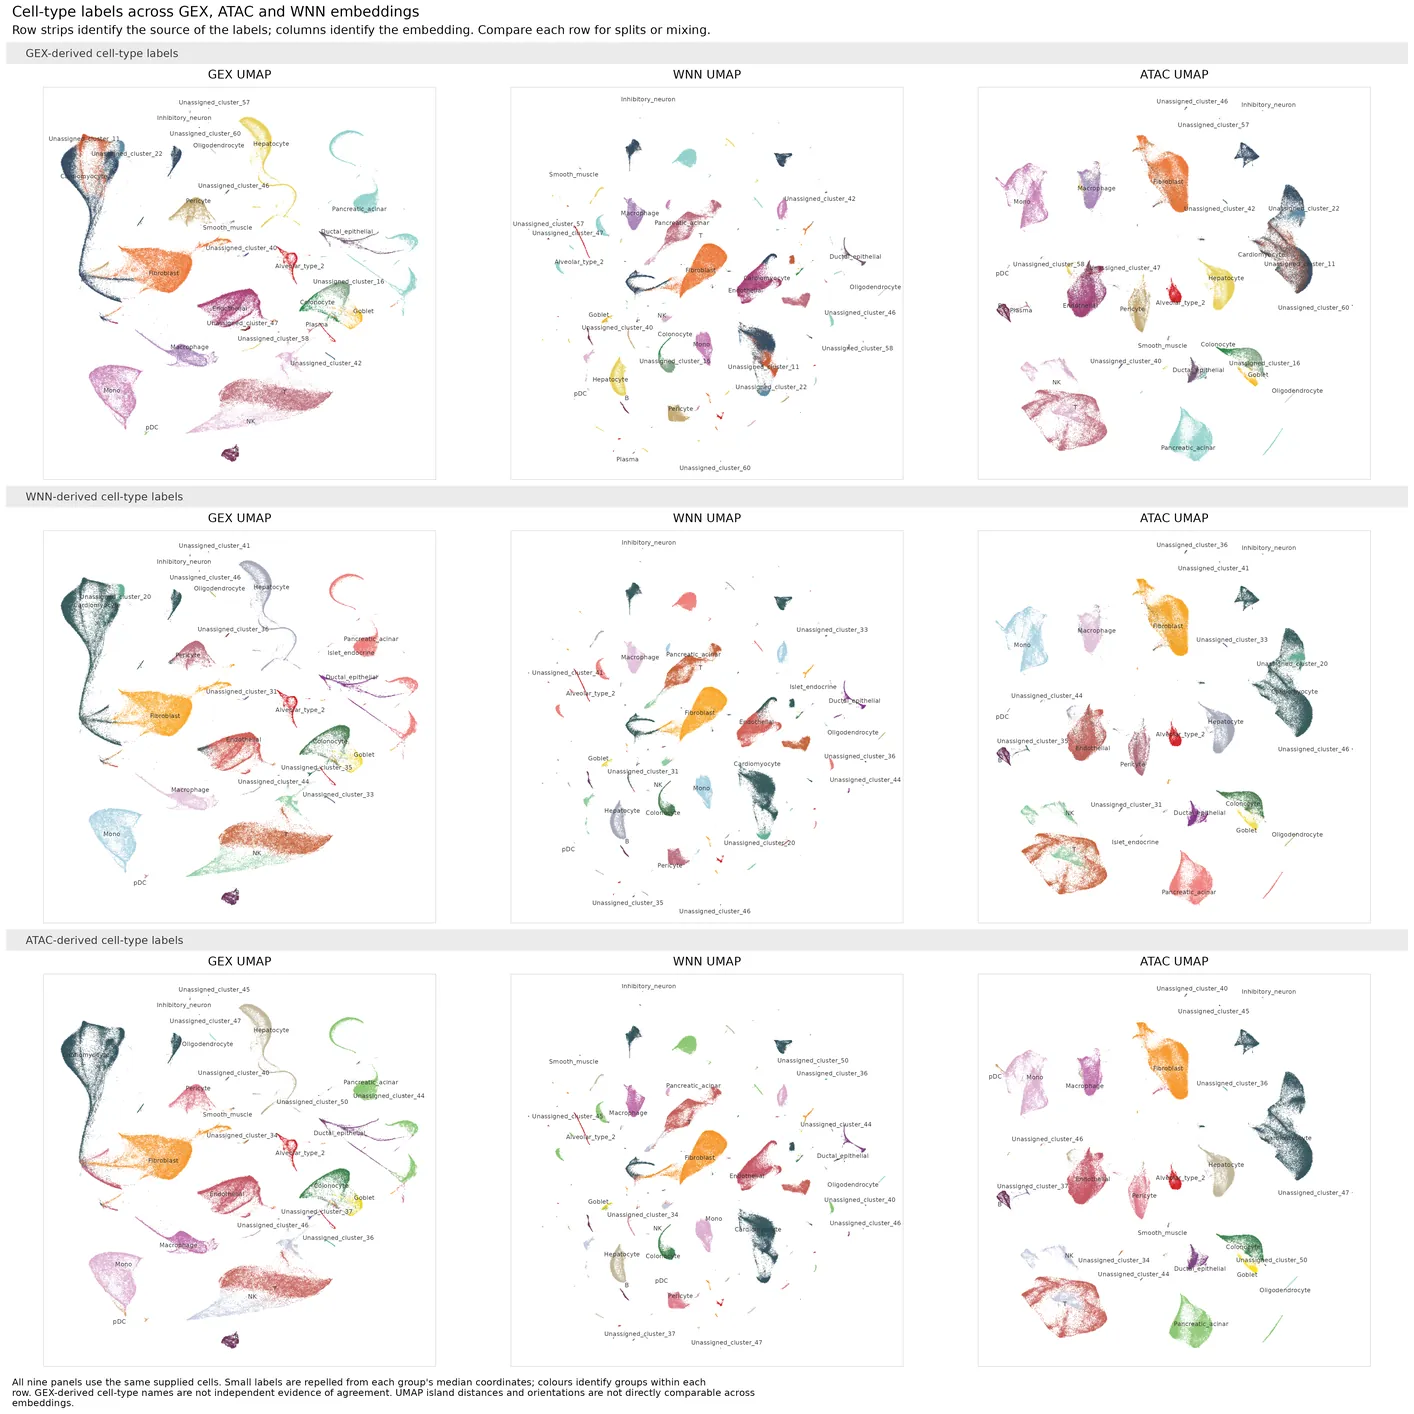
3×3 grid of UMAPs with cell-type identities. cluster_cell_type_dim_tri_plot.UMAPs.8_multimodal_QC
UMAPs colored by categorical metadata variables on the WNN embedding. categorical.UMAPs.8_multimodal_QC
Plot cumulative nuclei retention through final WNN QC. cell_retention_flow_plot.8_multimodal_QC
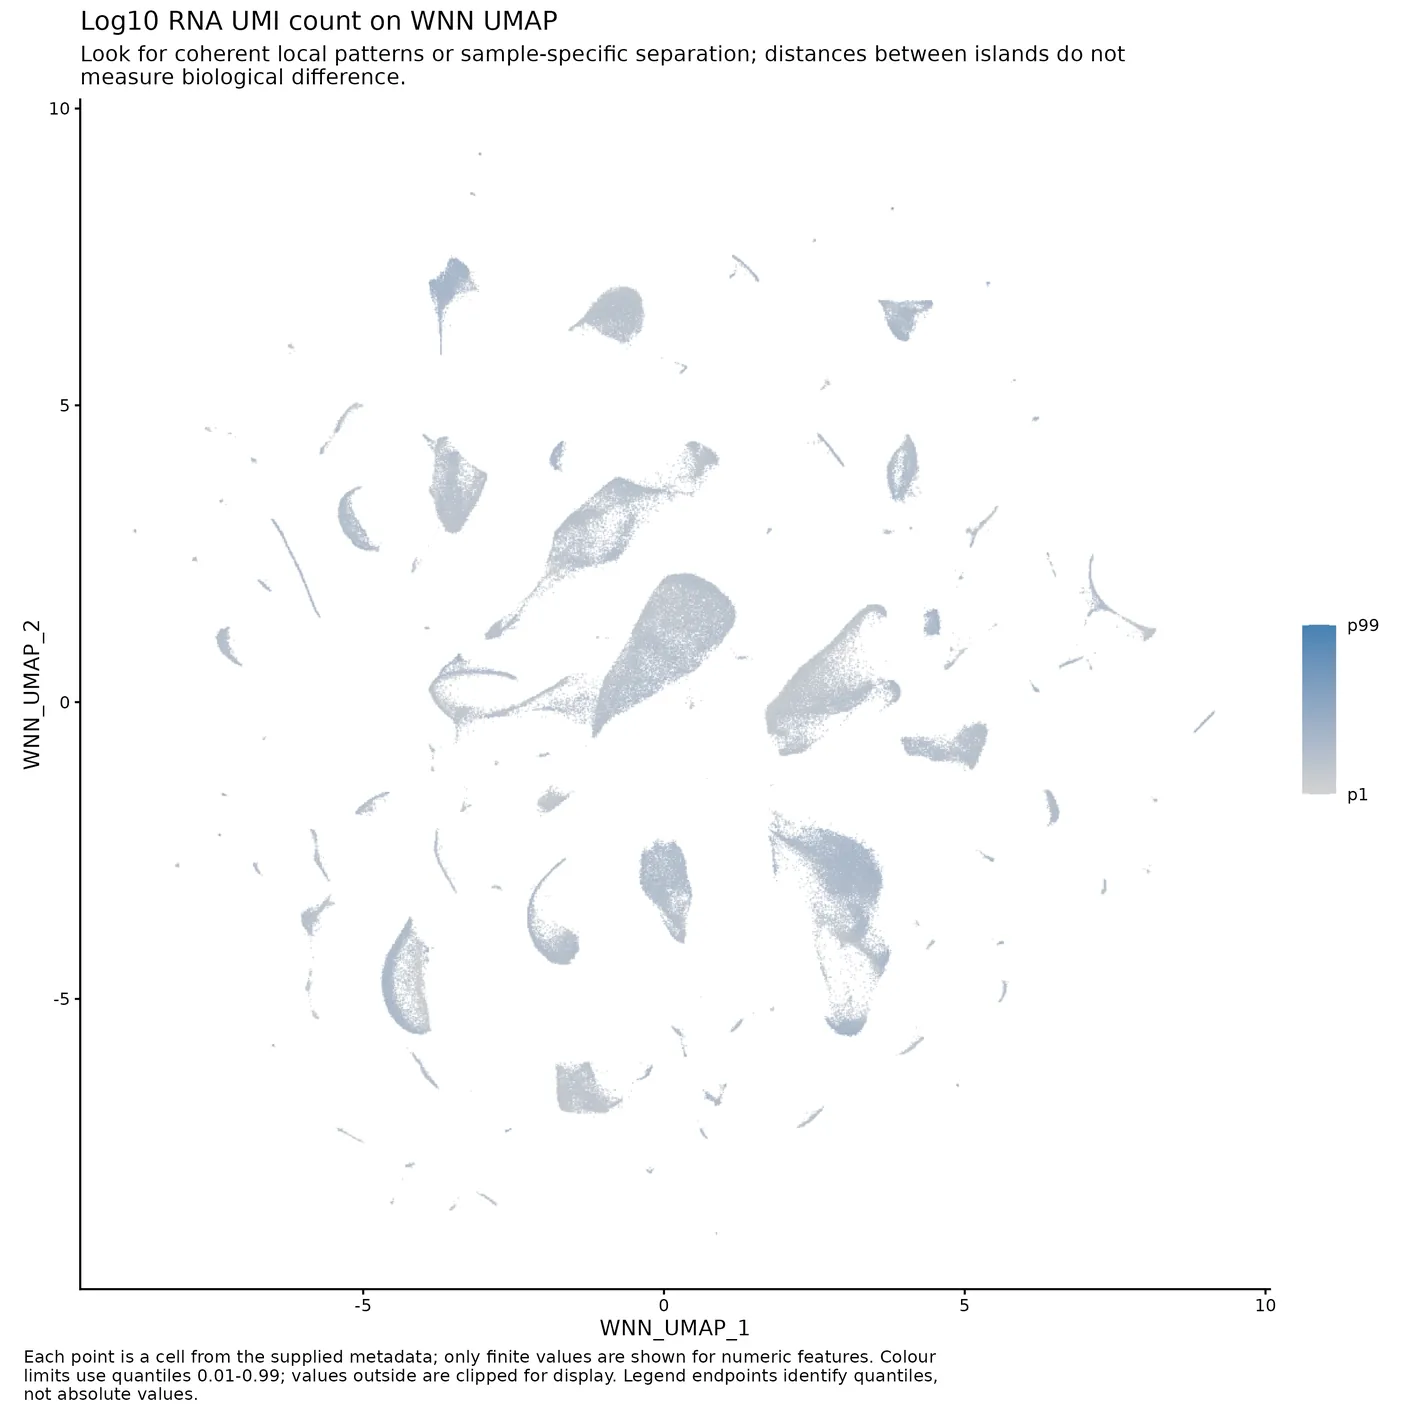
UMAPs colored by continuous QC and gene expression features on the WNN embedding. continuous.UMAPs.8_multimodal_QC
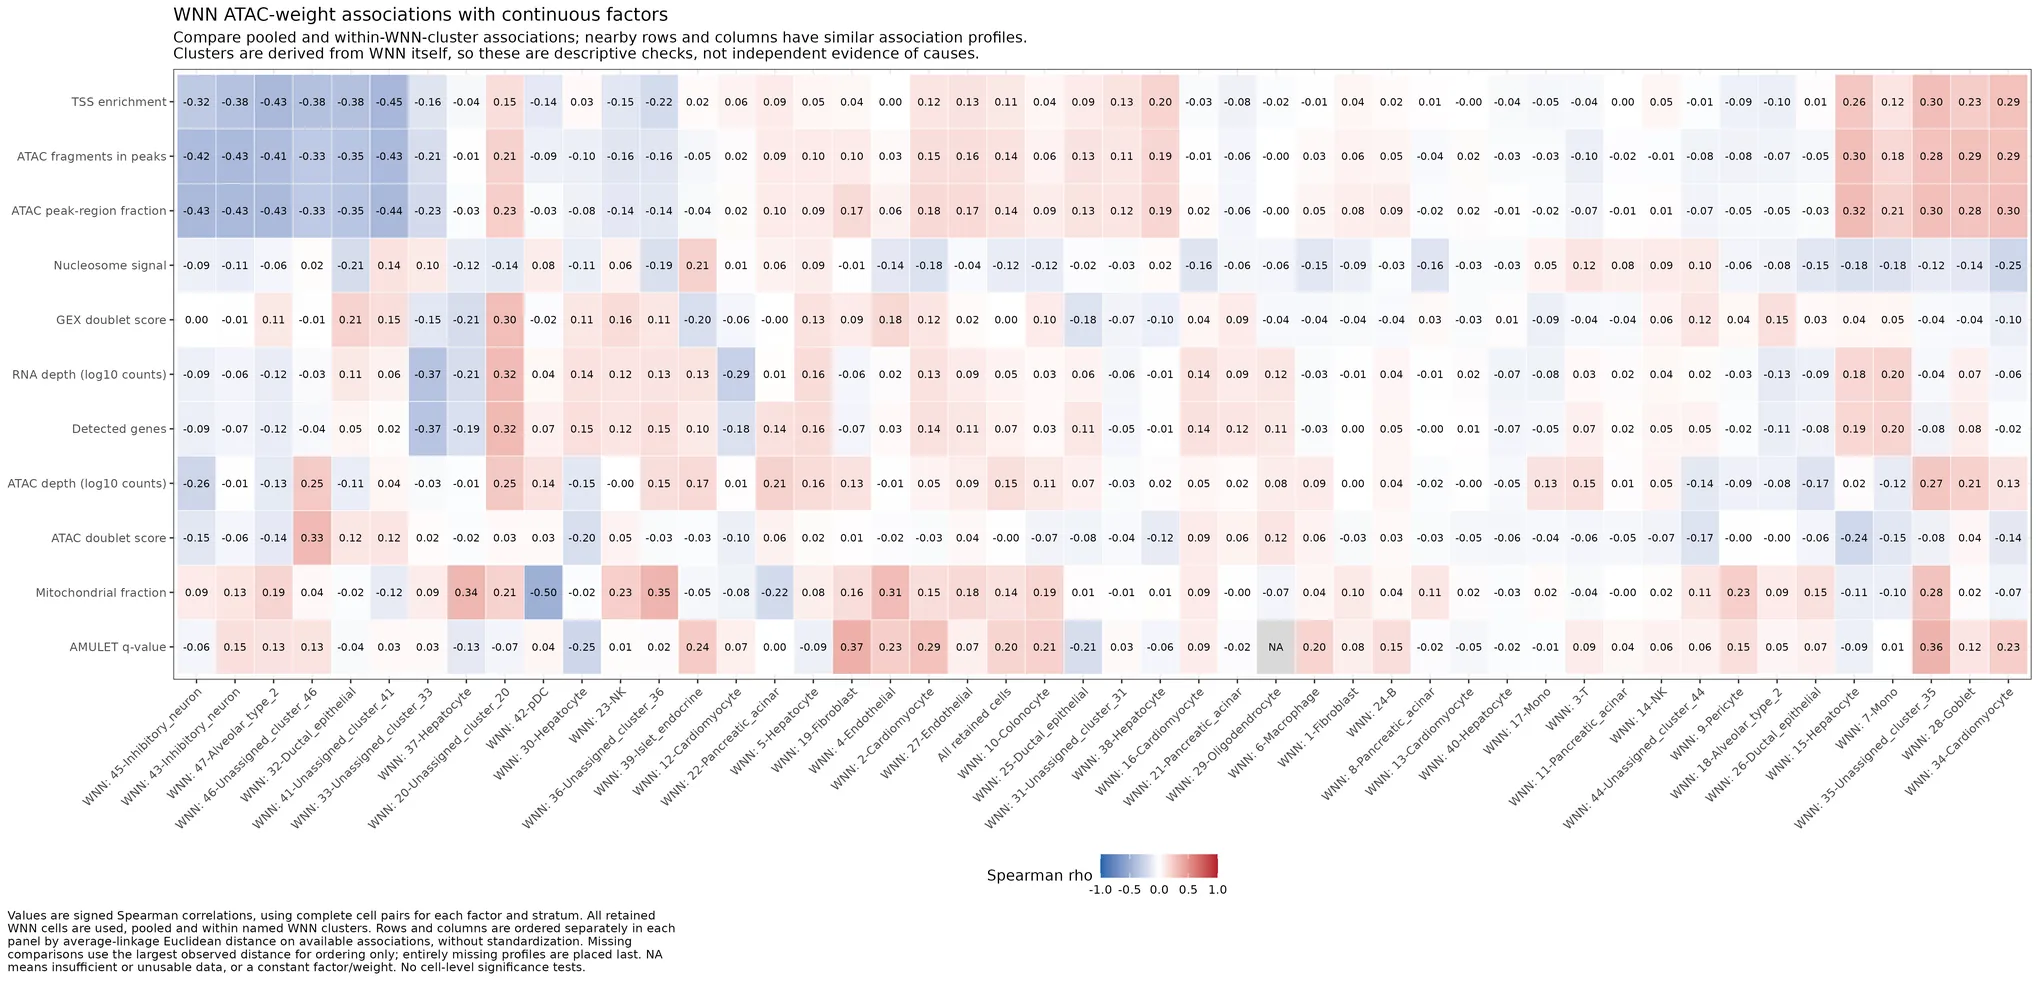
Plot continuous and categorical WNN-weight associations pooled and within named WNN clusters. WNN_weight_metadata_associations_plot.8_multimodal_QC
Differential analyses
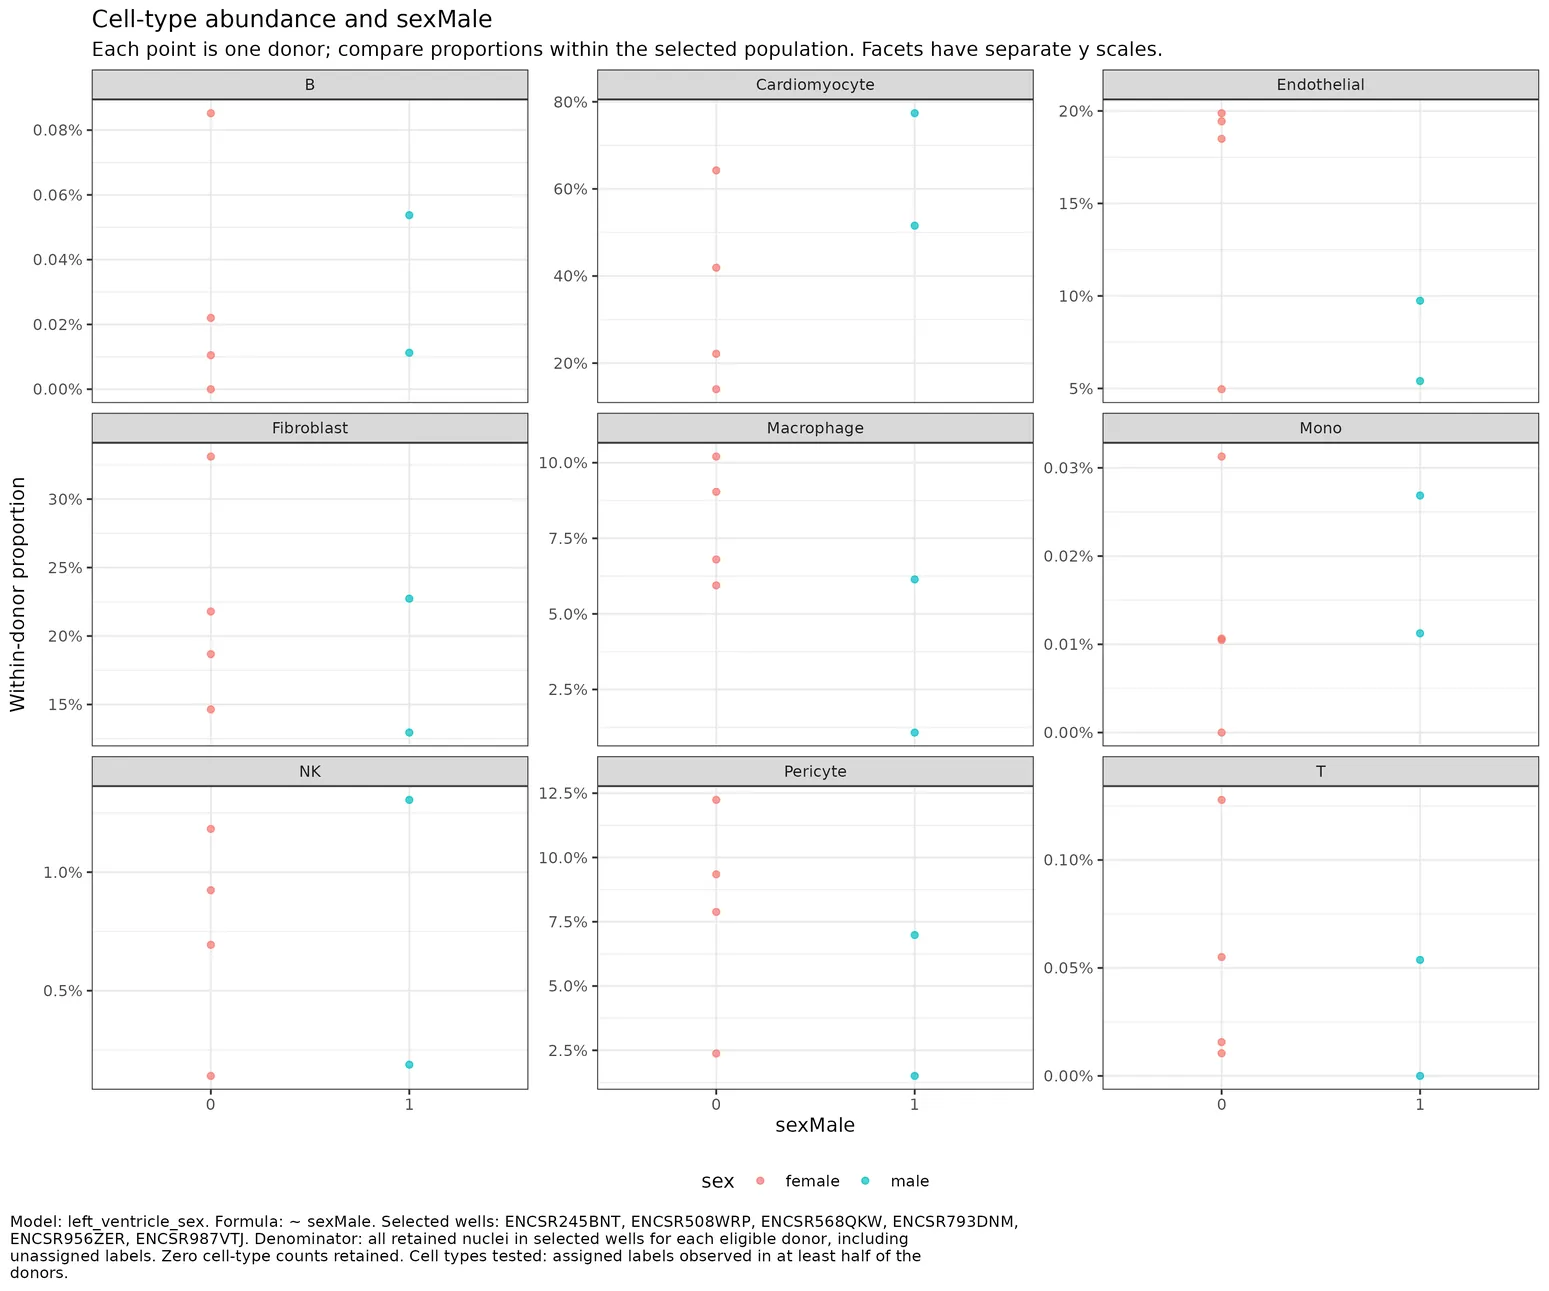
Plot observed donor proportions and abundance contrasts per model. model_plots.cell_type_composition.differential_analyses
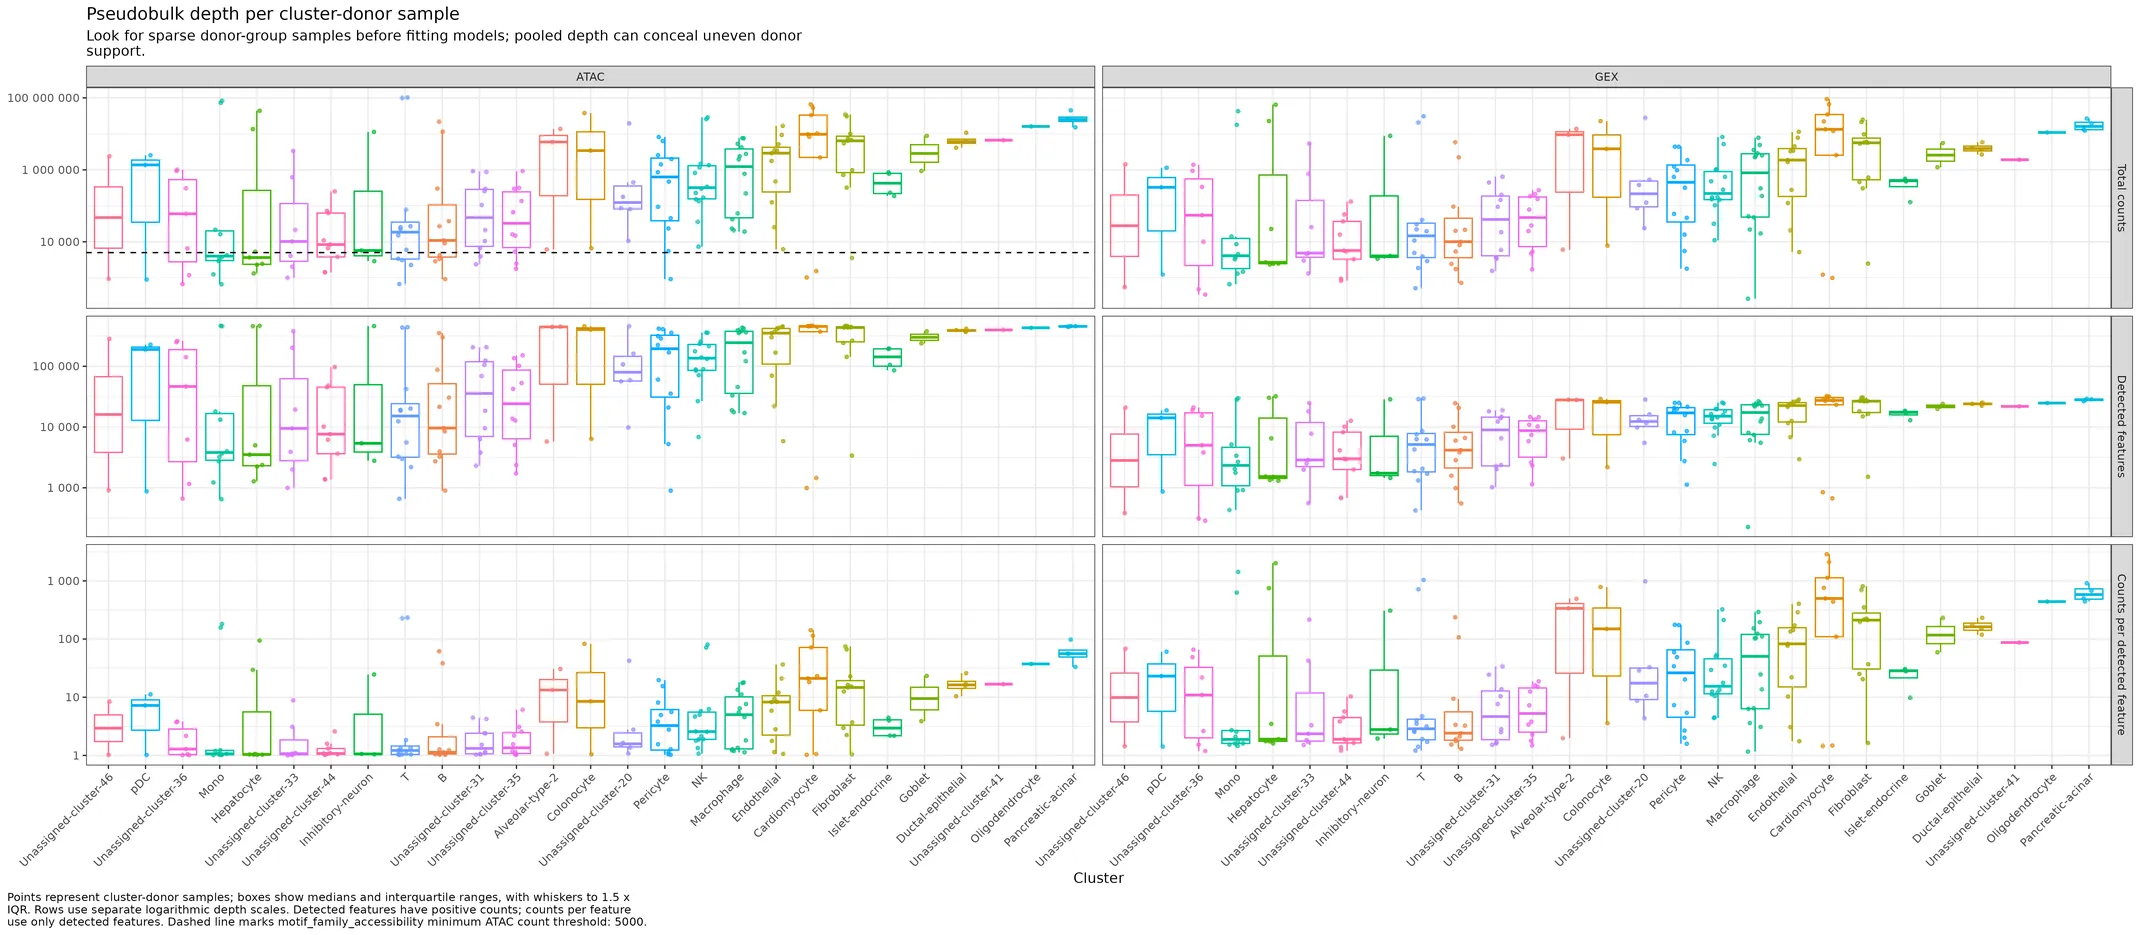
Plot depth and detected features per cluster-donor sample. pseudobulk_depth_distribution_plot.differential_analyses
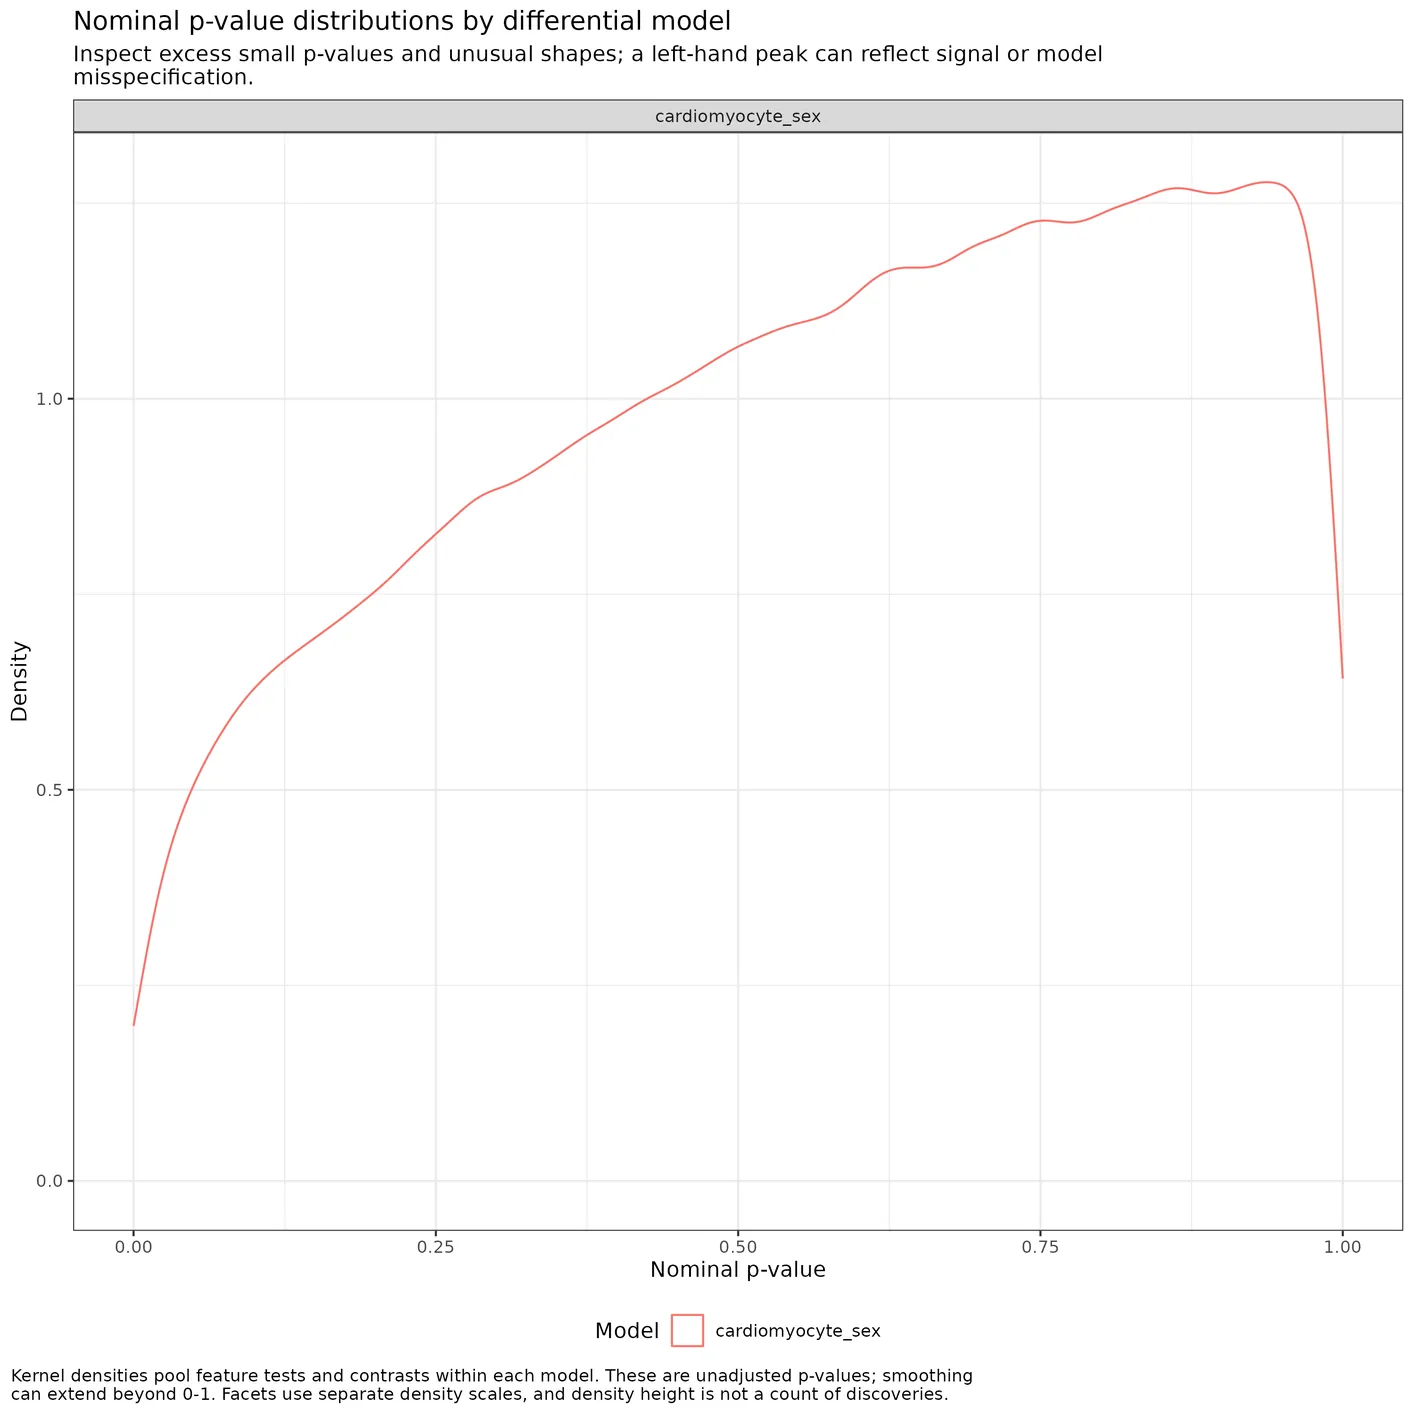
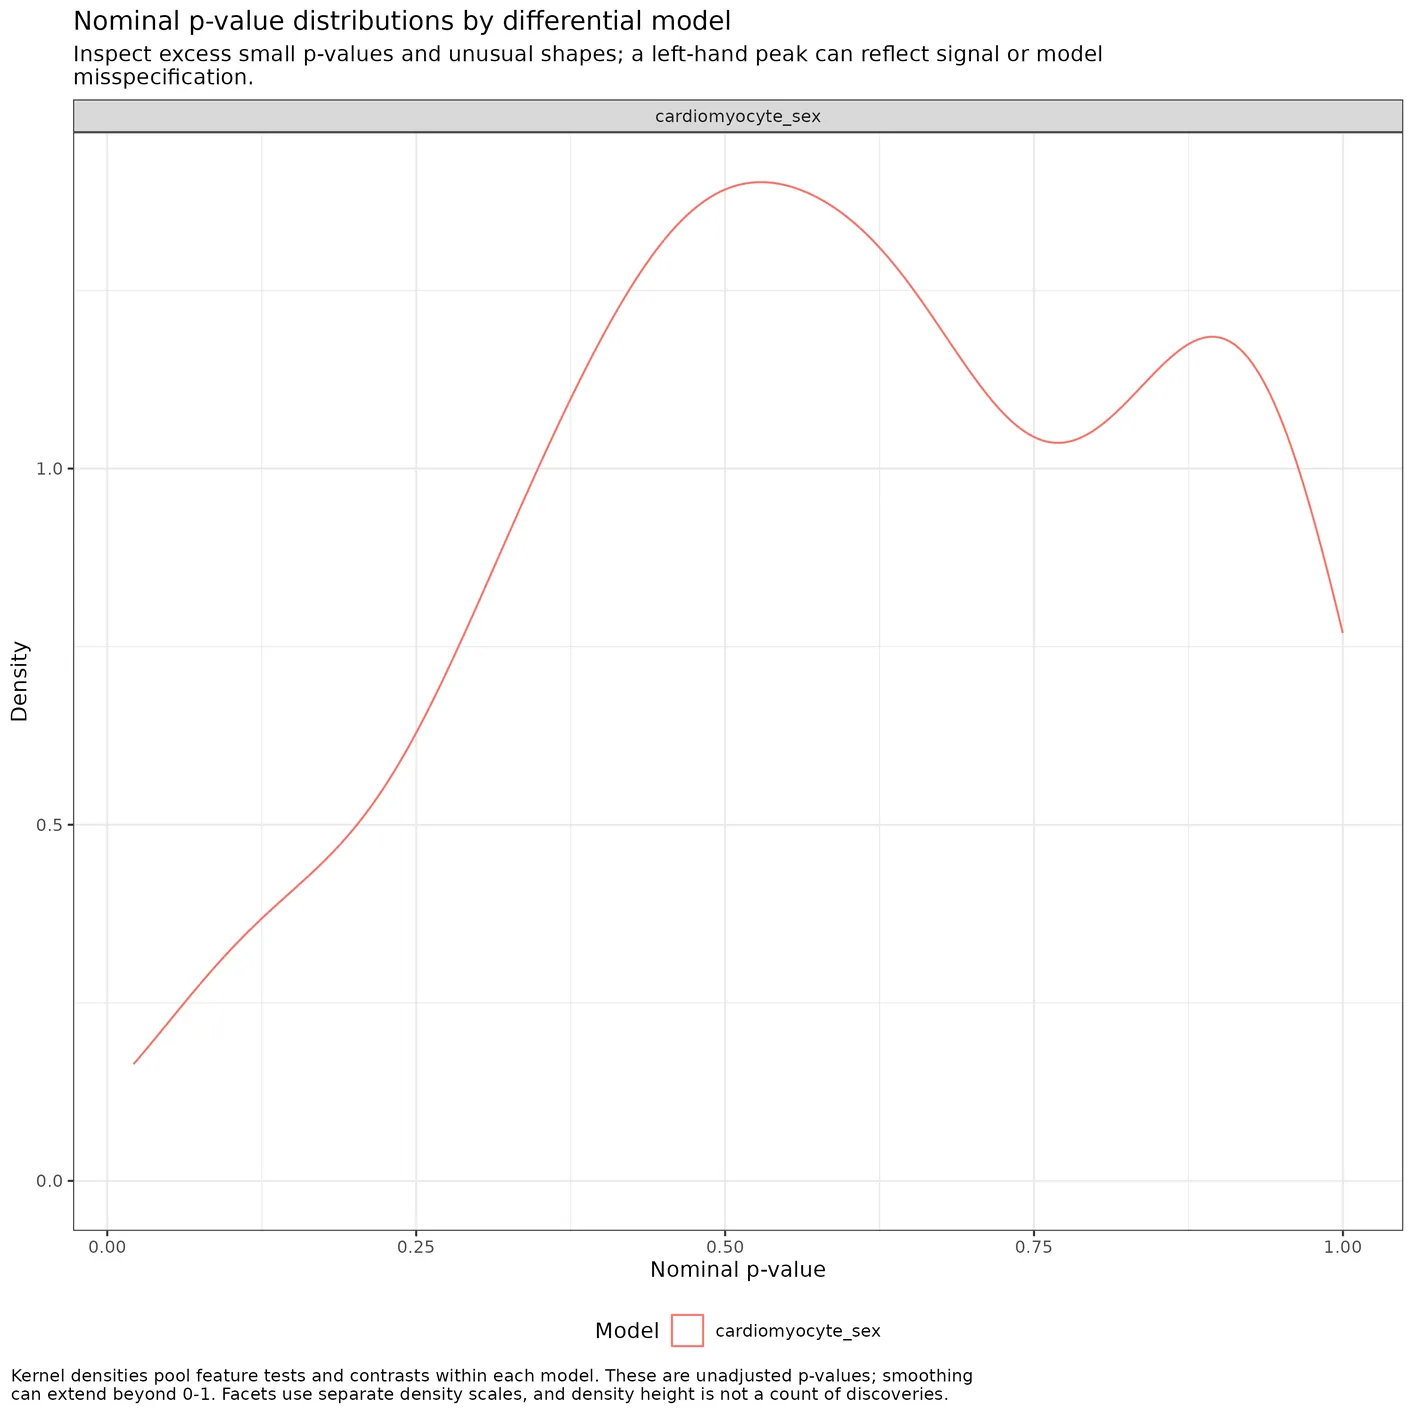
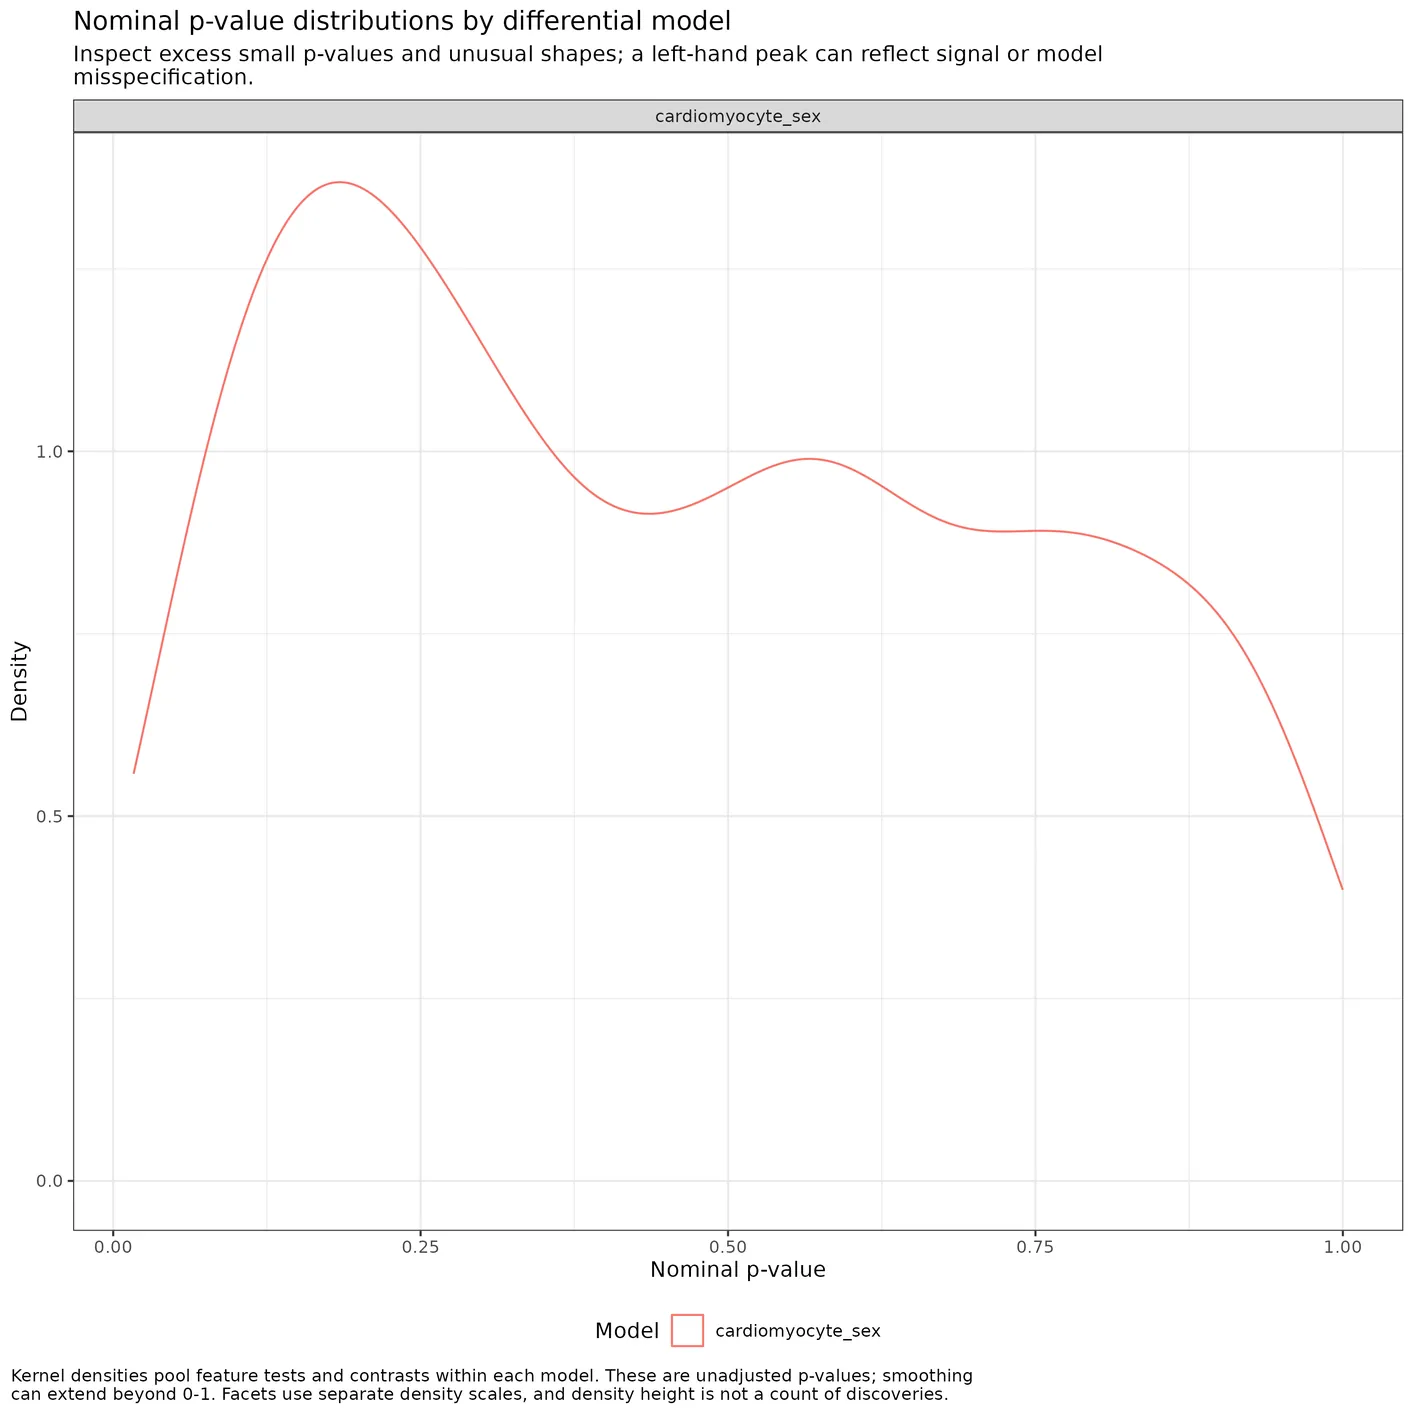
Save P-value density plots across all pseudobulk differential models. p_value_distribution_plot.chromatin_accessibility.differential_analyses
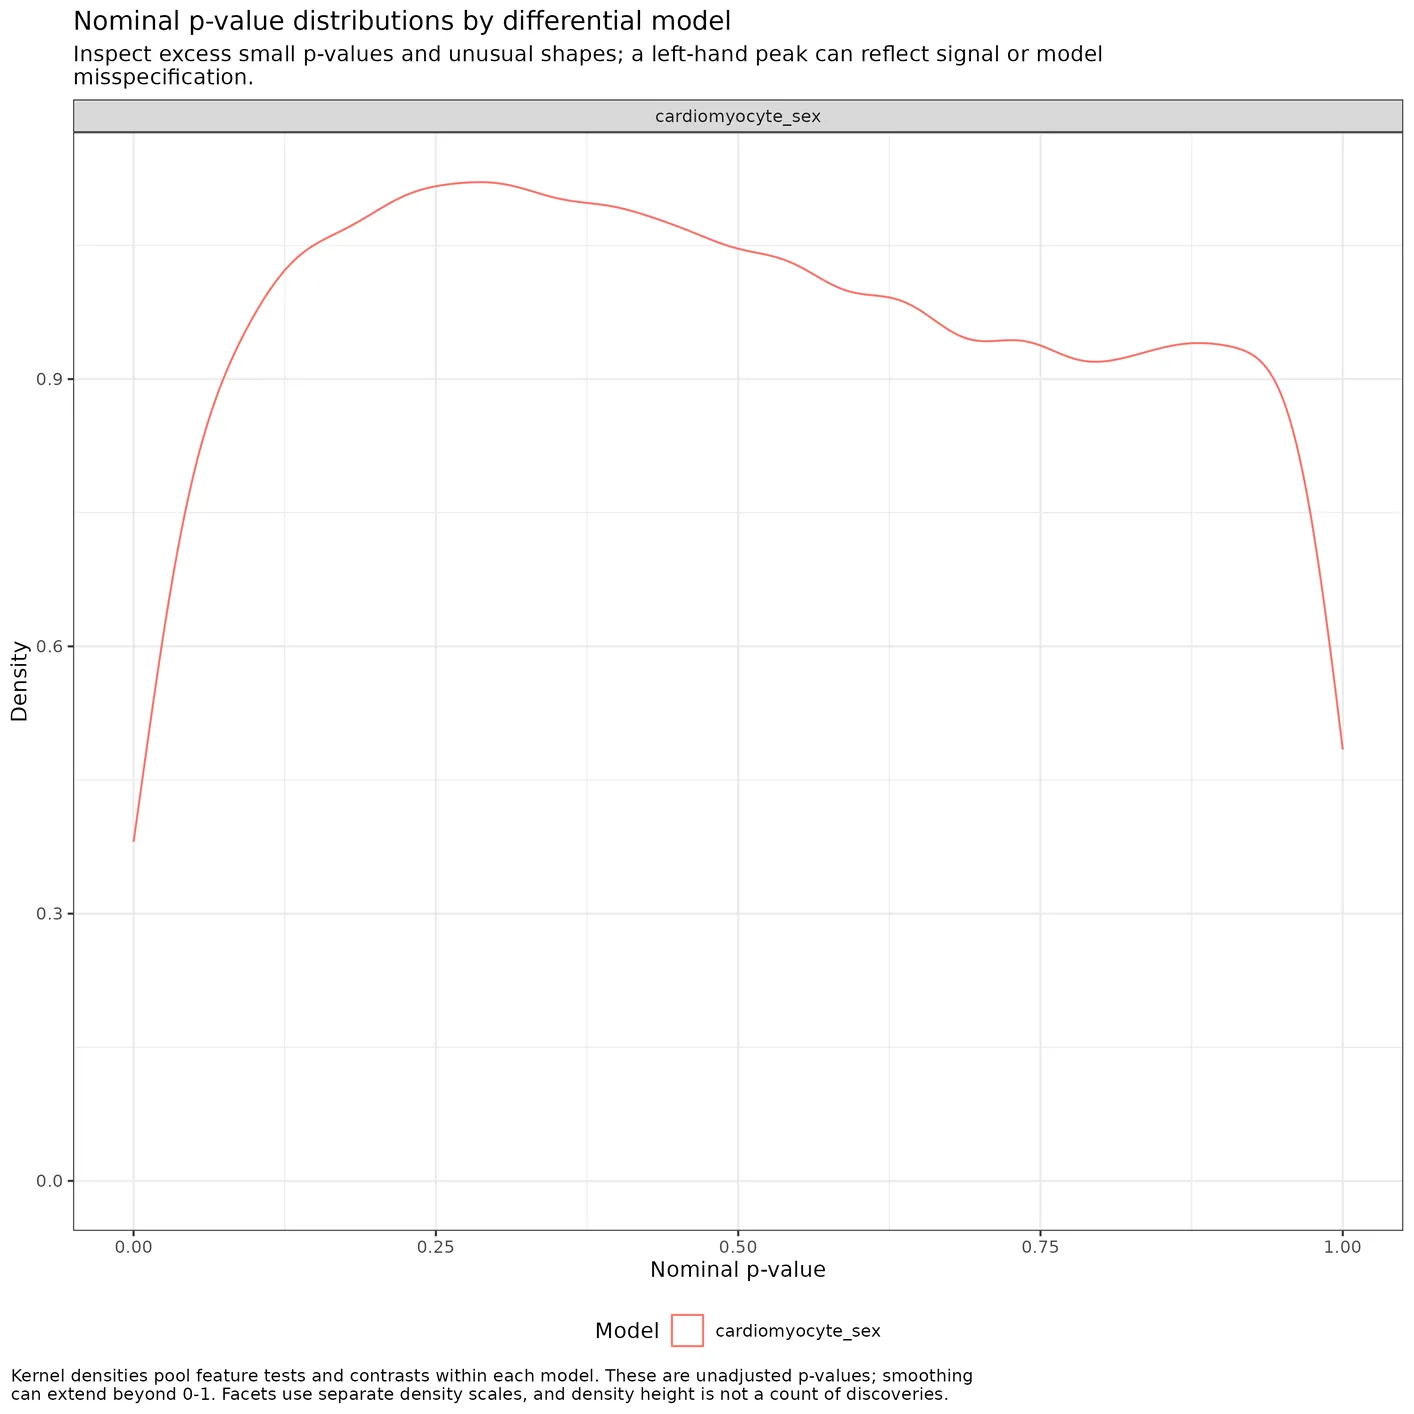
Save P-value density plots across all pseudobulk differential models. p_value_distribution_plot.gene_expression.differential_analyses
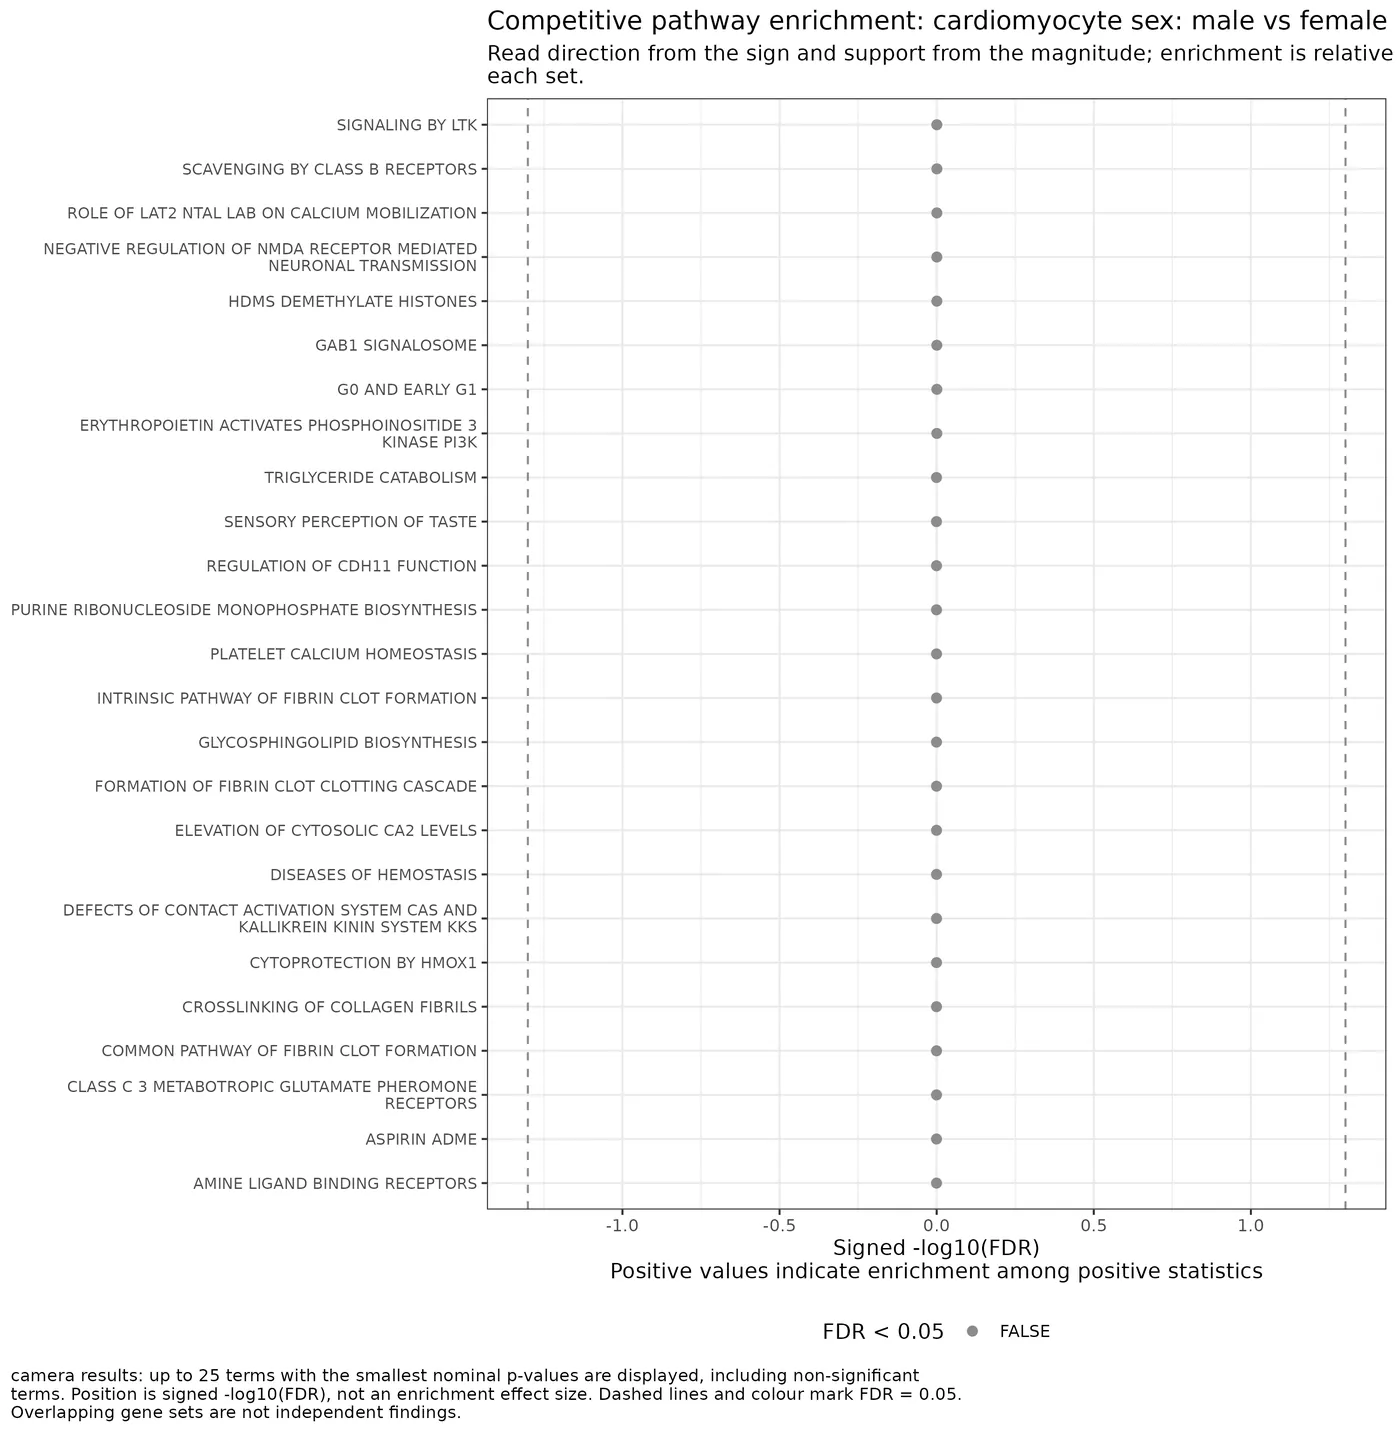
Save competitive camera plots per model and contrast to file. enrichment_plots.Reactome.gene_set_enrichment.gene_expression.differential_analyses
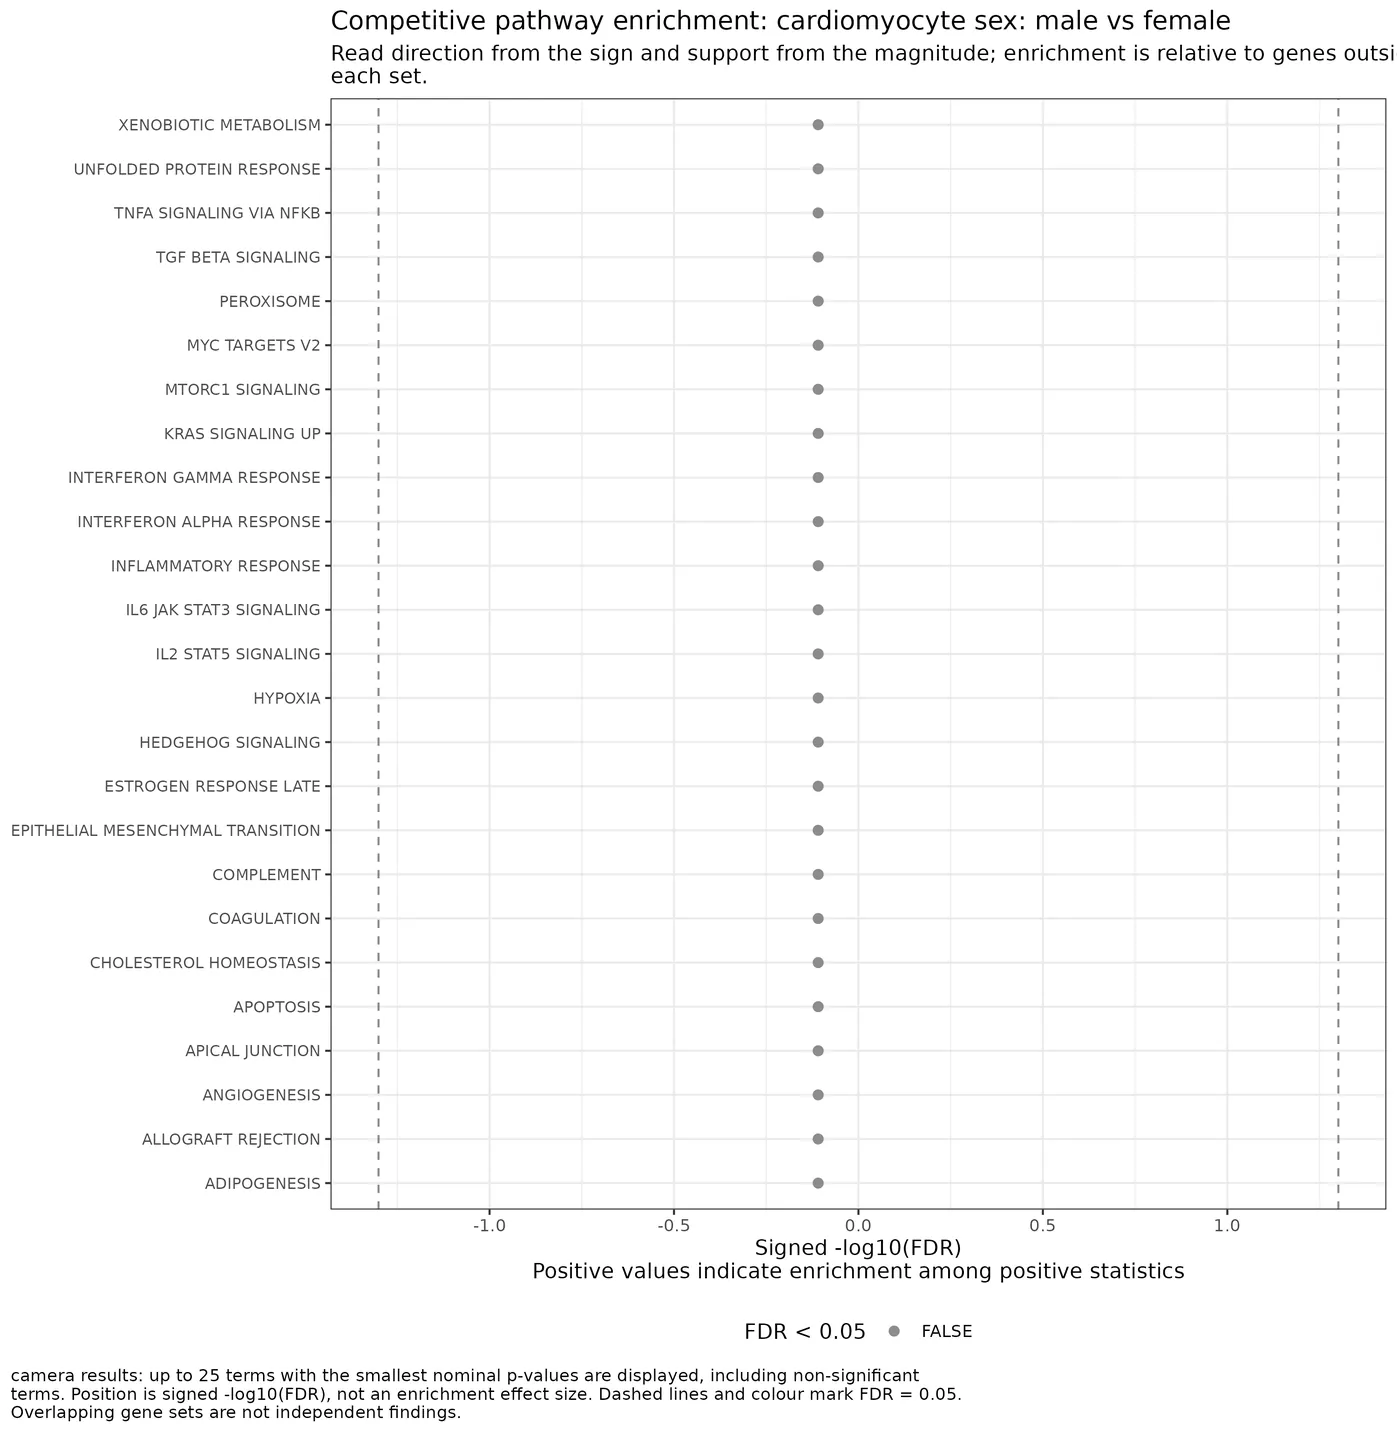
Save competitive camera plots per model and contrast to file. enrichment_plots.Hallmark.gene_set_enrichment.gene_expression.differential_analyses
Save P-value density plots across all pseudobulk differential models. p_value_distribution_plot.motif_family_accessibility.differential_analyses
Save P-value density plots across all pseudobulk differential models. p_value_distribution_plot.transcription_factor_activity.differential_analyses
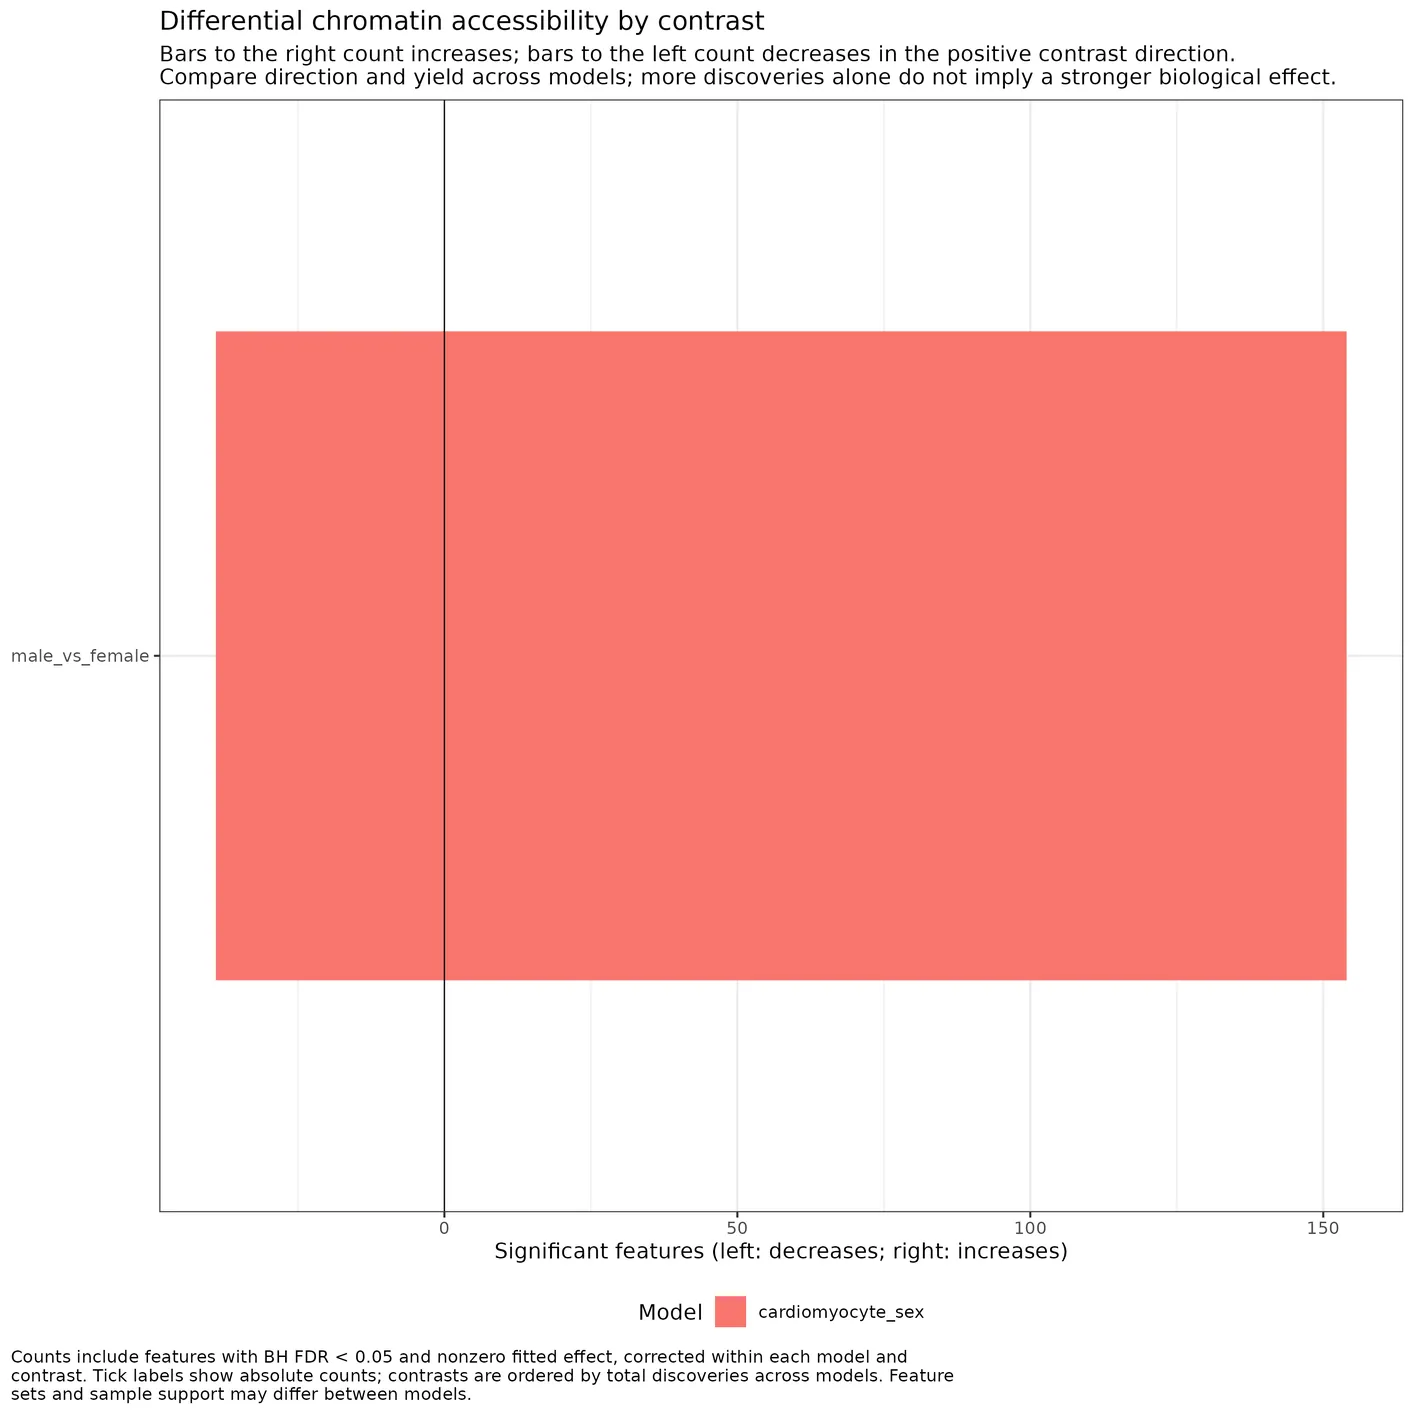
Plot signed counts of FDR-significant pseudobulk differential elements per model and contrast. significant_elements_plot.chromatin_accessibility.differential_analyses
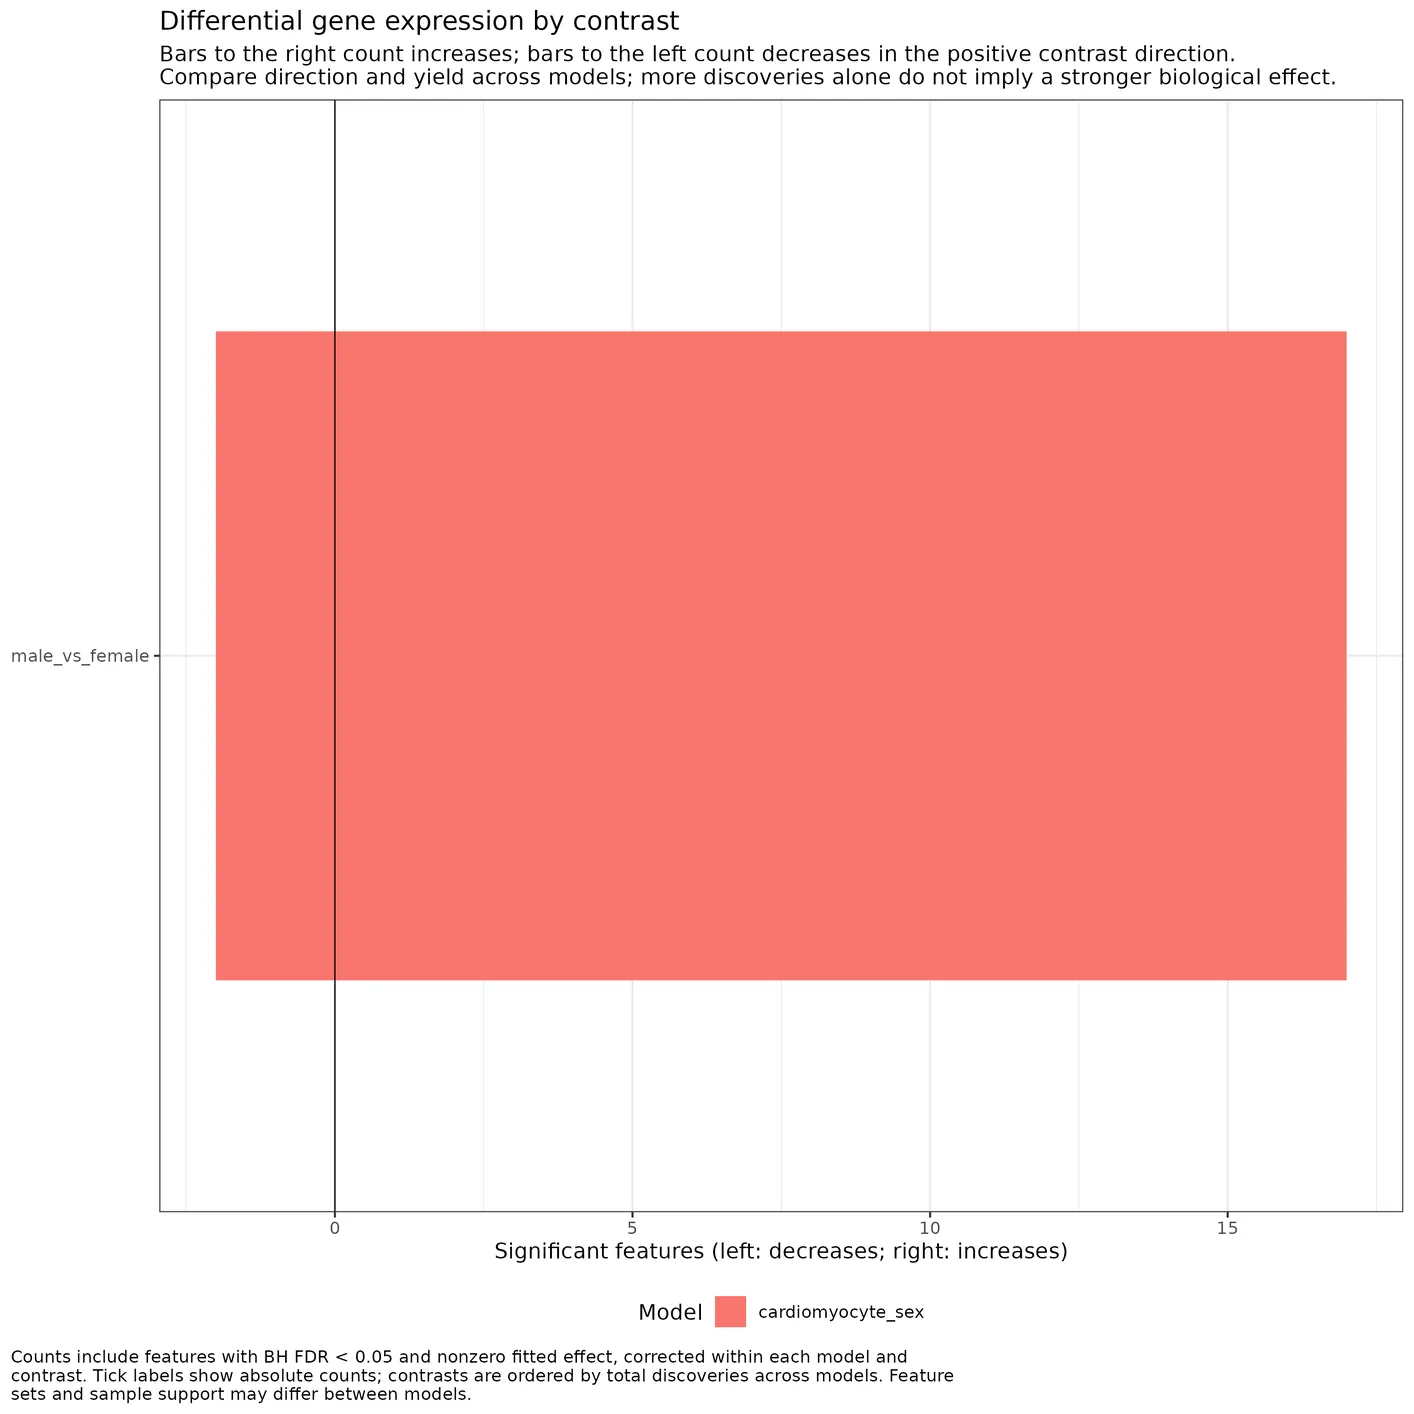
Plot signed counts of FDR-significant pseudobulk differential elements per model and contrast. significant_elements_plot.gene_expression.differential_analyses
Plot signed counts of FDR-significant pseudobulk differential elements per model and contrast. significant_elements_plot.motif_family_accessibility.differential_analyses
Plot signed counts of FDR-significant pseudobulk differential elements per model and contrast. significant_elements_plot.transcription_factor_activity.differential_analyses
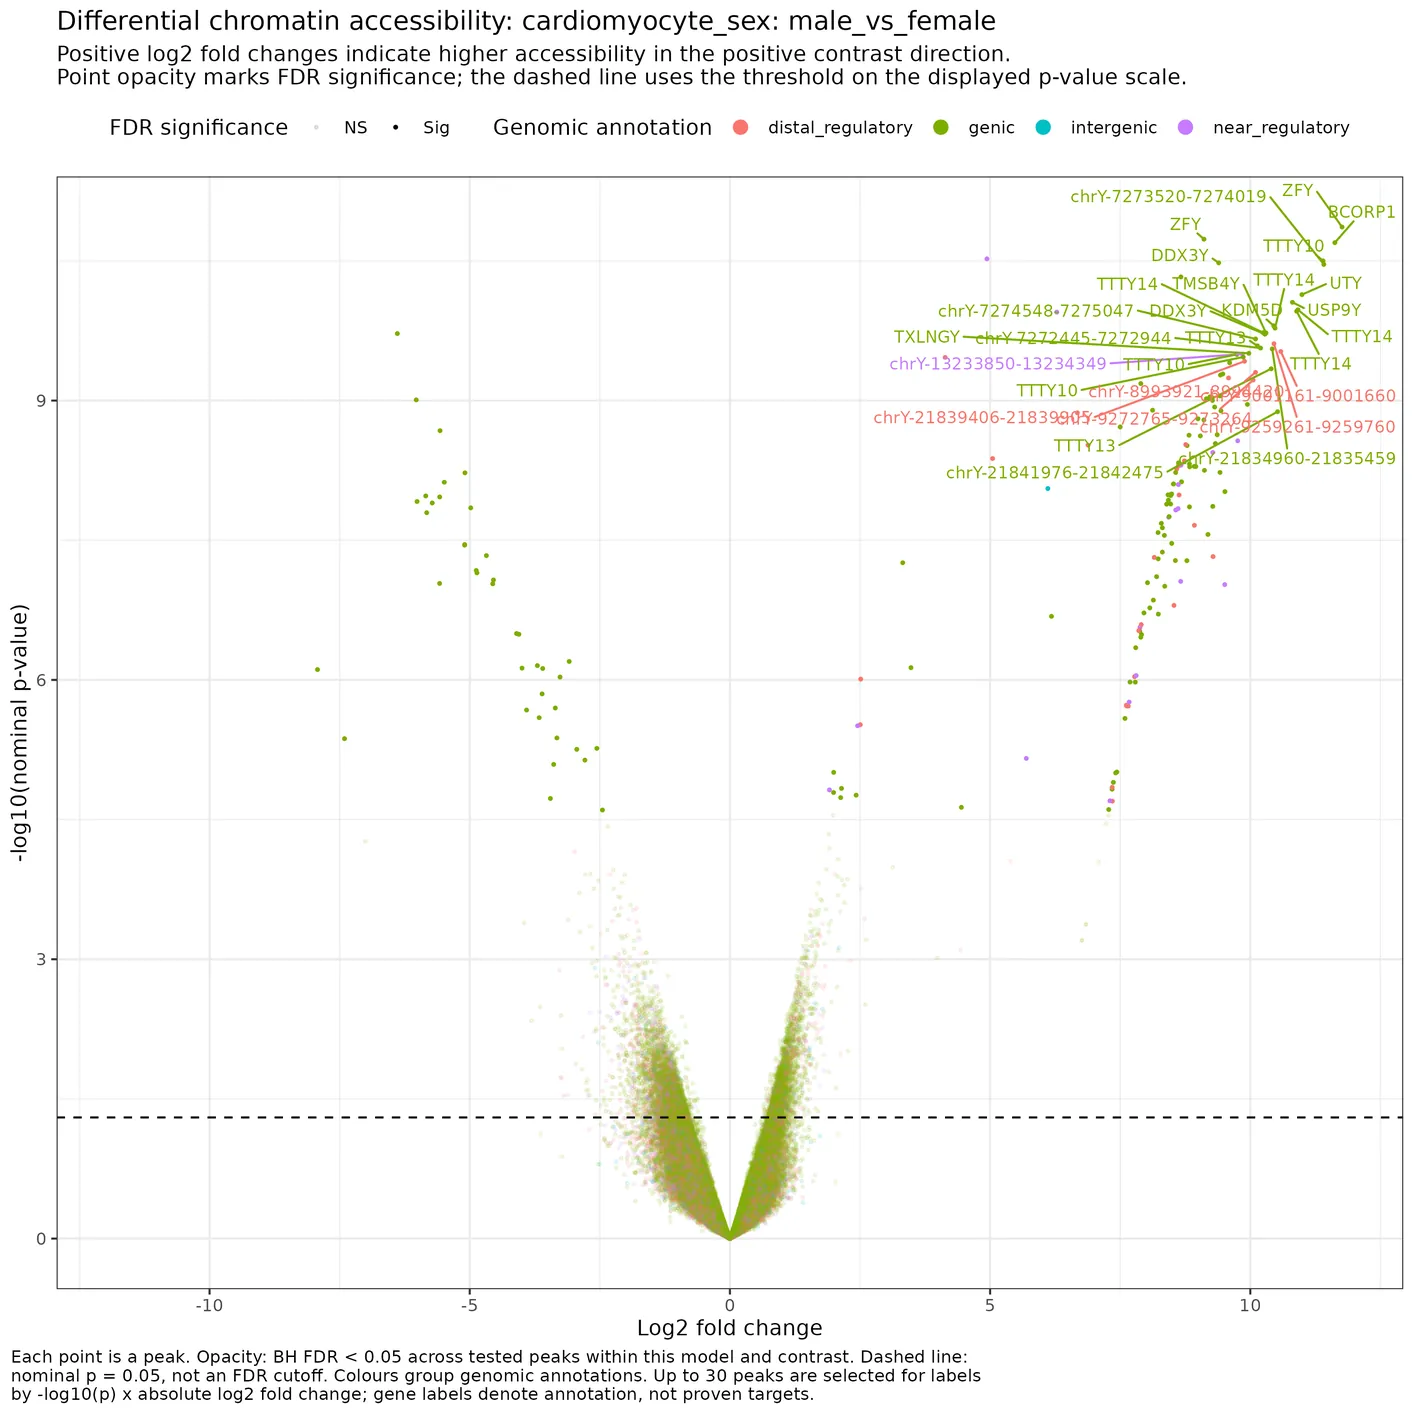
Plot volcano plots of pseudobulk differential results per contrast. volcano_plots.chromatin_accessibility.differential_analyses
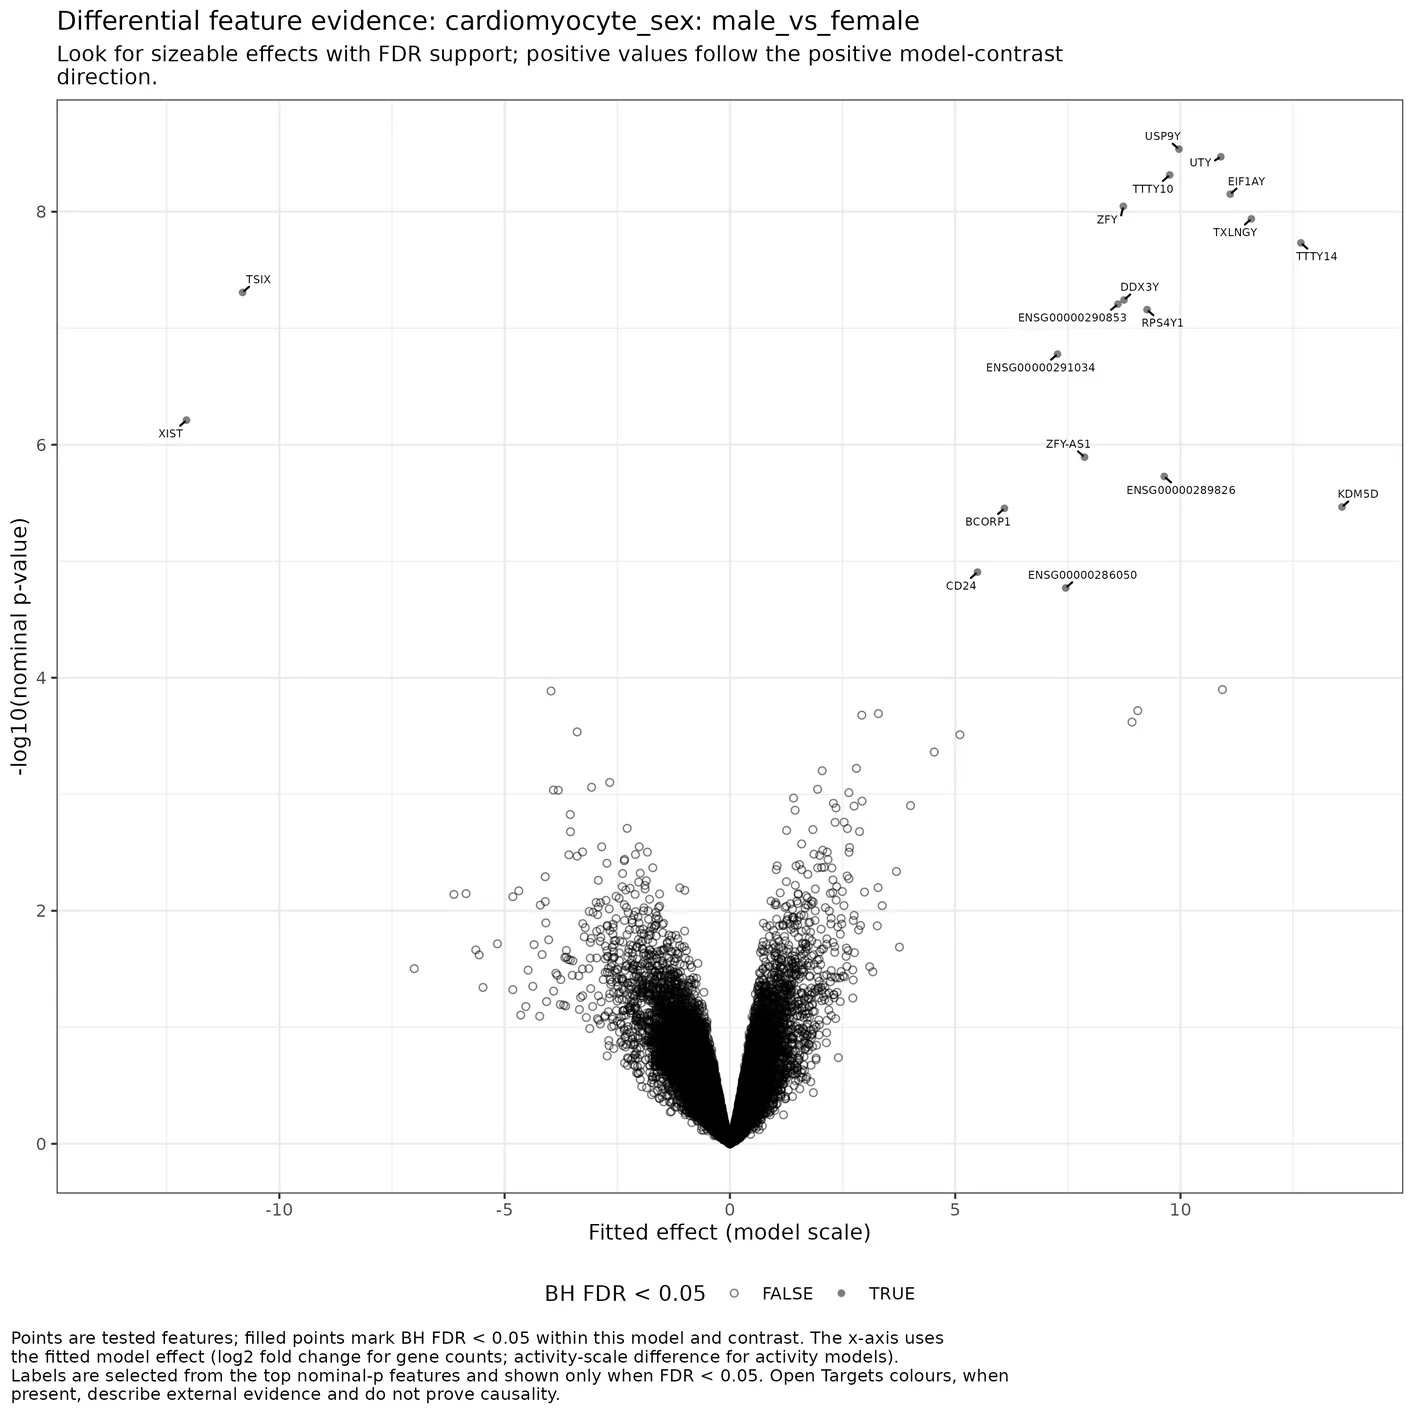
Plot volcano plots of pseudobulk differential results per contrast. volcano_plots.gene_expression.differential_analyses
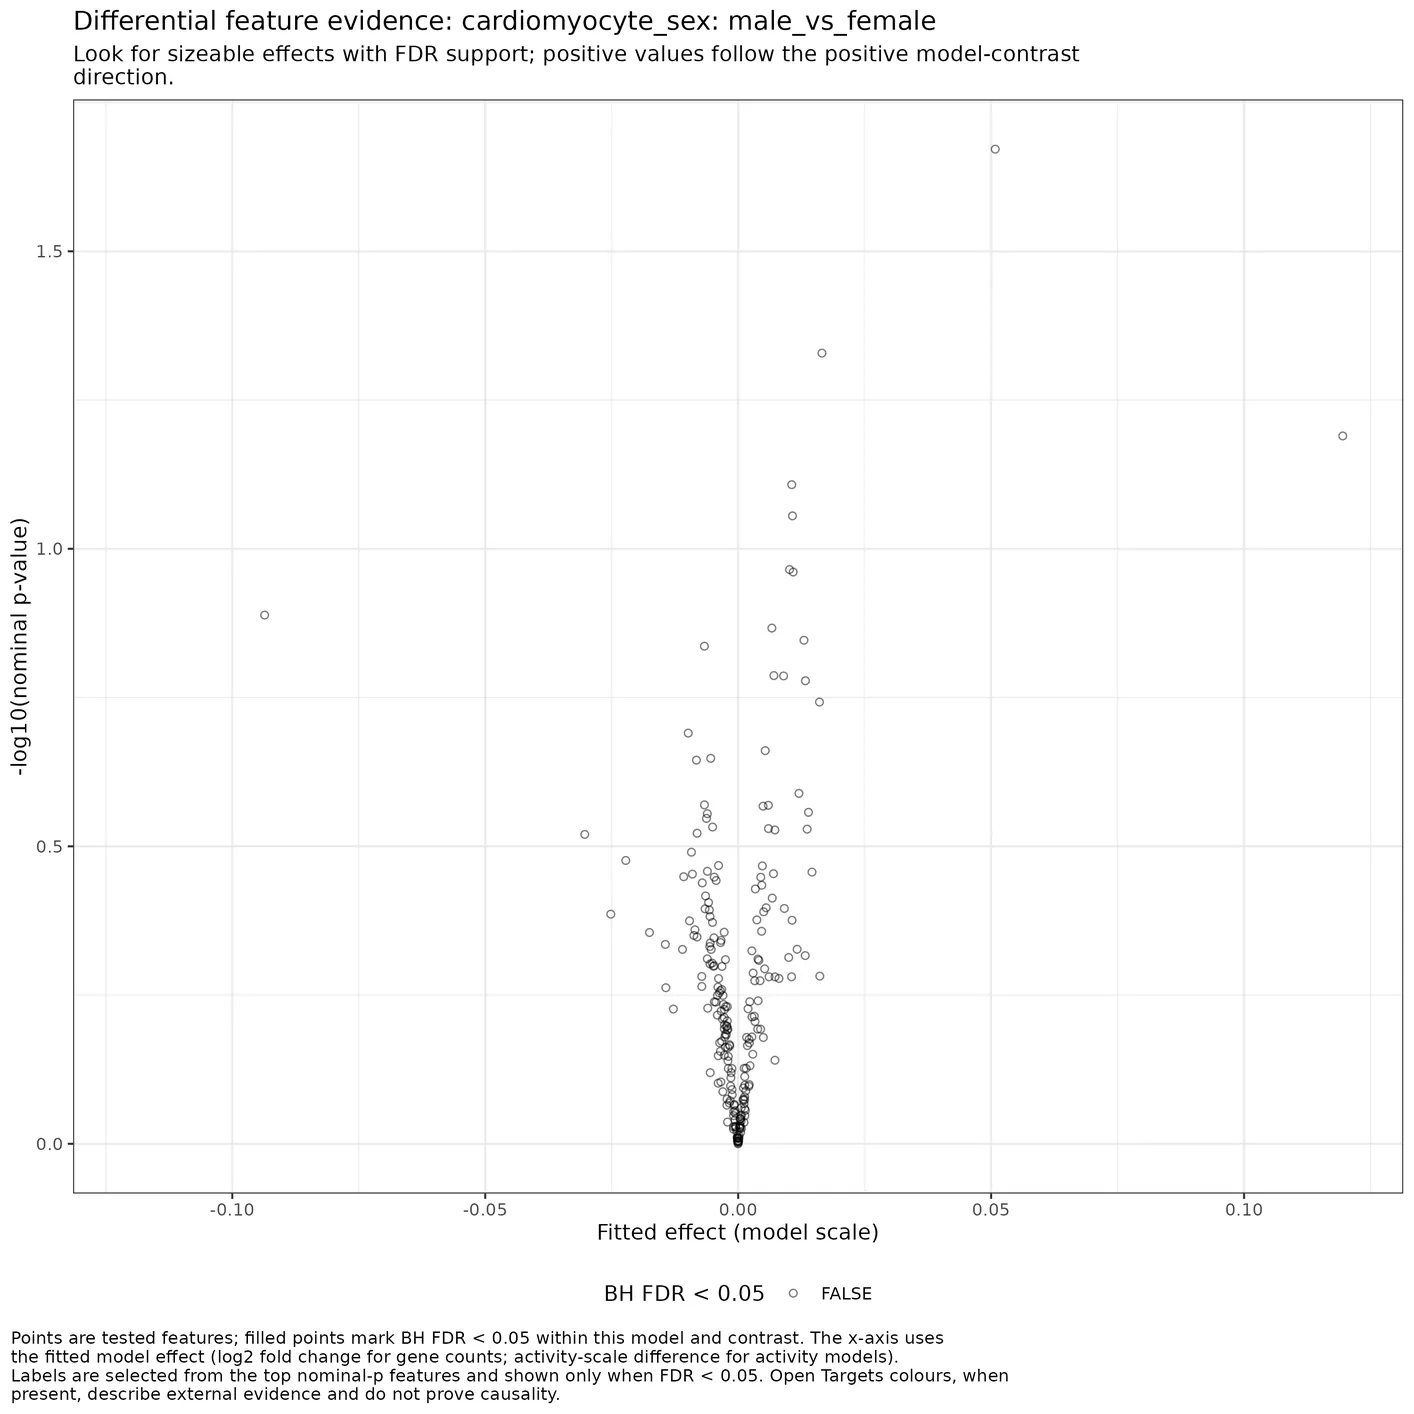
Plot volcano plots of pseudobulk differential results per contrast. volcano_plots.motif_family_accessibility.differential_analyses
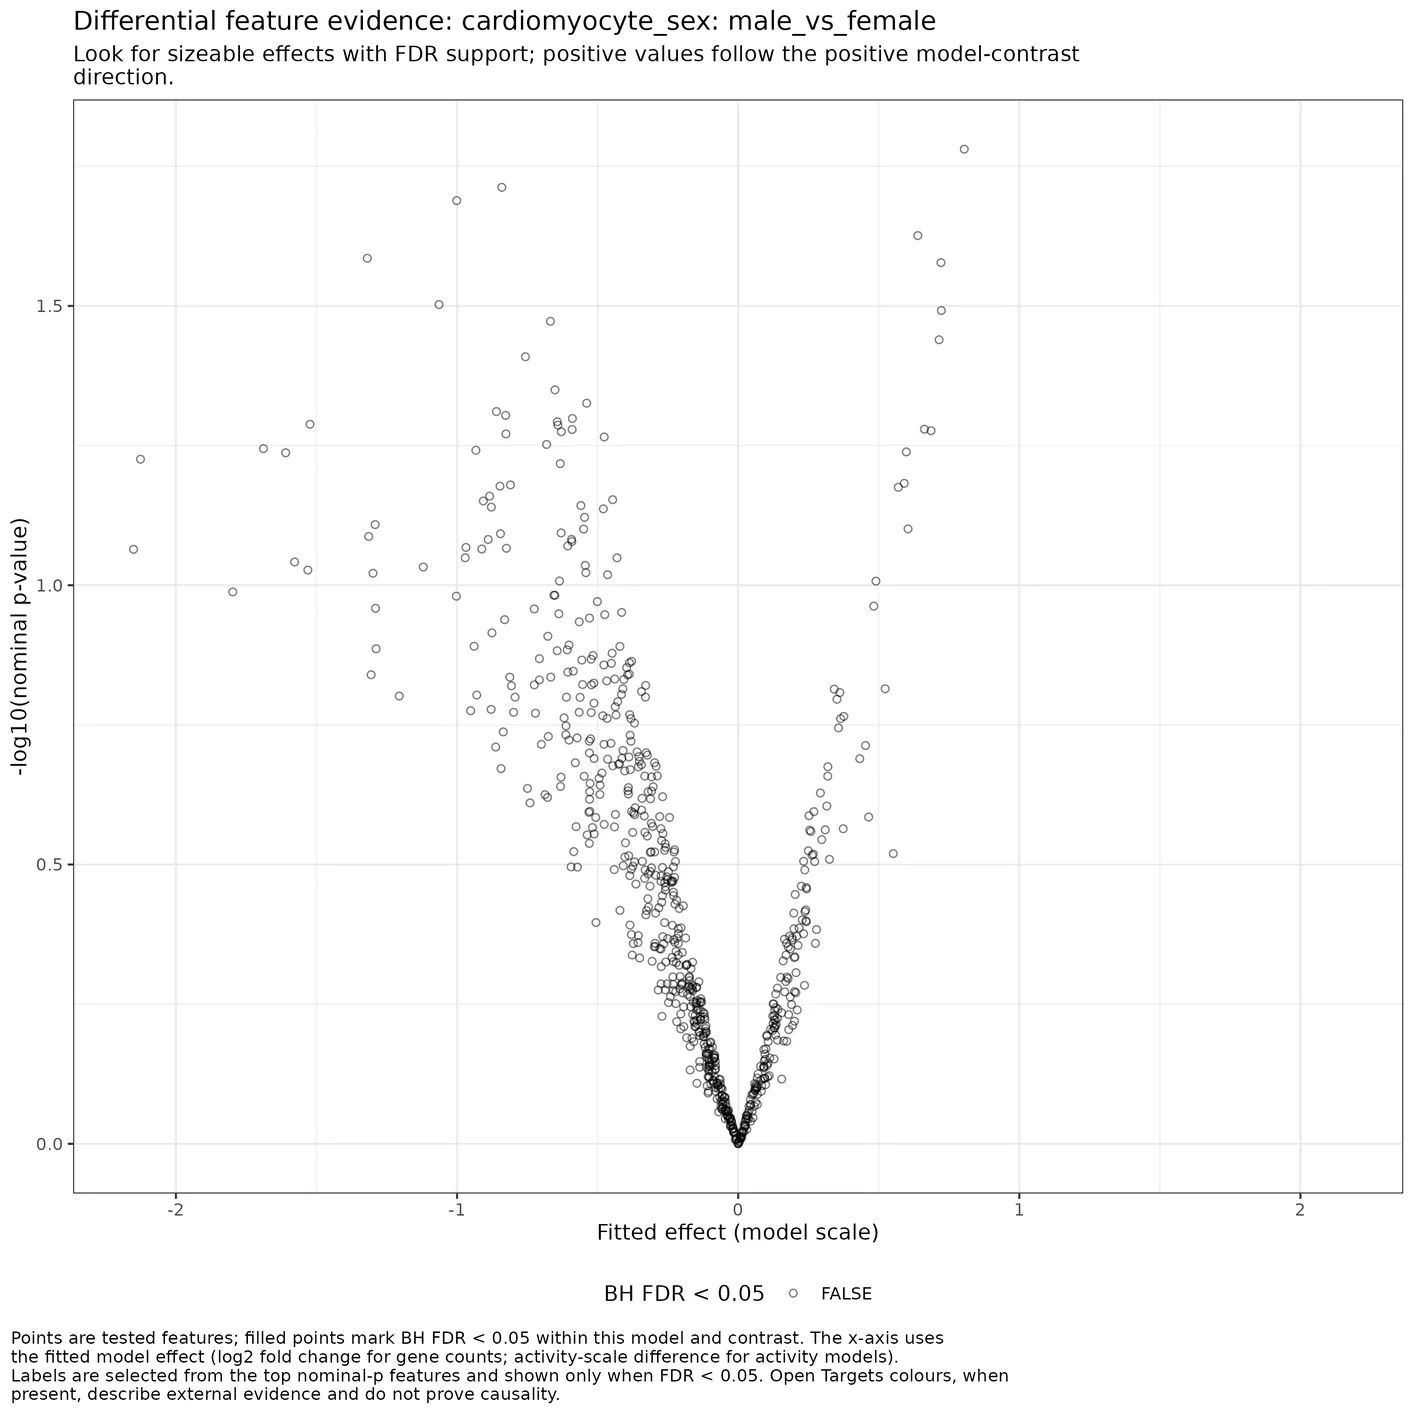
Plot volcano plots of pseudobulk differential results per contrast. volcano_plots.transcription_factor_activity.differential_analyses
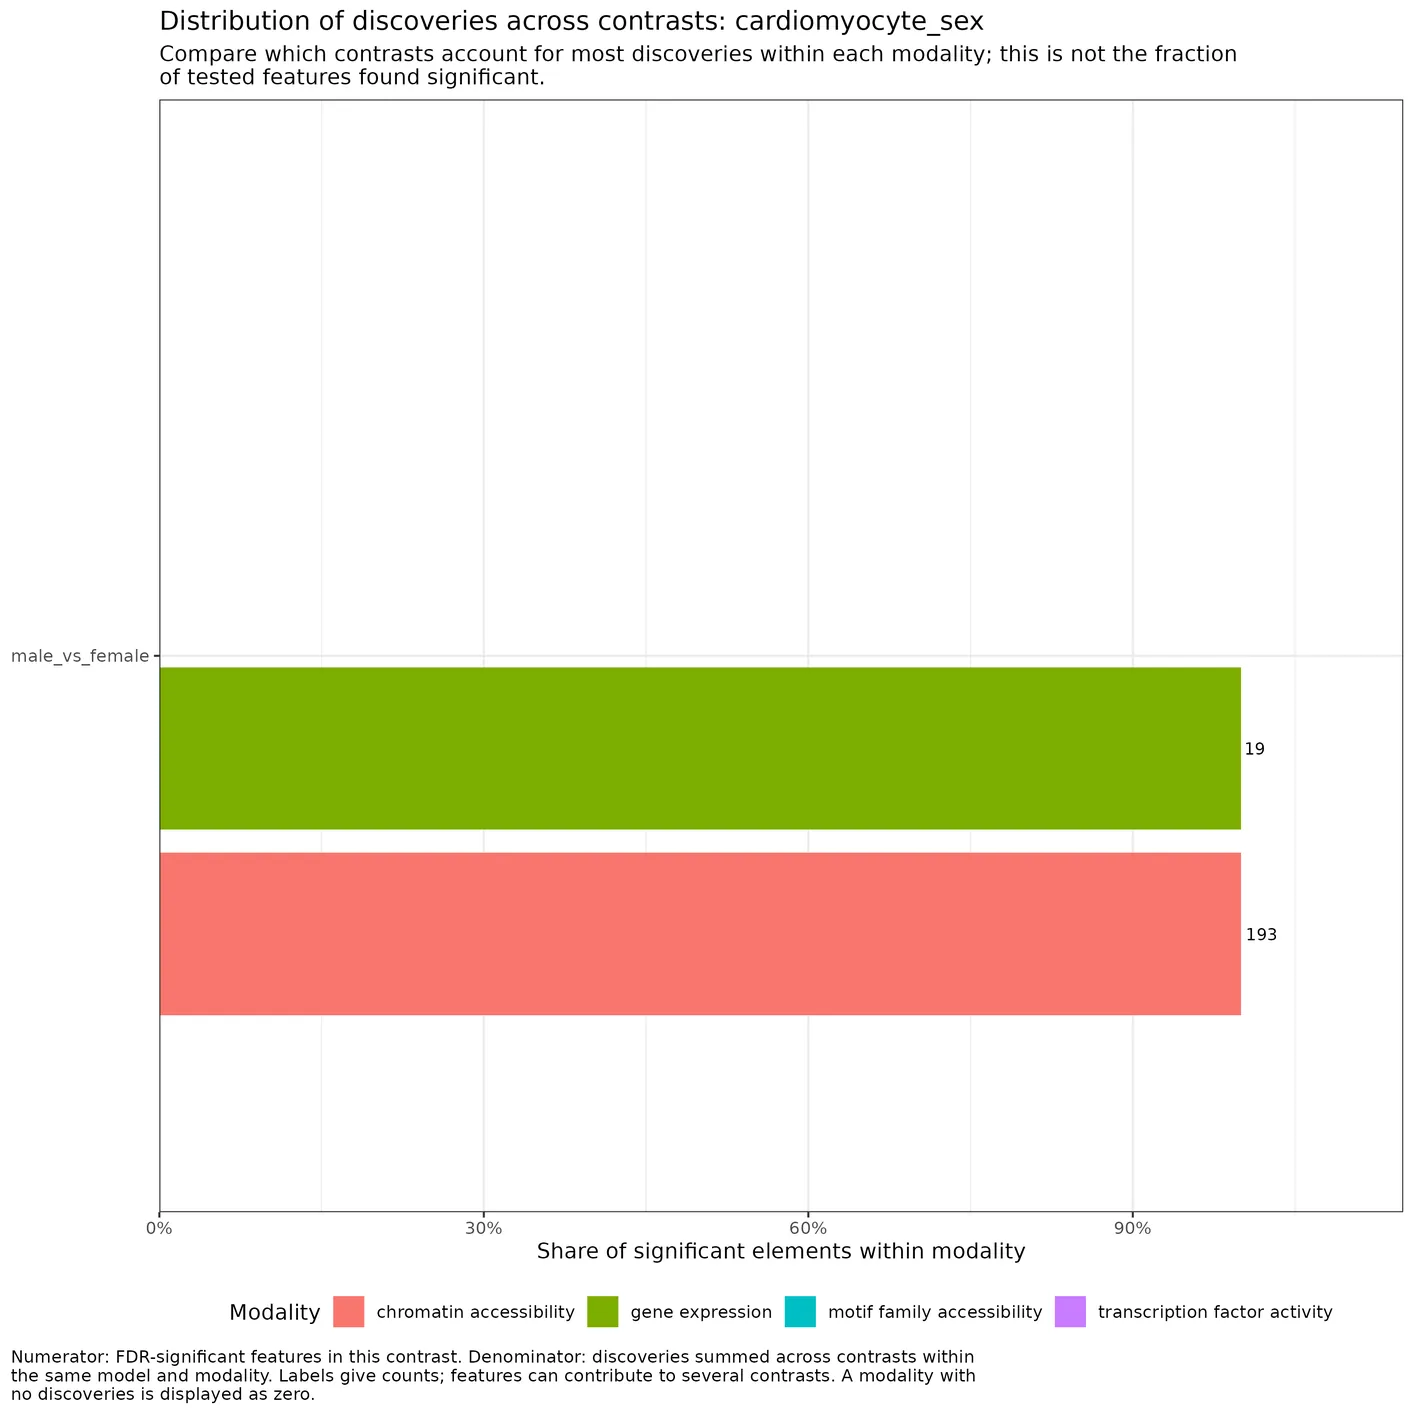
Plot each contrast’s share of significant elements across pseudobulk differential modalities per model. significant_elements_modality_distribution_plots.differential_analyses
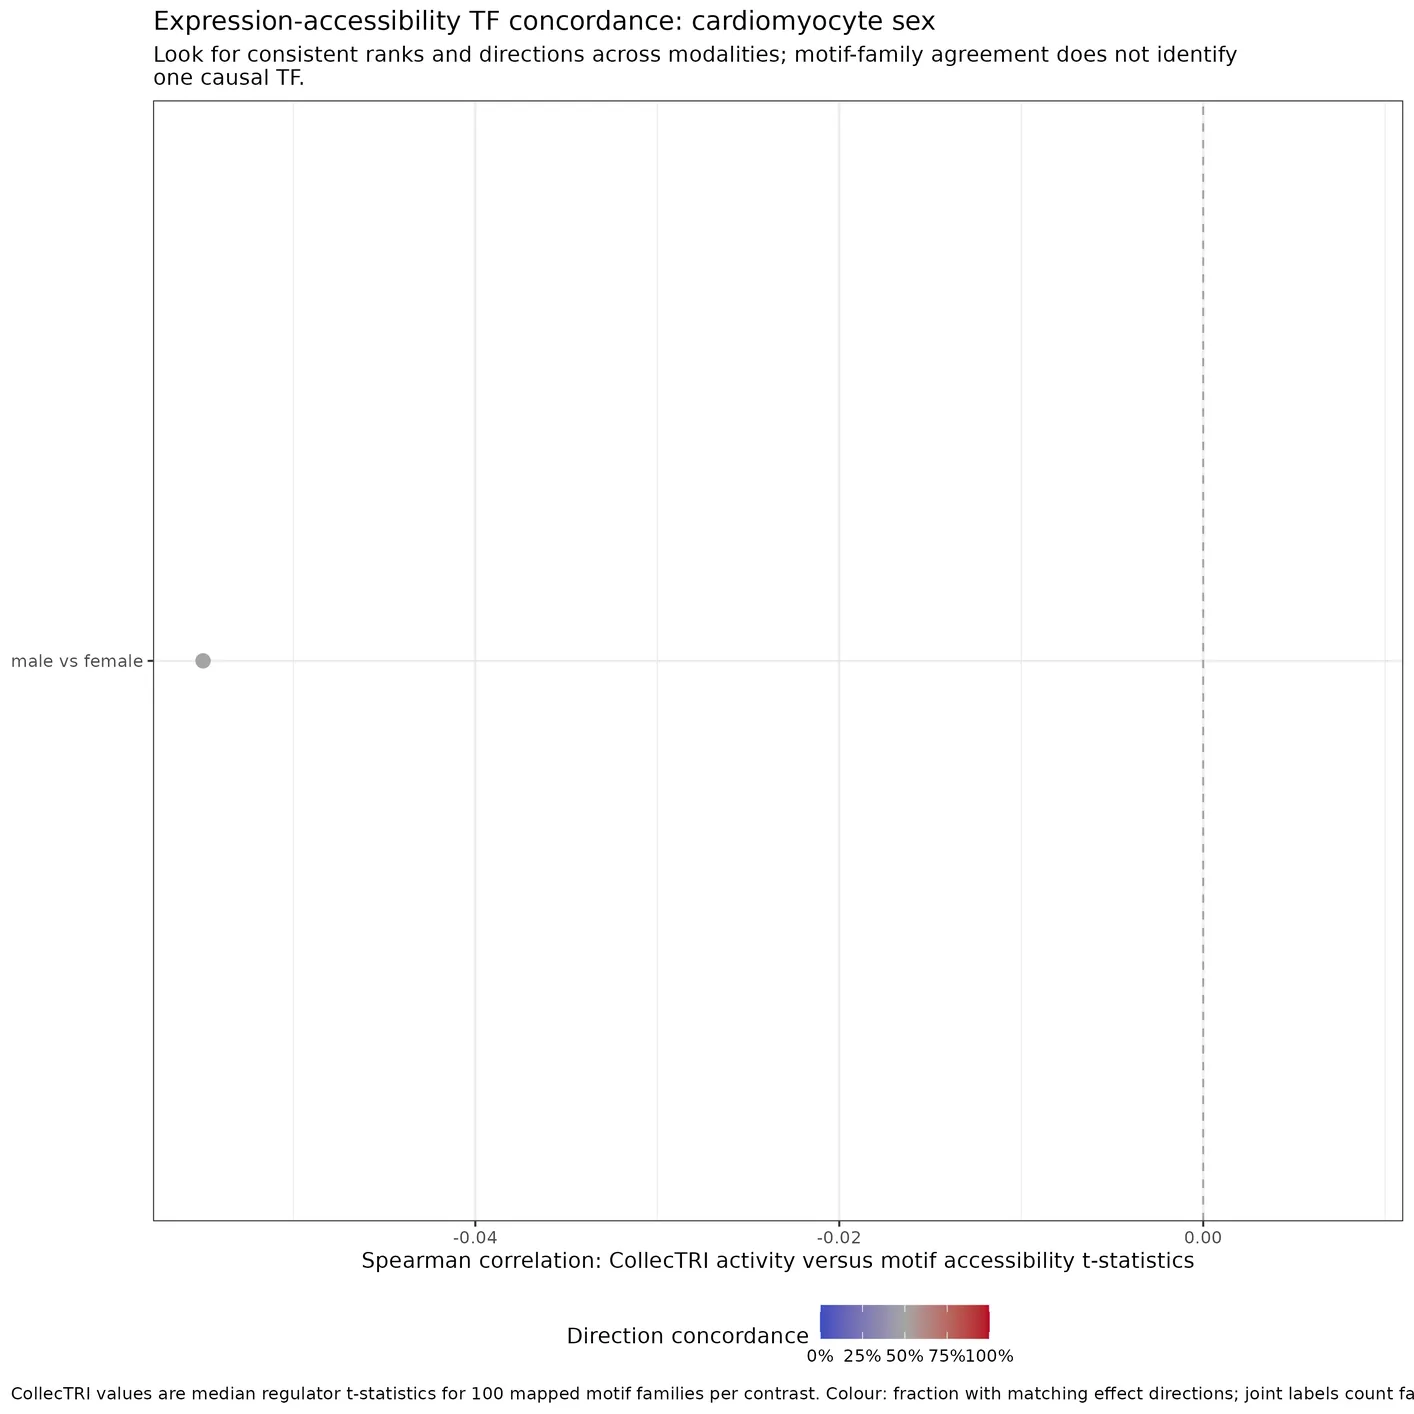
Plot expression- versus accessibility-derived TF activity concordance per contrast. activity_accessibility_concordance_plots.CollecTRI_JASPAR.differential_analyses
Genetic enrichment
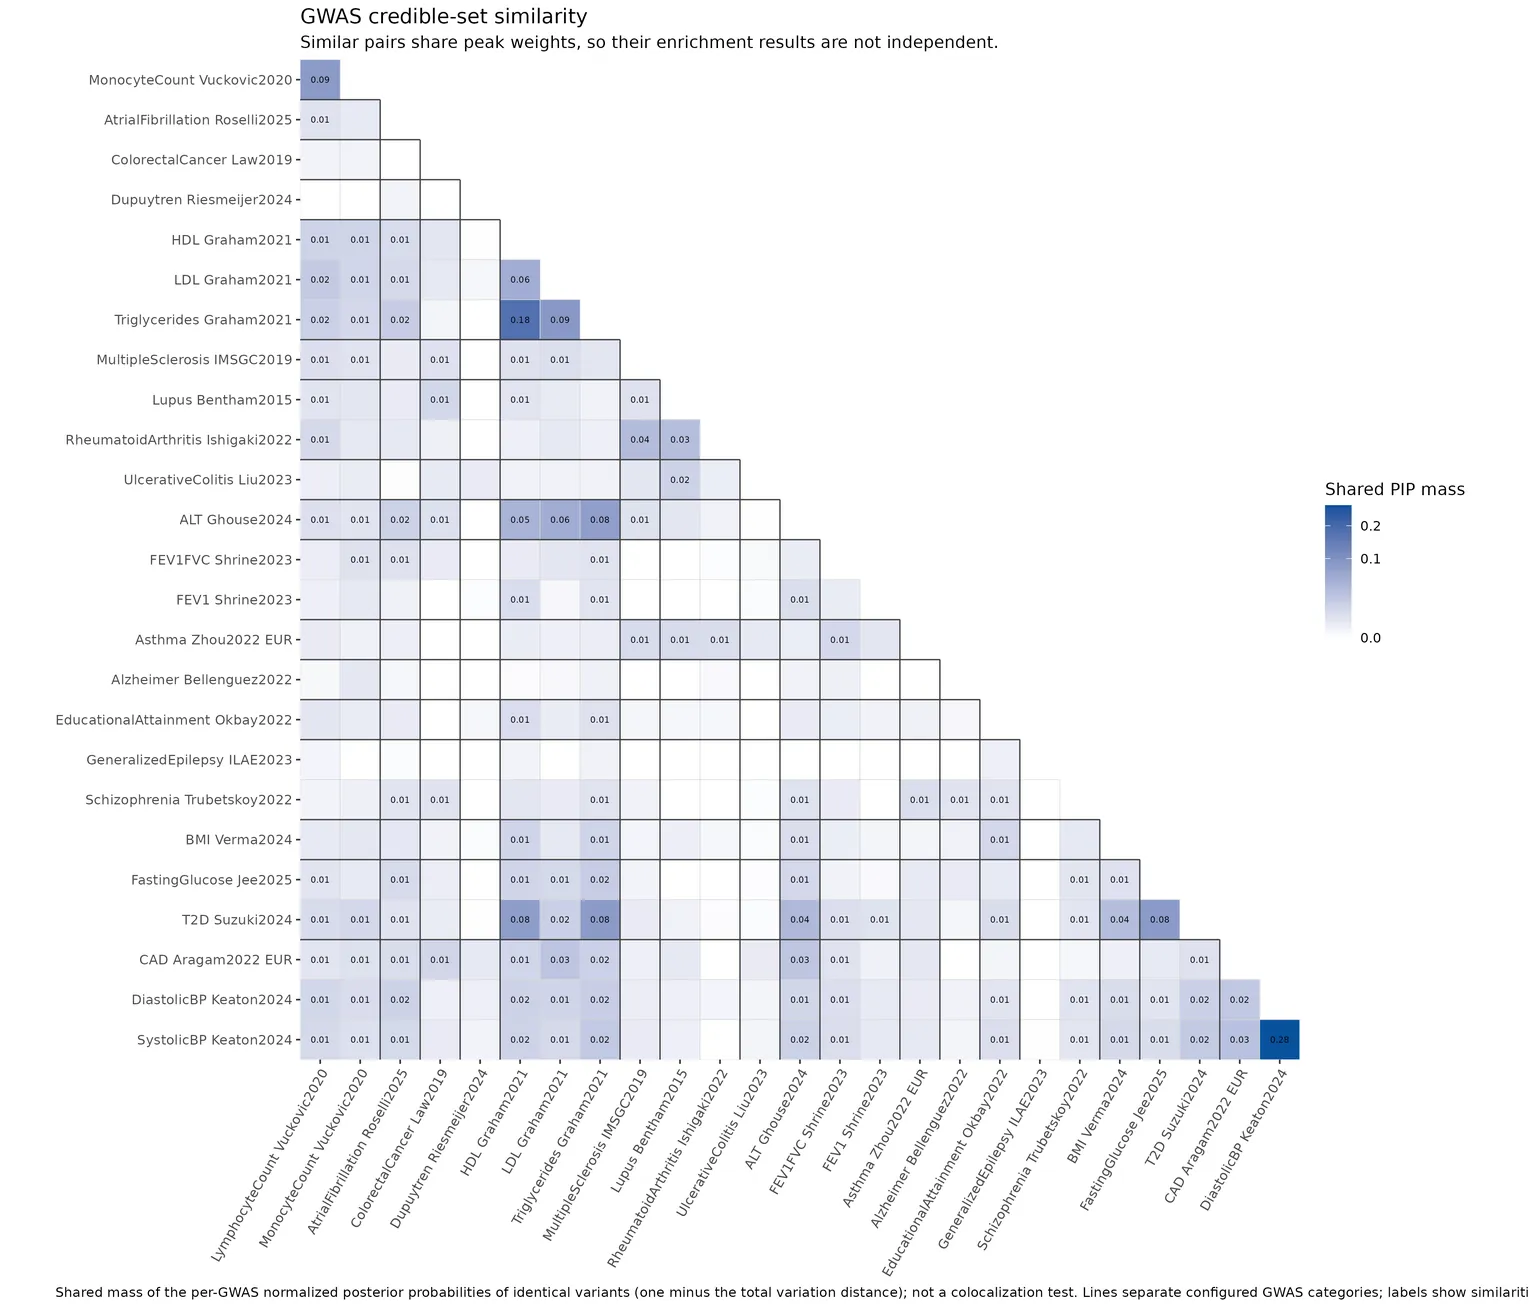
Plot the category-ordered GWAS credible-set similarity matrix and save to file. GWAS_credible_set_similarity_heatmap.genetic_enrichment
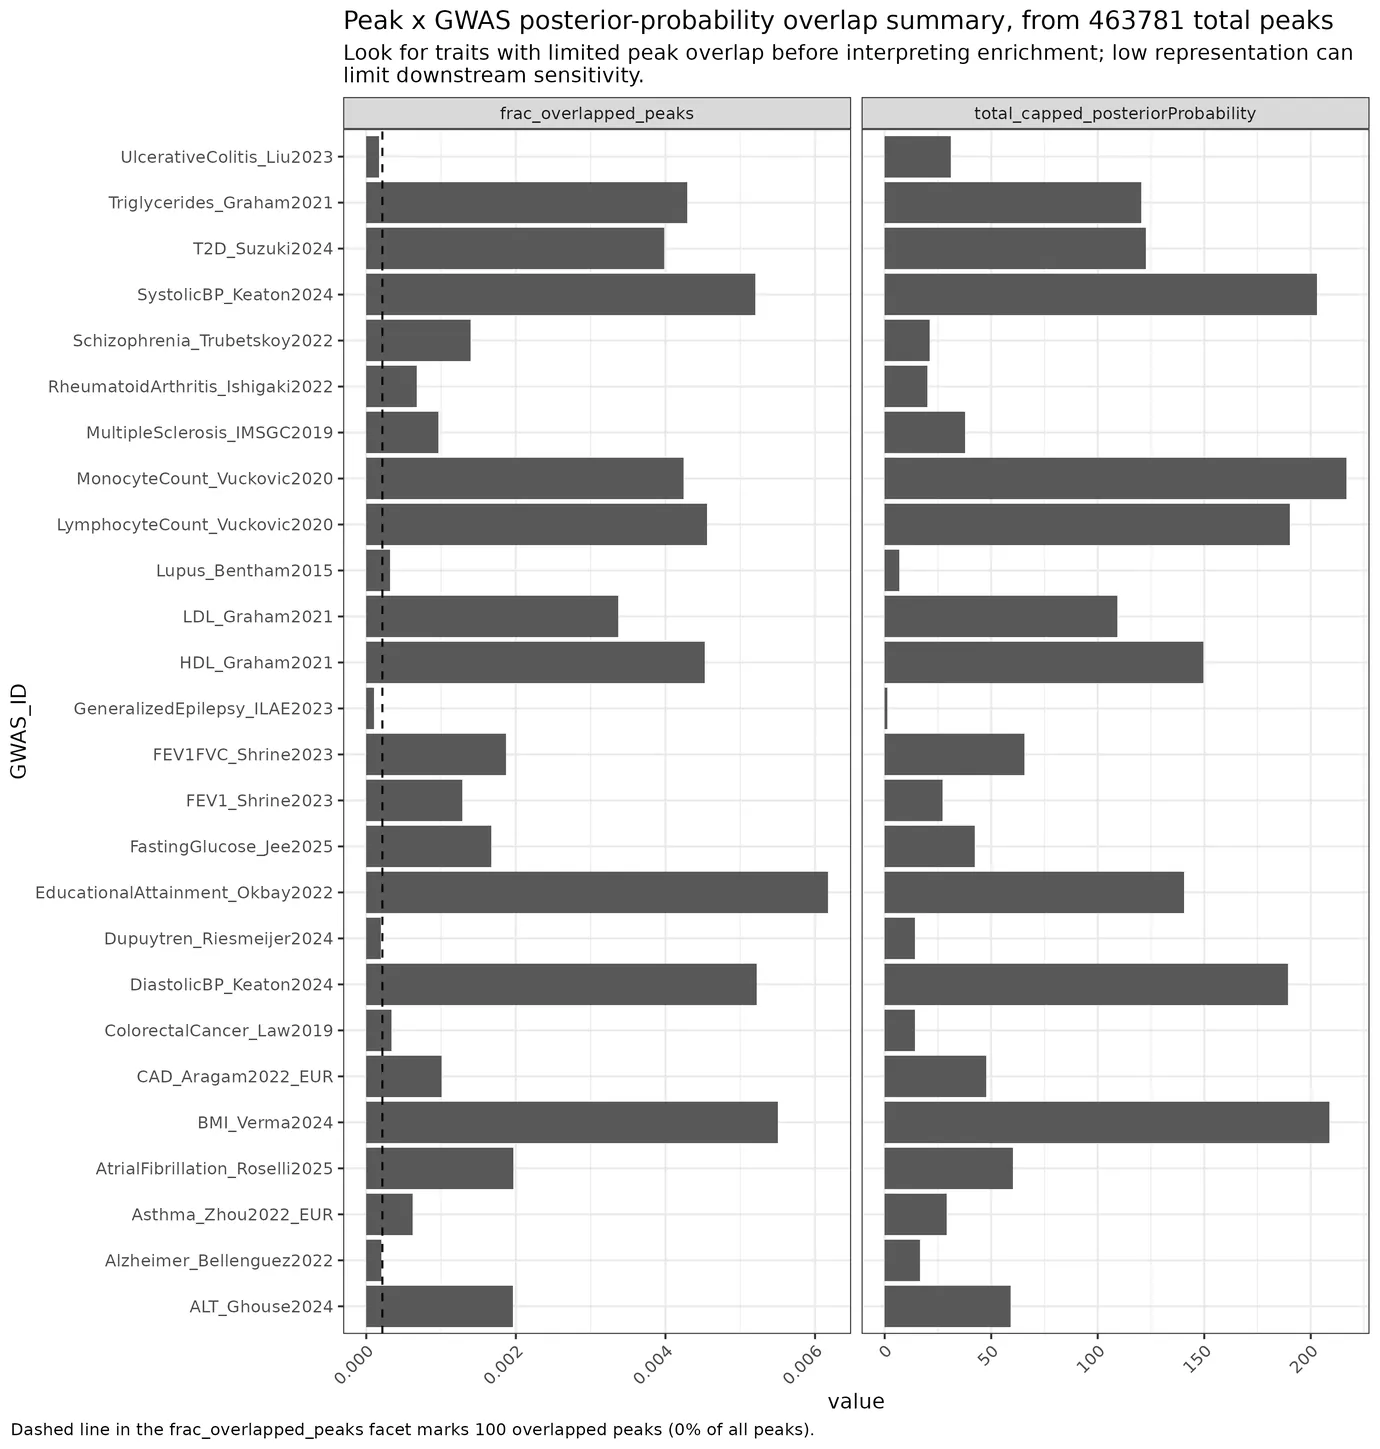
Plot summary bar plot of capped summed SNP PPs within peaks and save to file. GWAS_peak_weights_barplot.genetic_enrichment
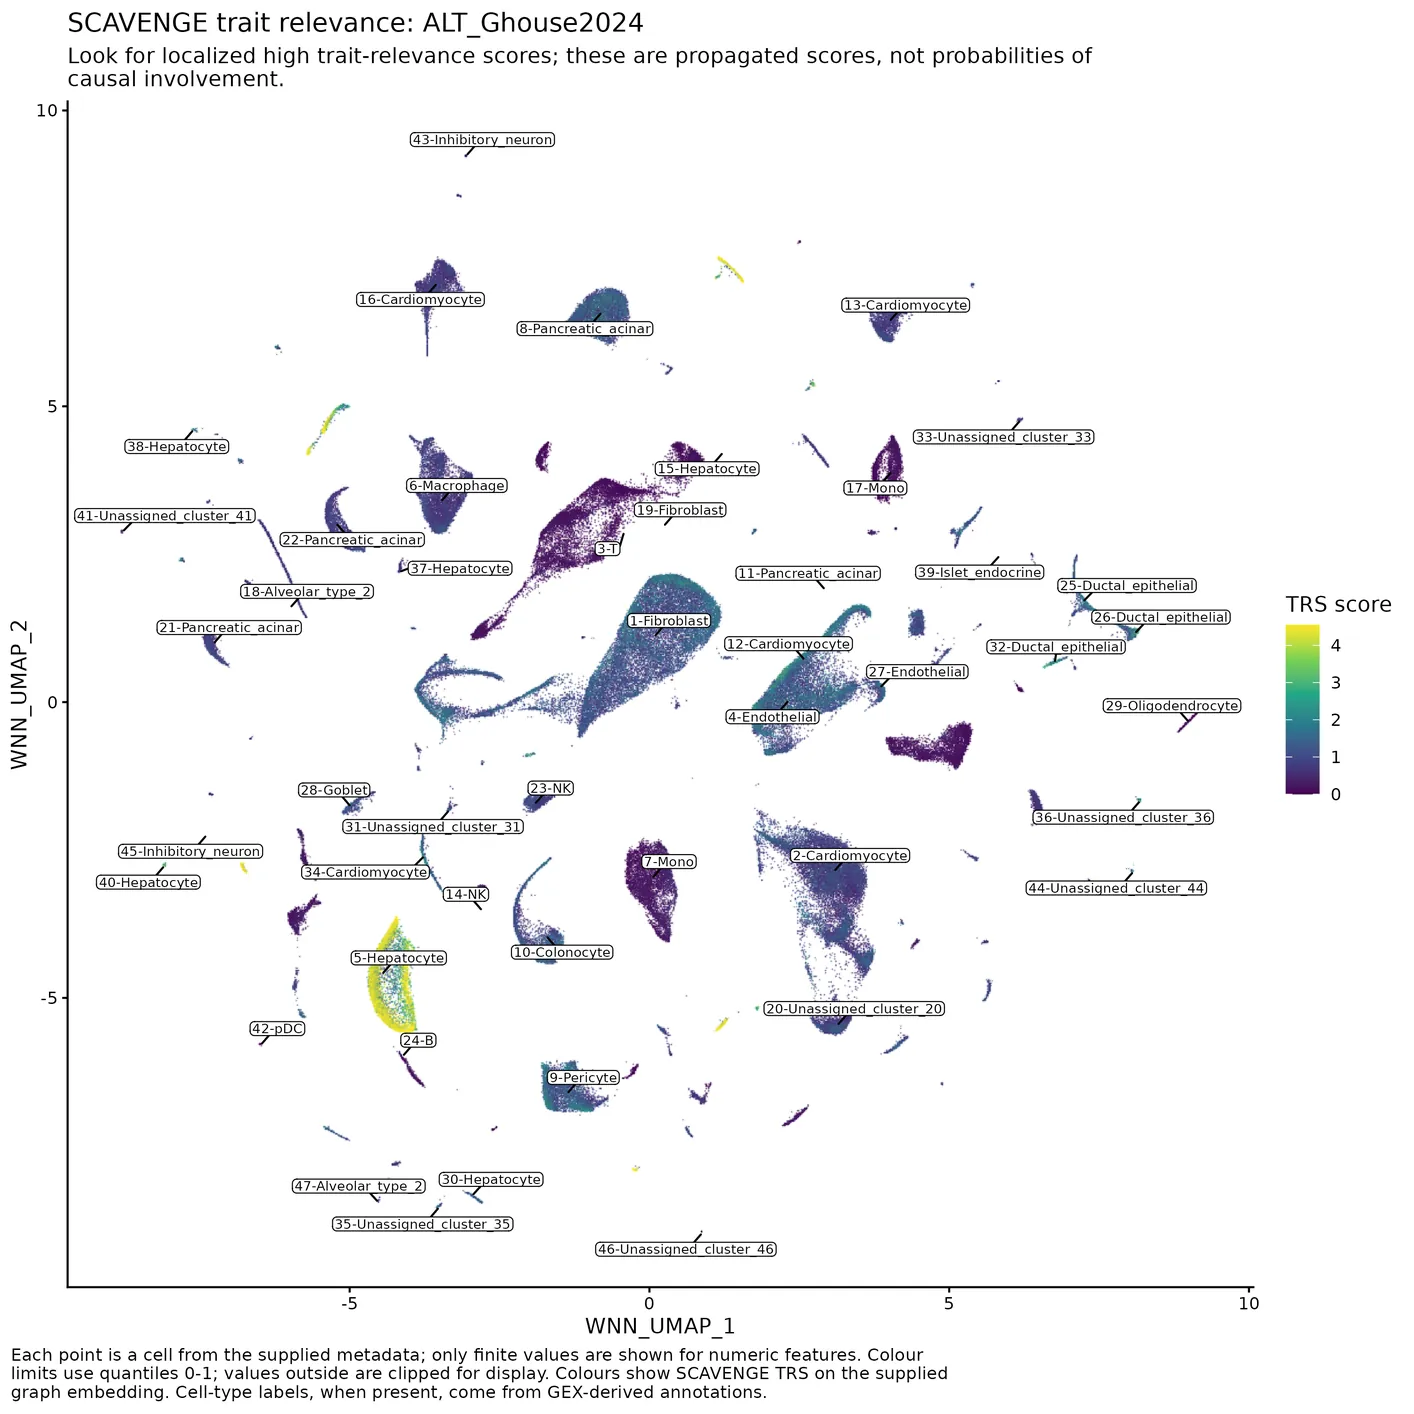
Plot one GWAS SCAVENGE TRS branch on the graph UMAP and save to file. TRS_UMAPs.WNN_harmony_SNN.SCAVENGE.single_nucleus.genetic_enrichment
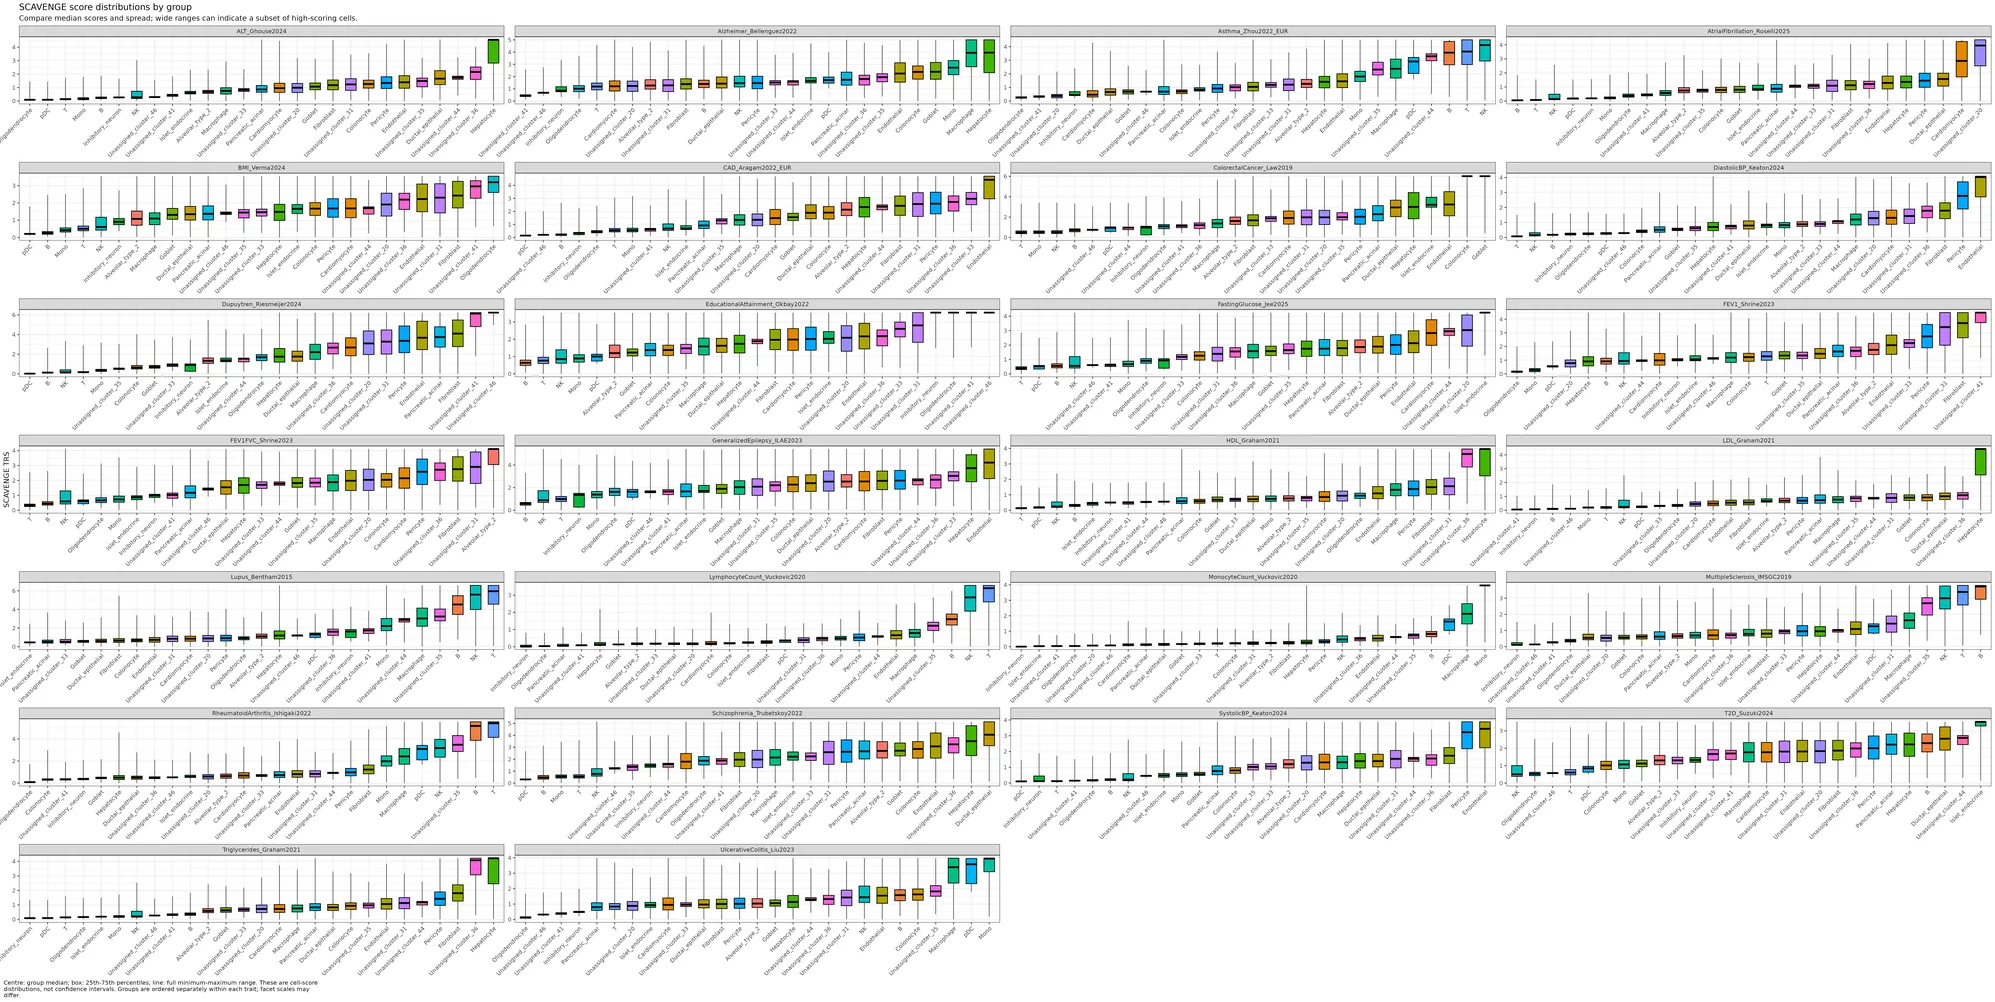
Plot per-group SCAVENGE TRS medians, interquartile ranges, and full ranges. TRS_cluster_summary_plot.WNN_harmony_SNN.SCAVENGE.single_nucleus.genetic_enrichment
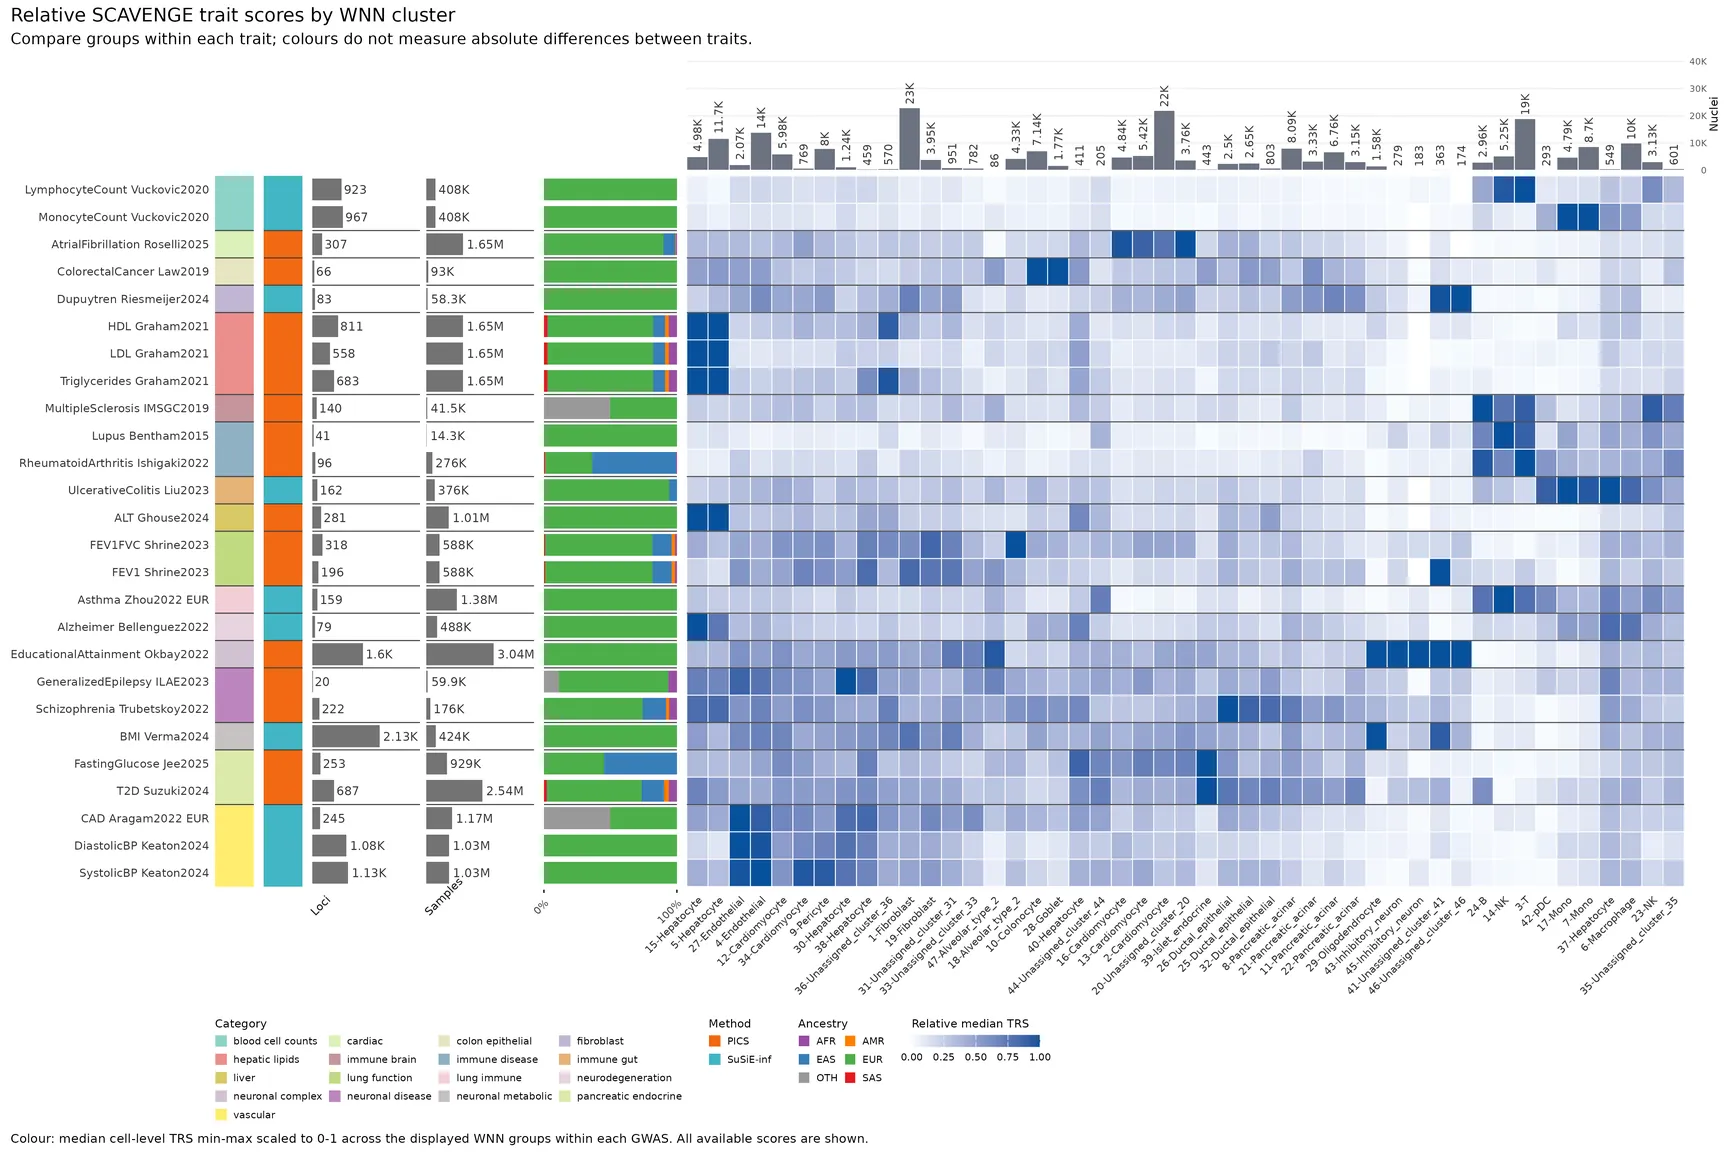
Save scaled median SCAVENGE TRS by WNN clusters. median_by_clusters_scaled.TRS_heatmap.WNN_harmony_SNN.SCAVENGE.single_nucleus.genetic_enrichment
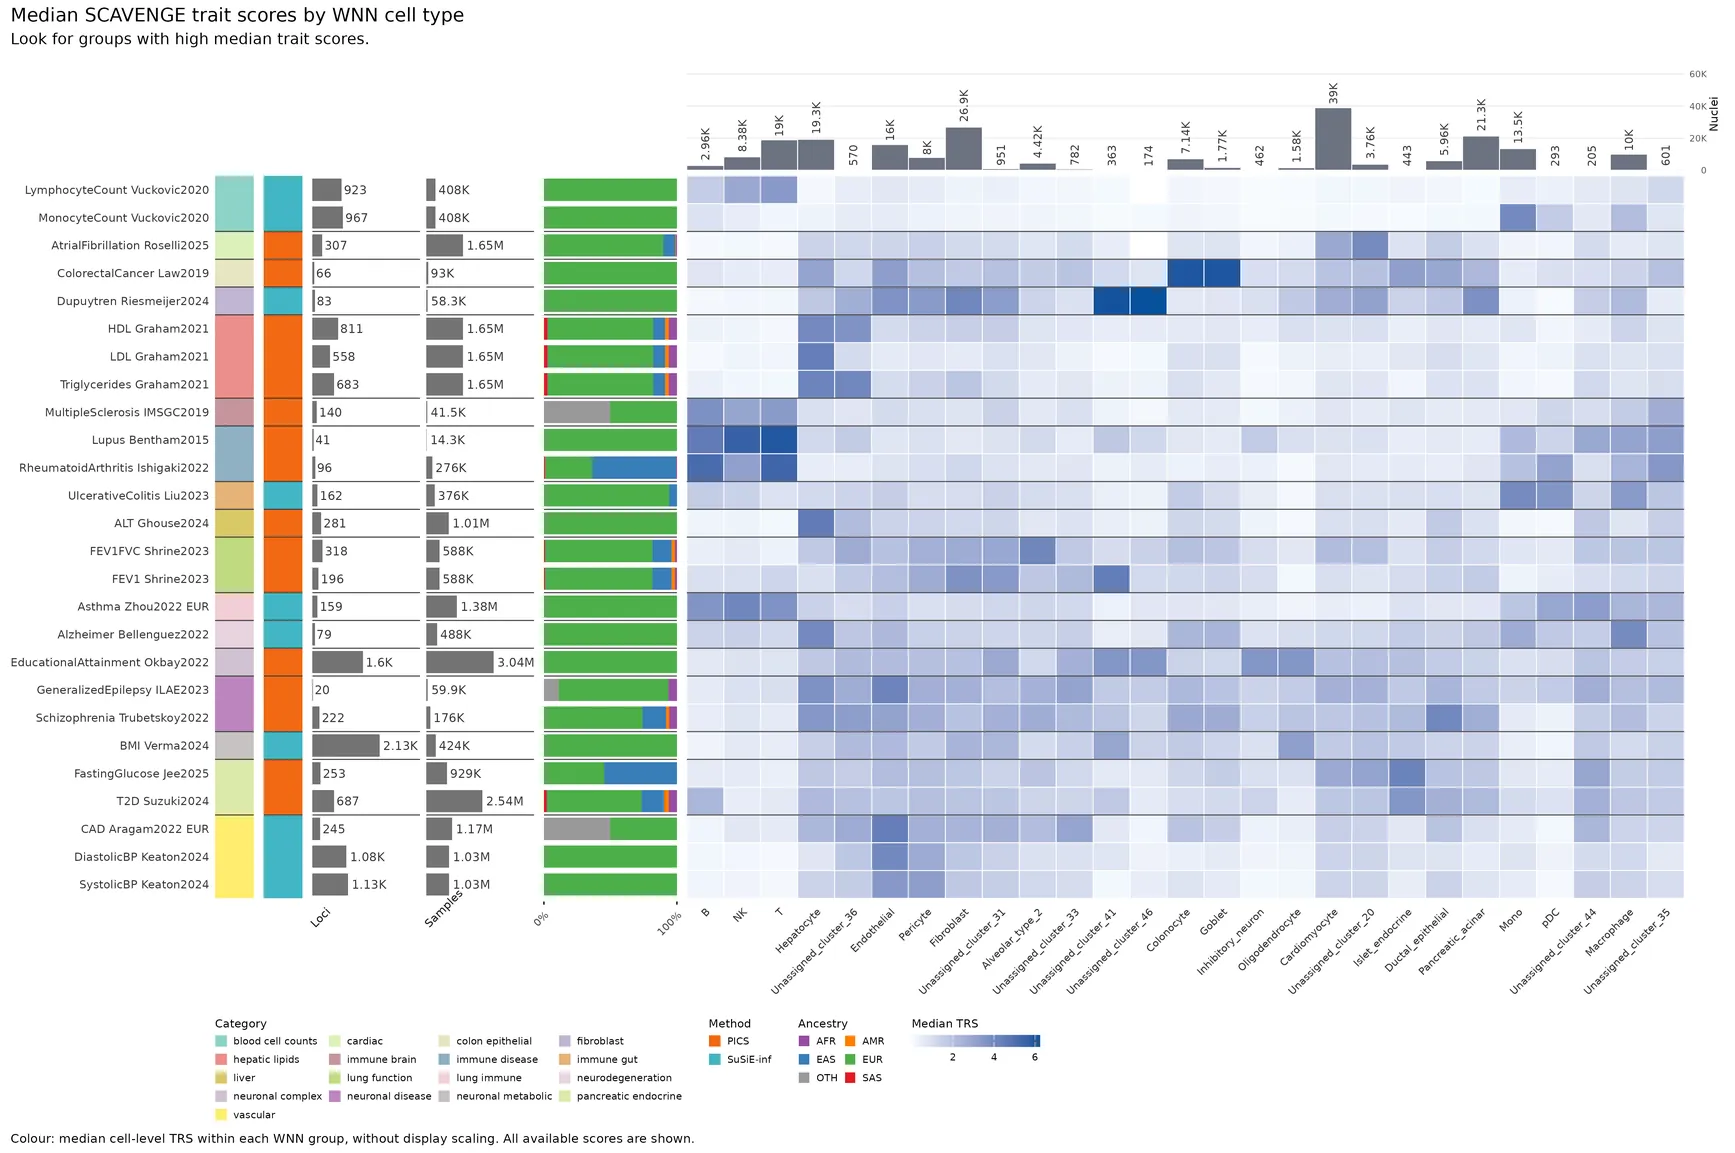
Save unscaled median SCAVENGE TRS by WNN cell types. median_by_cell_types_unscaled.TRS_heatmap.WNN_harmony_SNN.SCAVENGE.single_nucleus.genetic_enrichment
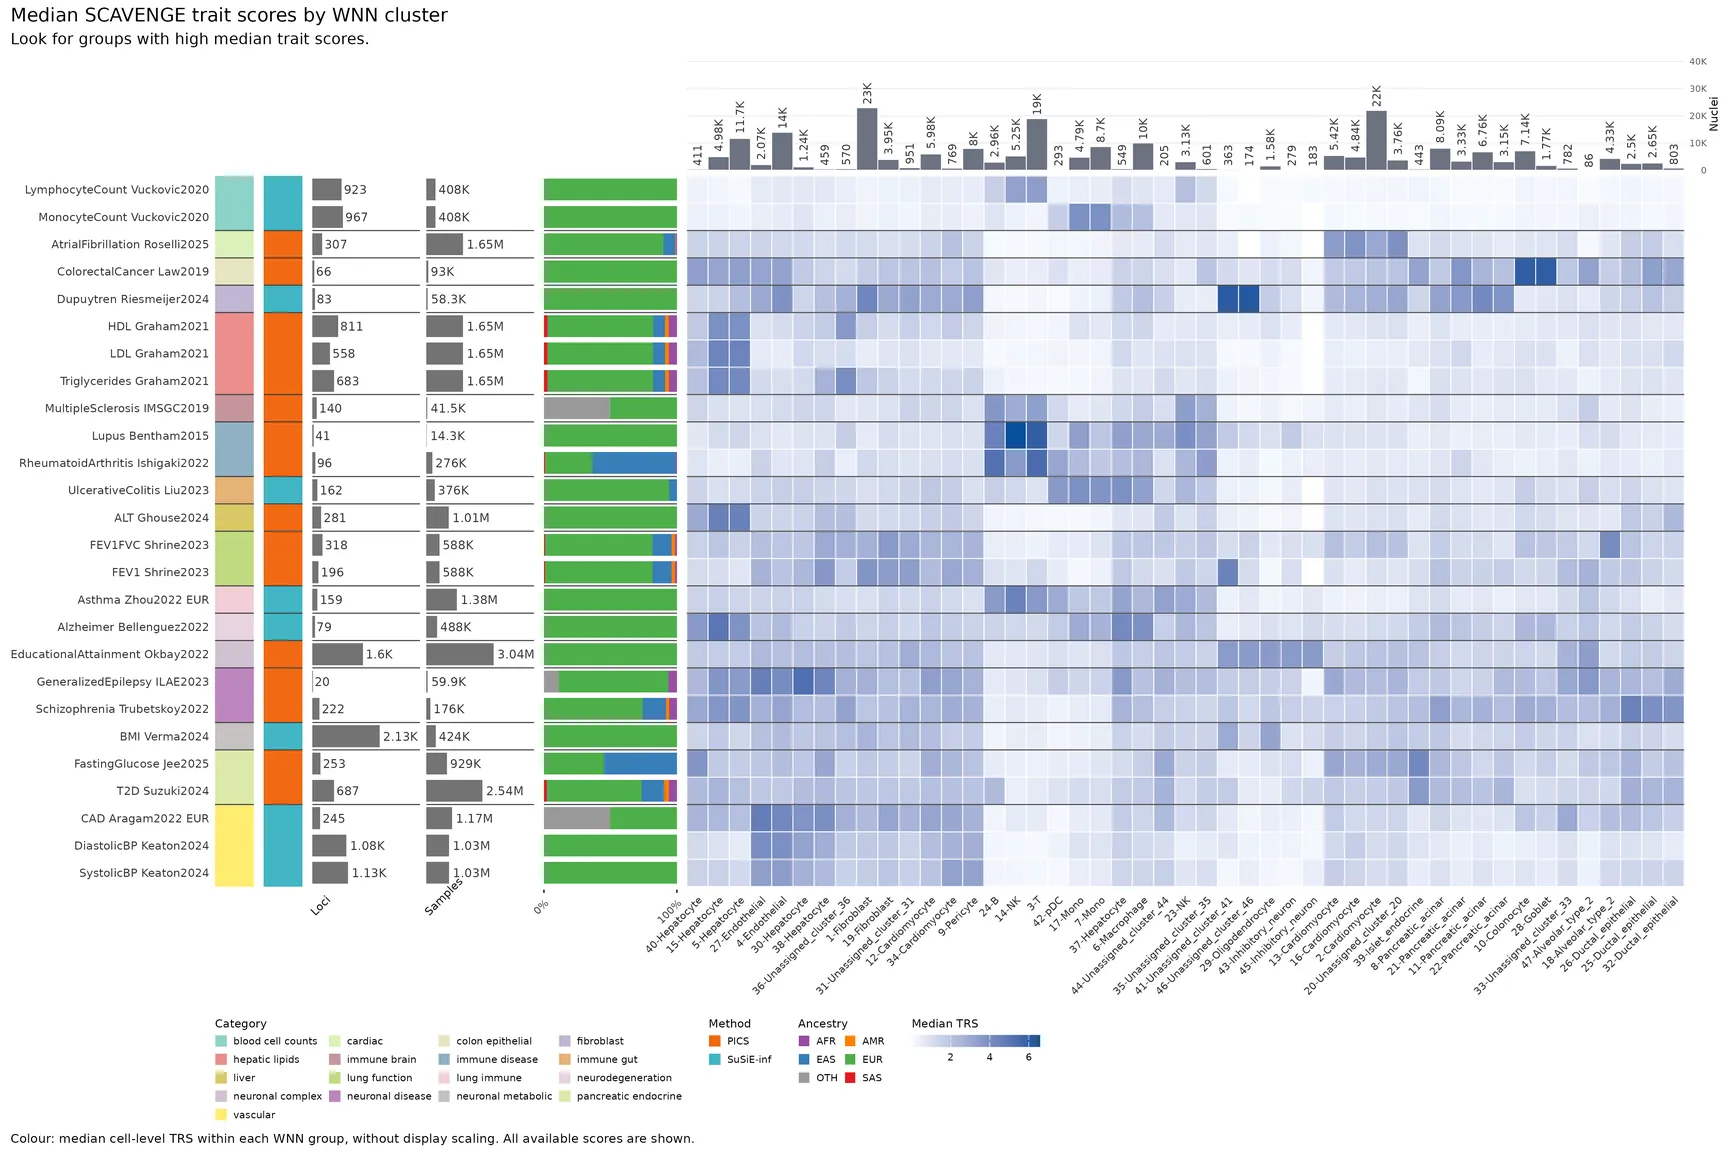
Save unscaled median SCAVENGE TRS by WNN clusters. median_by_clusters_unscaled.TRS_heatmap.WNN_harmony_SNN.SCAVENGE.single_nucleus.genetic_enrichment
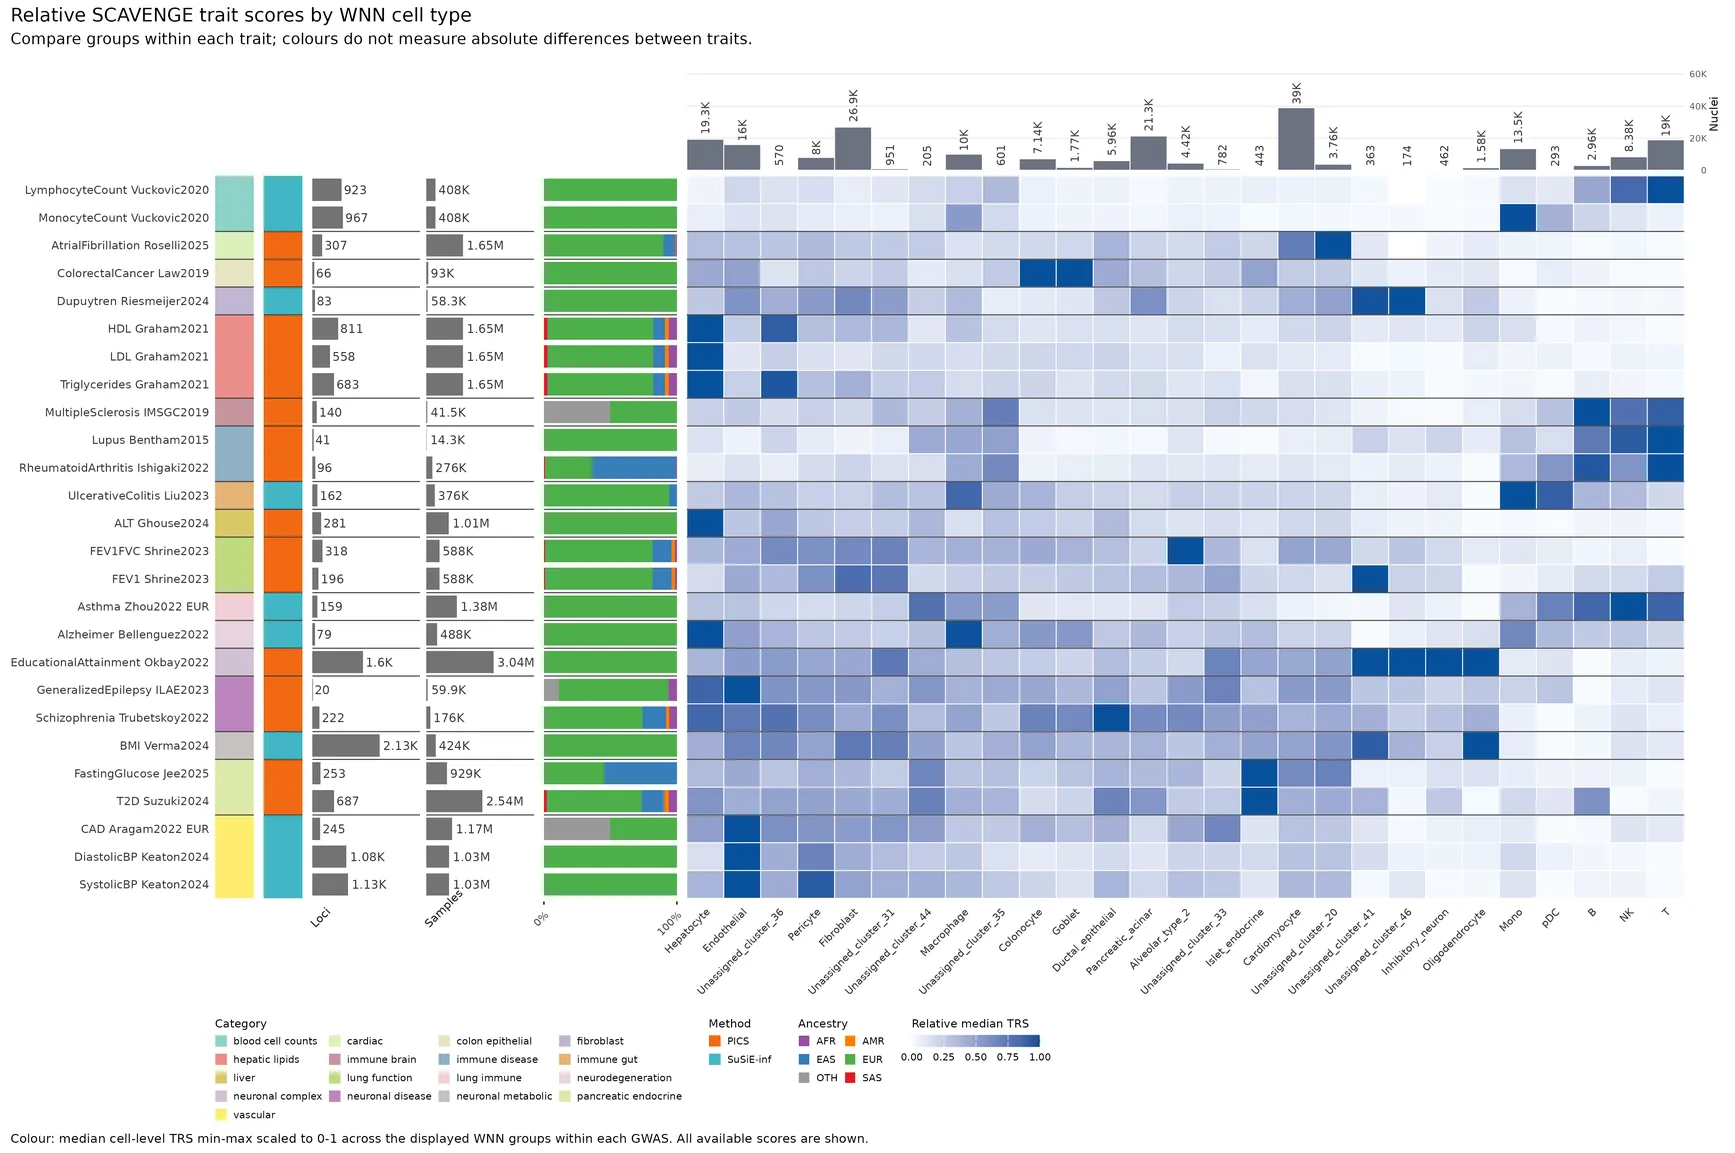
Save scaled median SCAVENGE TRS by WNN cell types. median_by_cell_types_scaled.TRS_heatmap.WNN_harmony_SNN.SCAVENGE.single_nucleus.genetic_enrichment
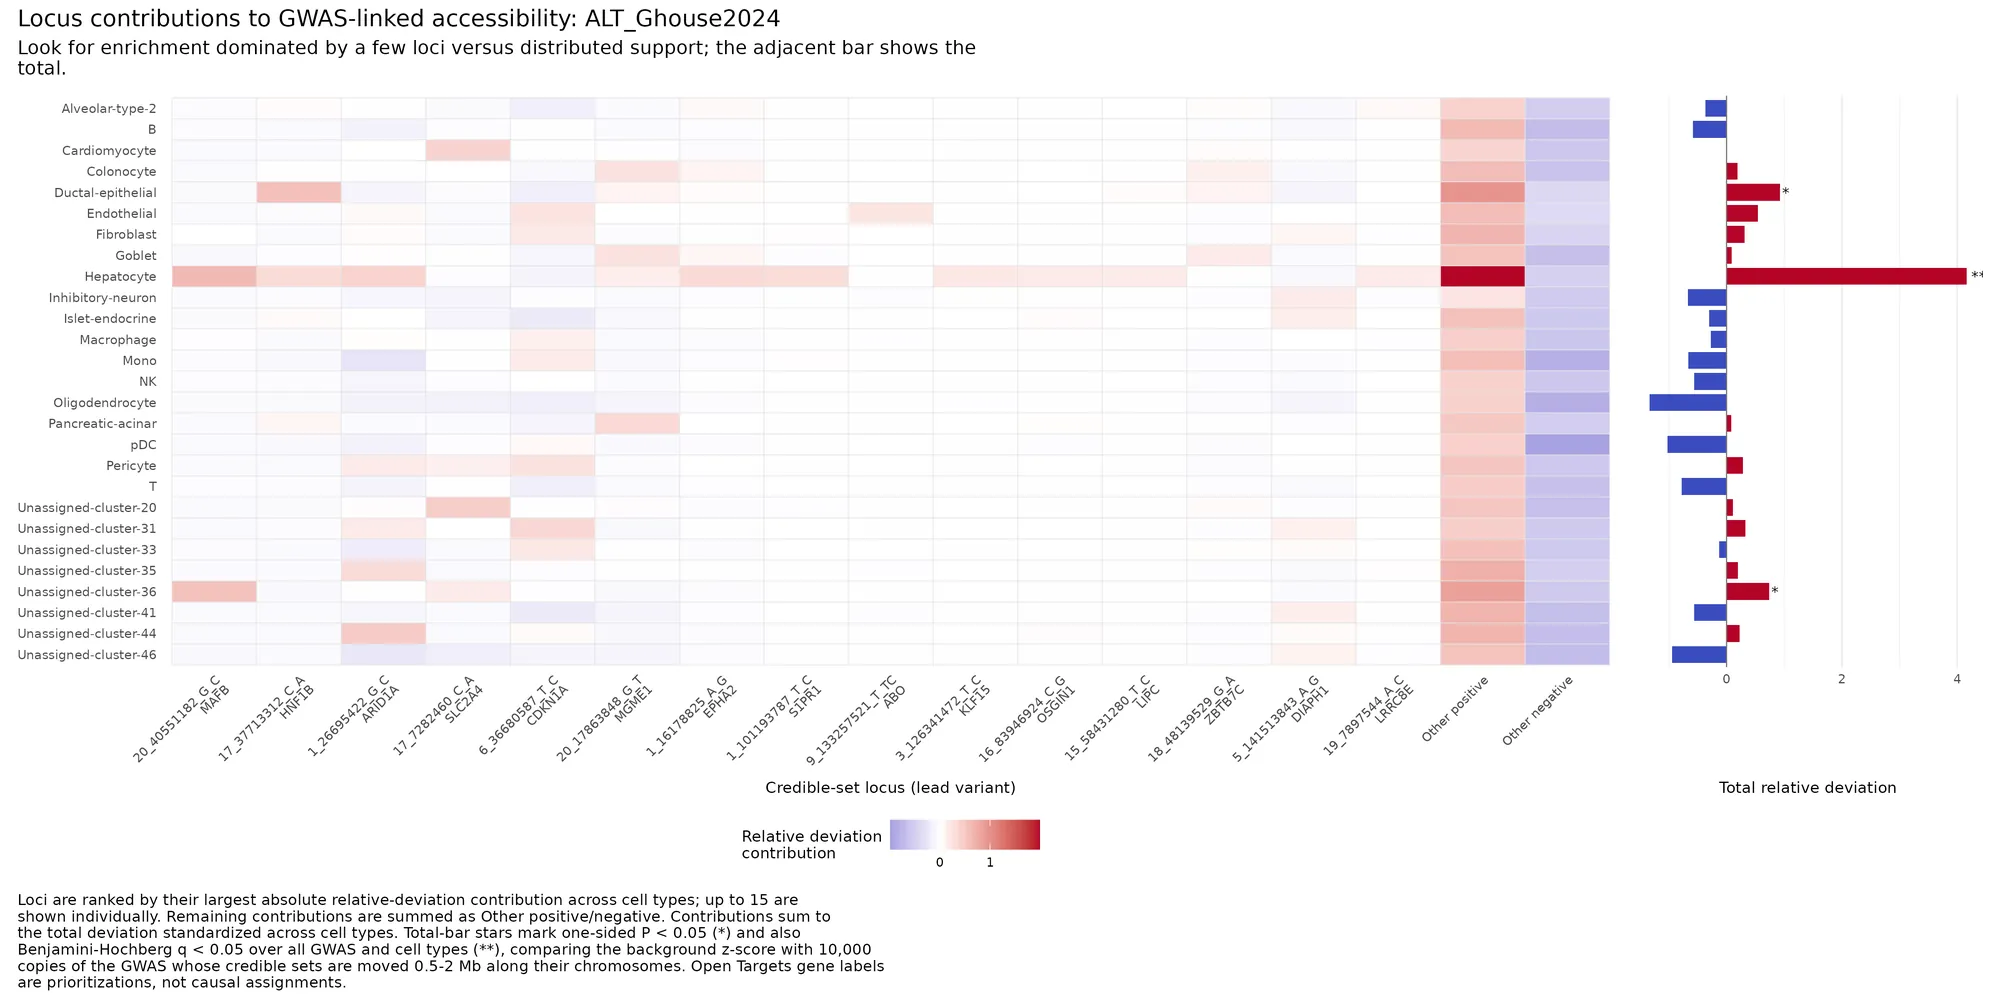
Save one cell-type-by-locus contribution heatmap per enabled GWAS. chromVAR_locus_contribution_per_GWAS_heatmaps.cell_type_pseudobulk.genetic_enrichment
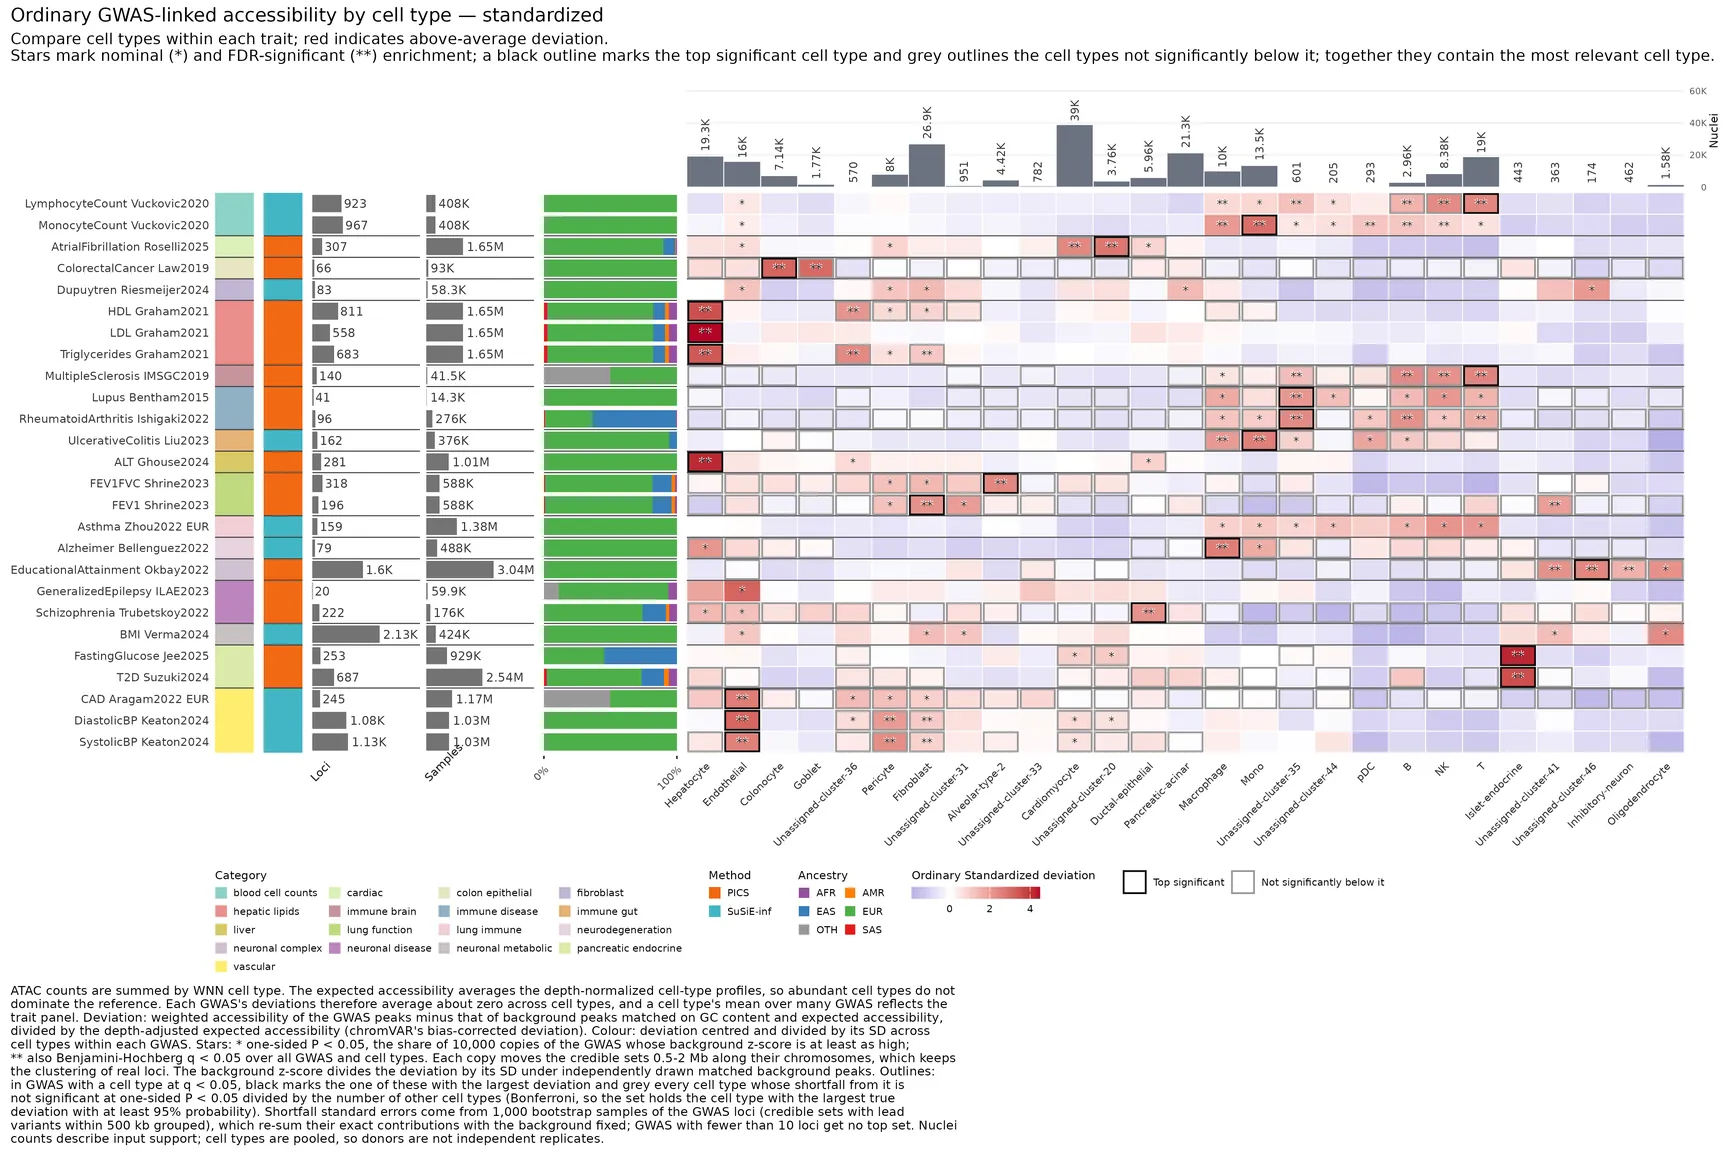
Save ordinary GWAS deviations standardized within each GWAS. raw_deviation_scaled.chromVAR_deviation_heatmaps.cell_type_pseudobulk.genetic_enrichment
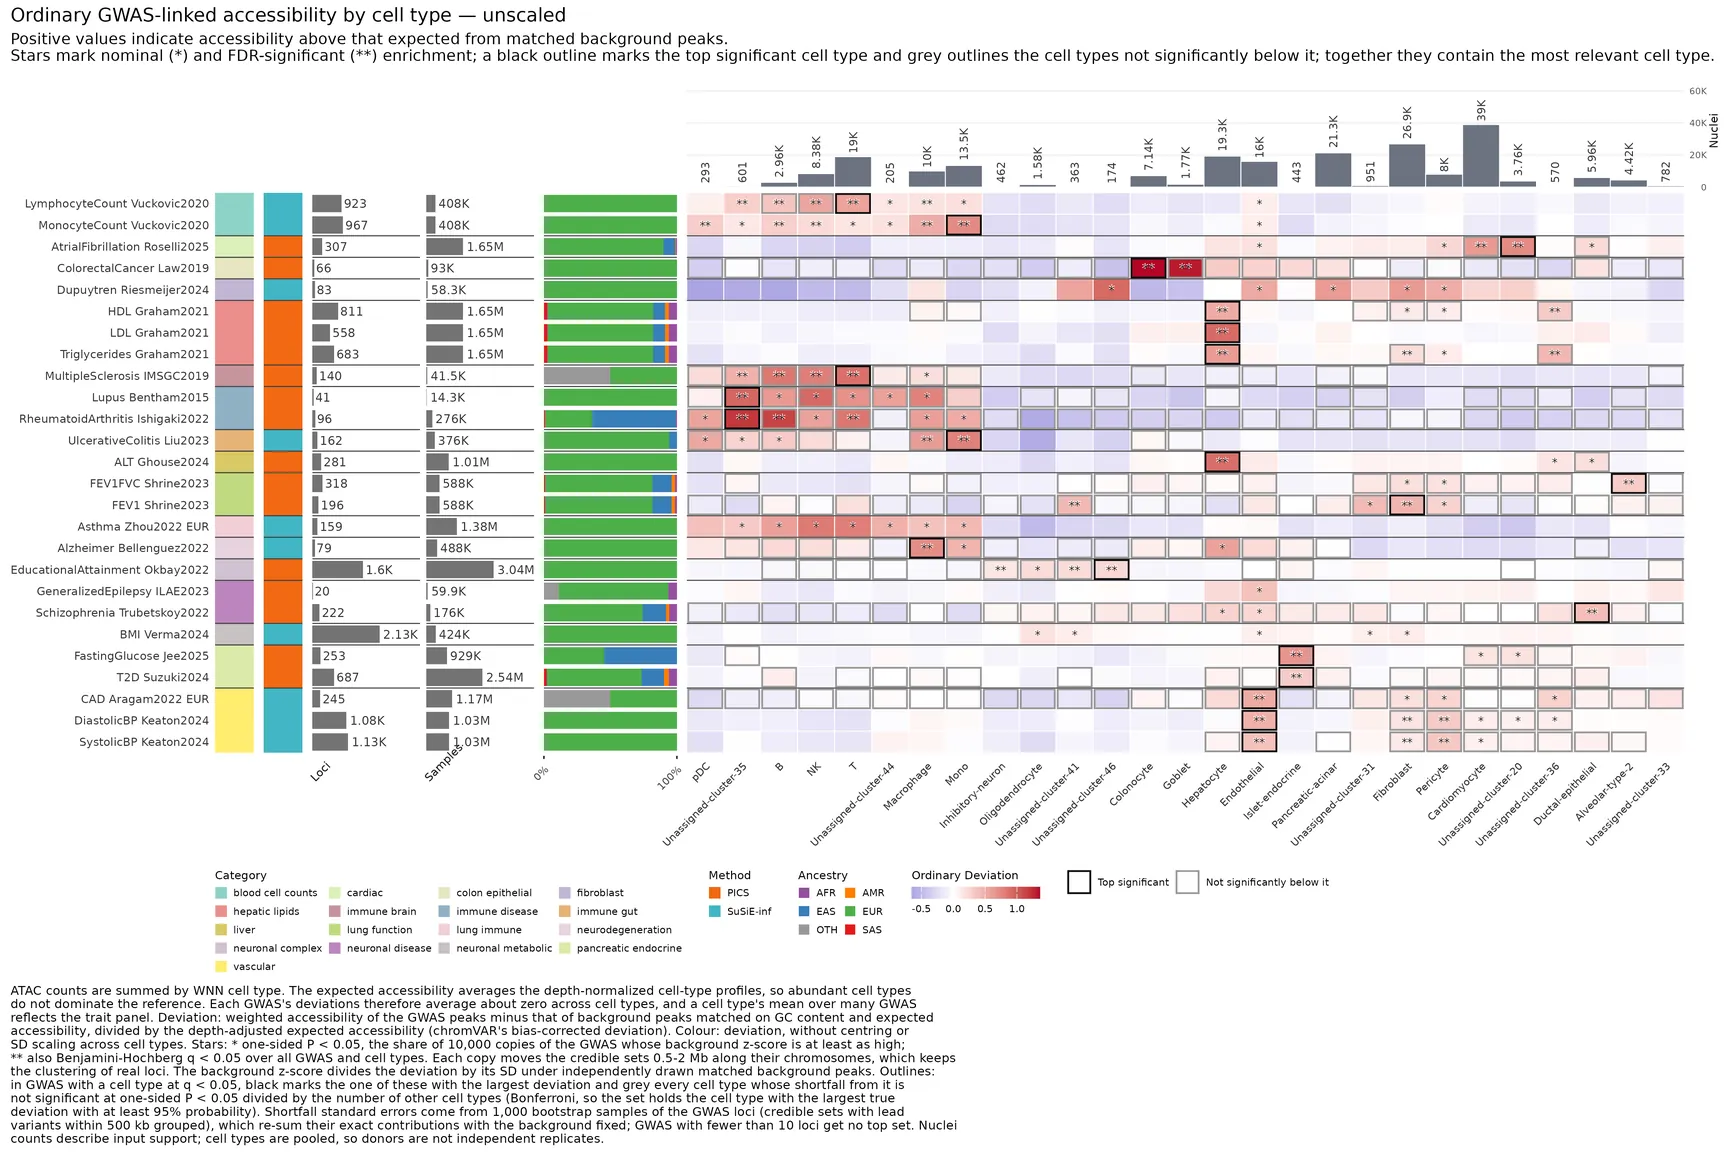
Save ordinary GWAS deviations without within-GWAS scaling. raw_deviation_unscaled.chromVAR_deviation_heatmaps.cell_type_pseudobulk.genetic_enrichment
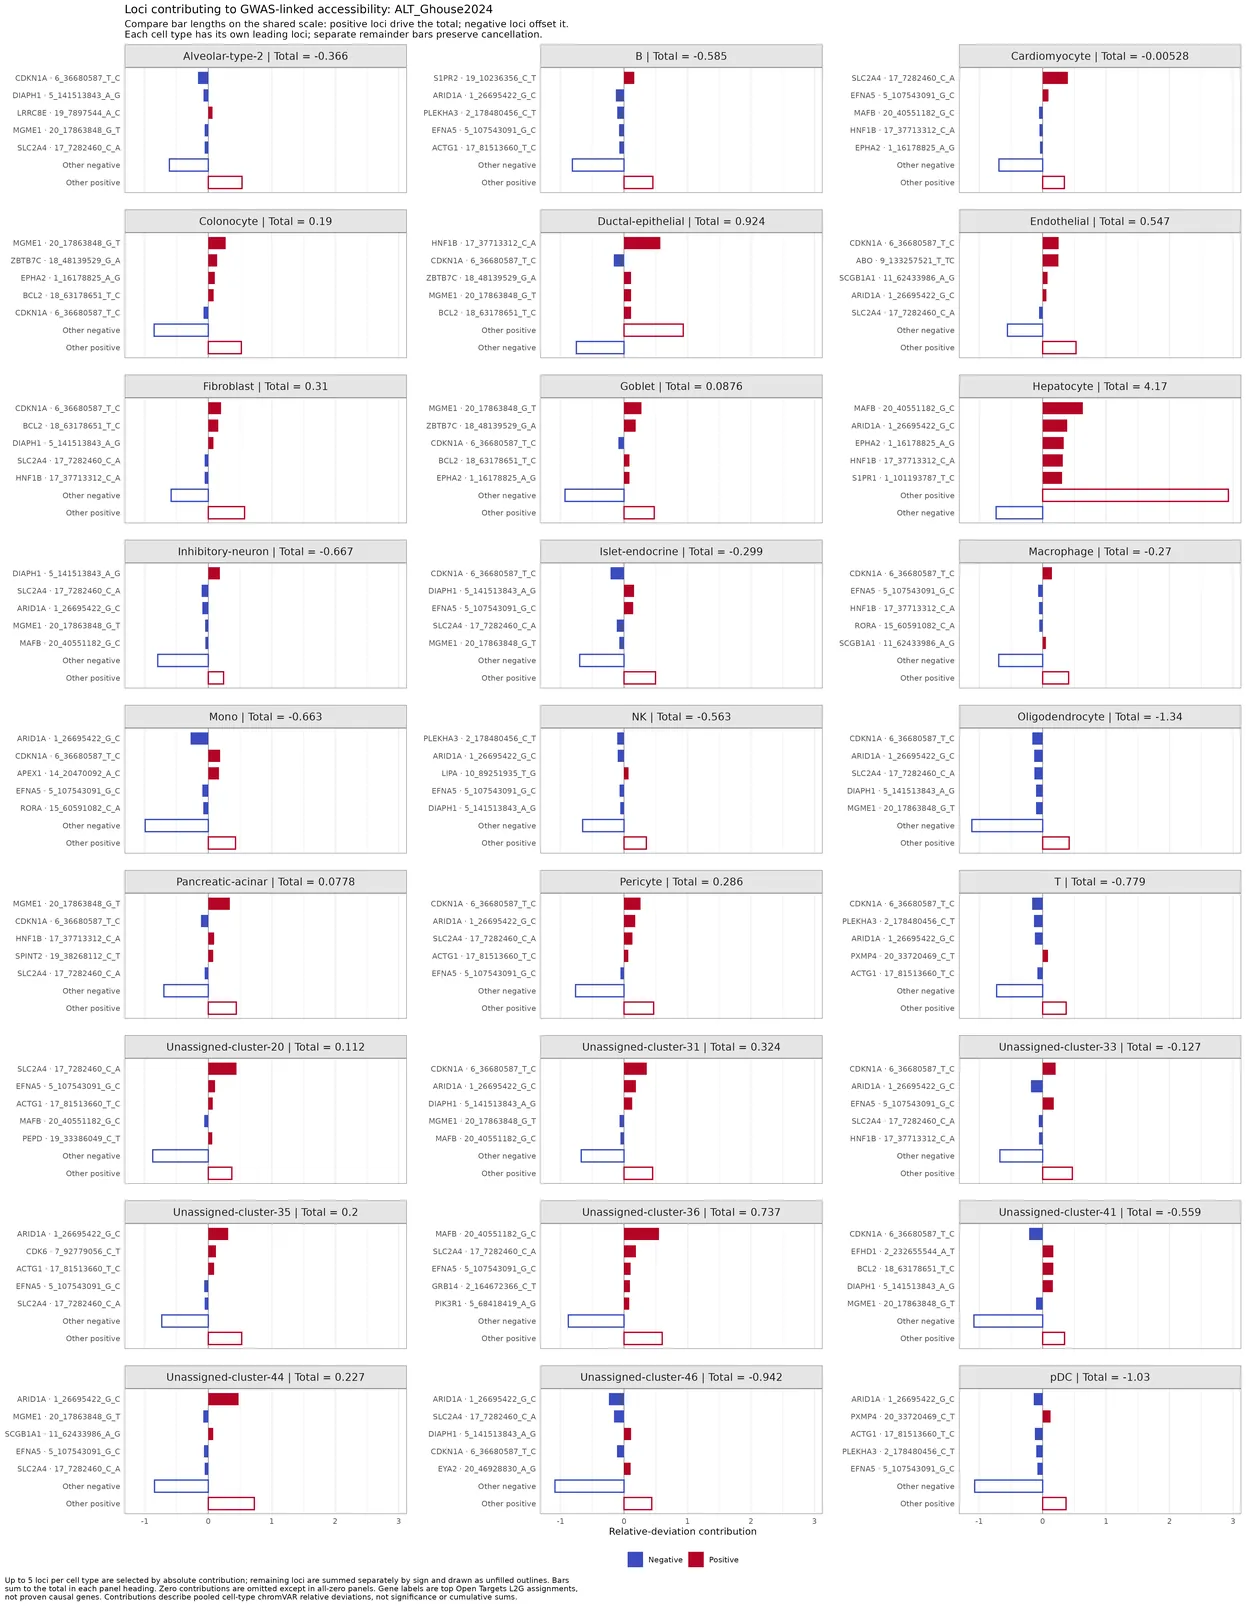
Save compact signed locus-contribution bars faceted by cell type for each GWAS. chromVAR_locus_contribution_per_GWAS_faceted_bars_plots.cell_type_pseudobulk.genetic_enrichment
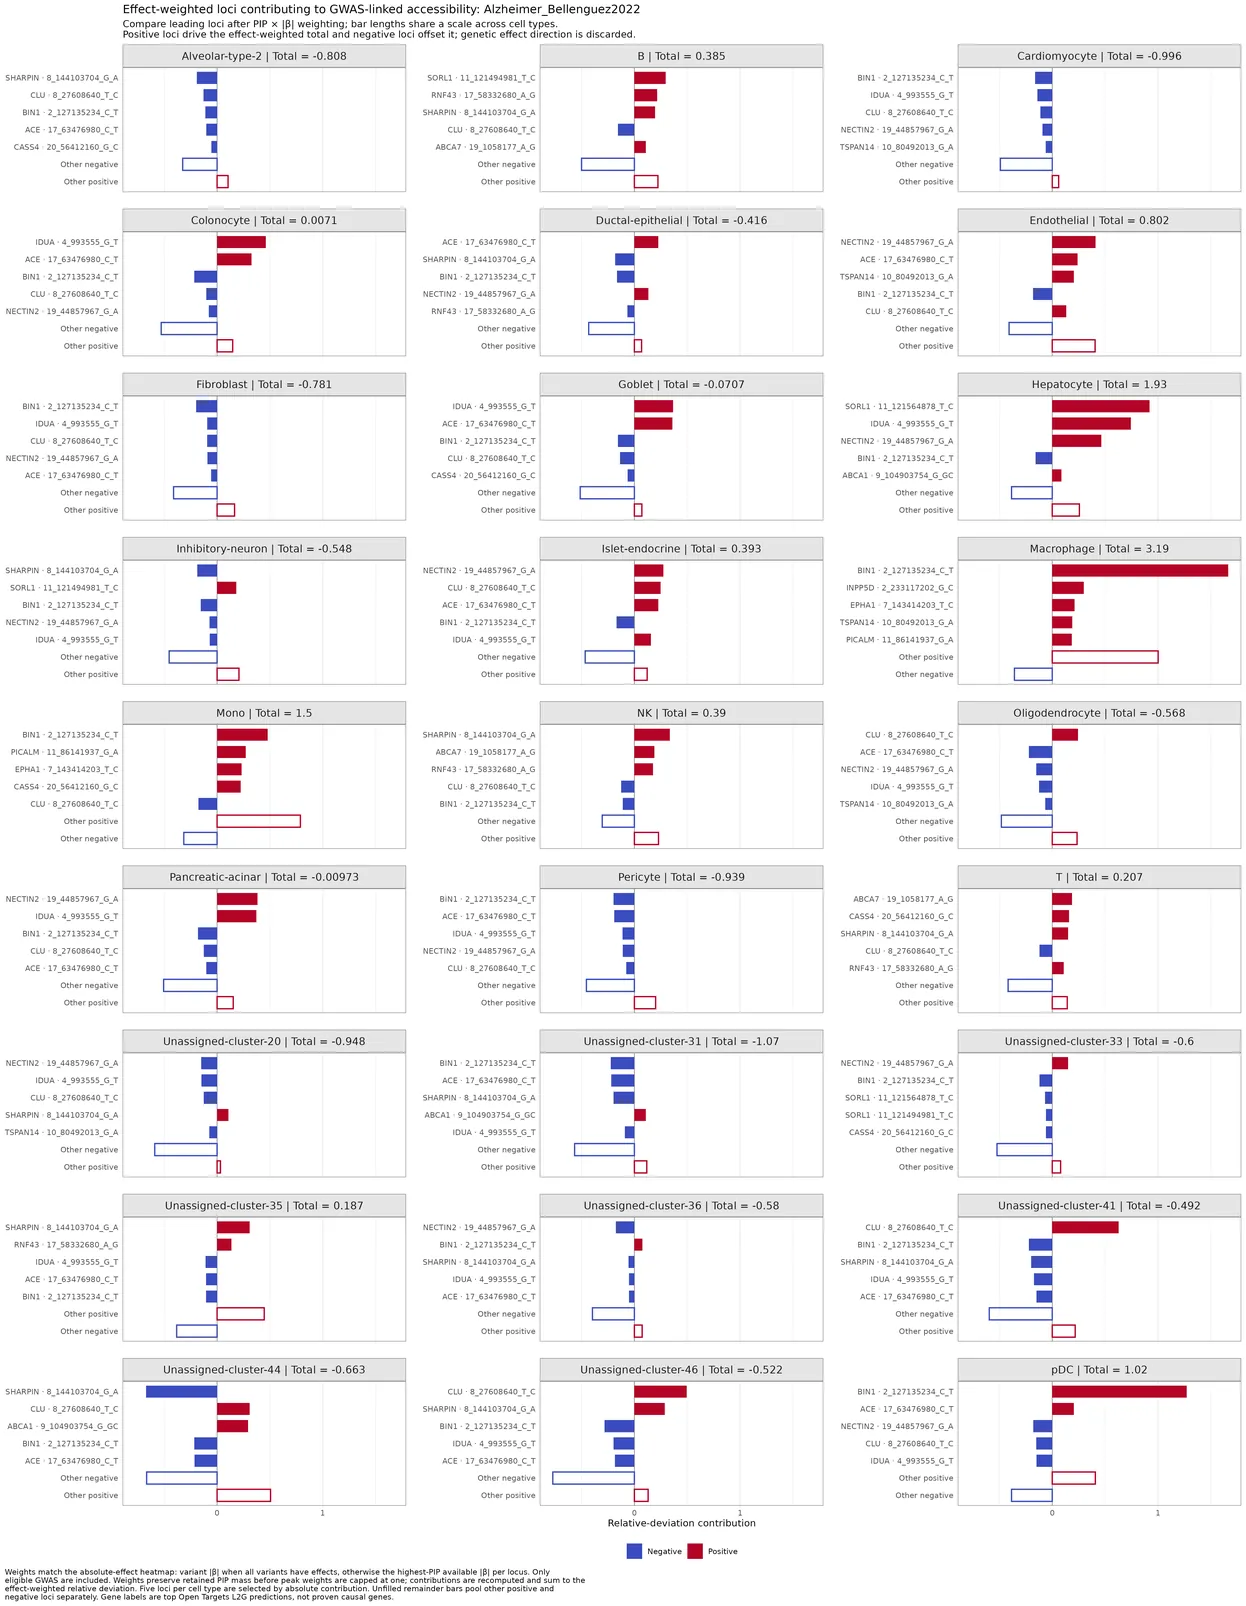
Save one faceted locus contribution figure per eligible GWAS using the absolute-effect heatmap weights. chromVAR_absolute_effect_locus_contribution_per_GWAS_faceted_bars_plots.cell_type_pseudobulk.genetic_enrichment
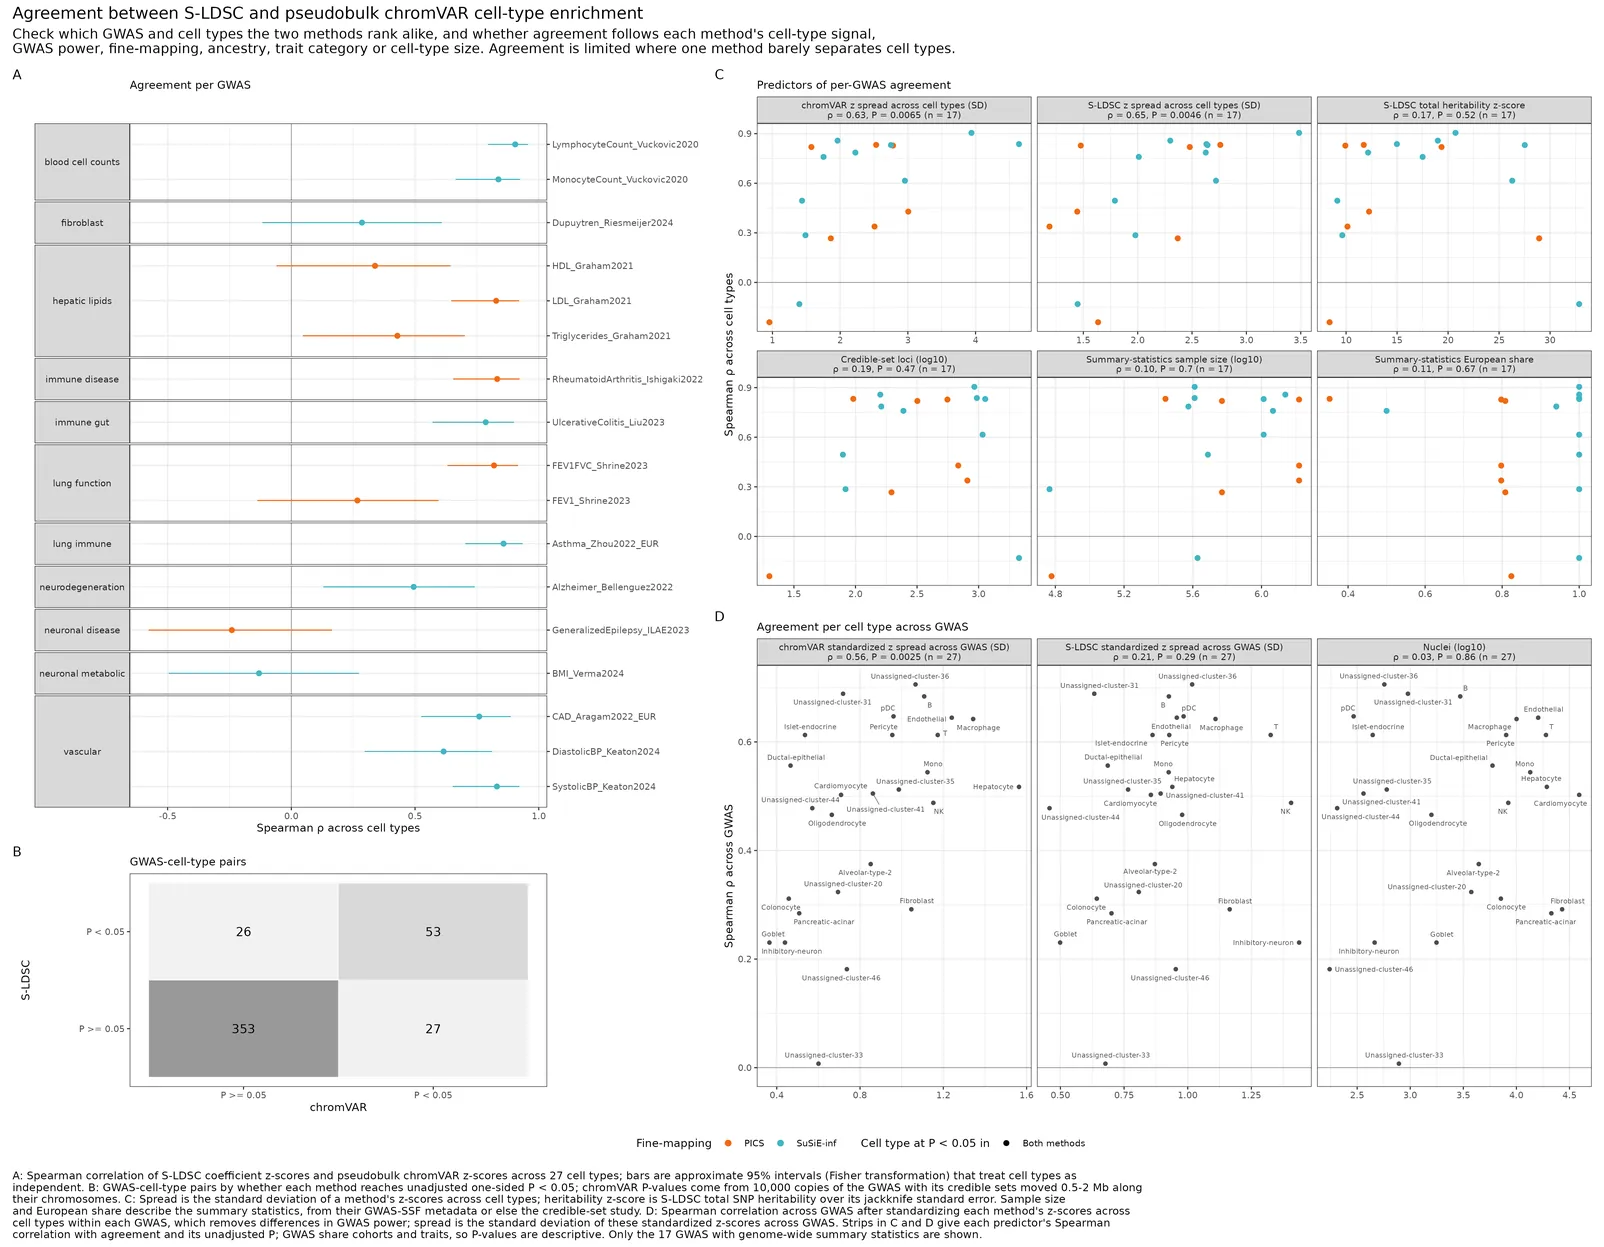
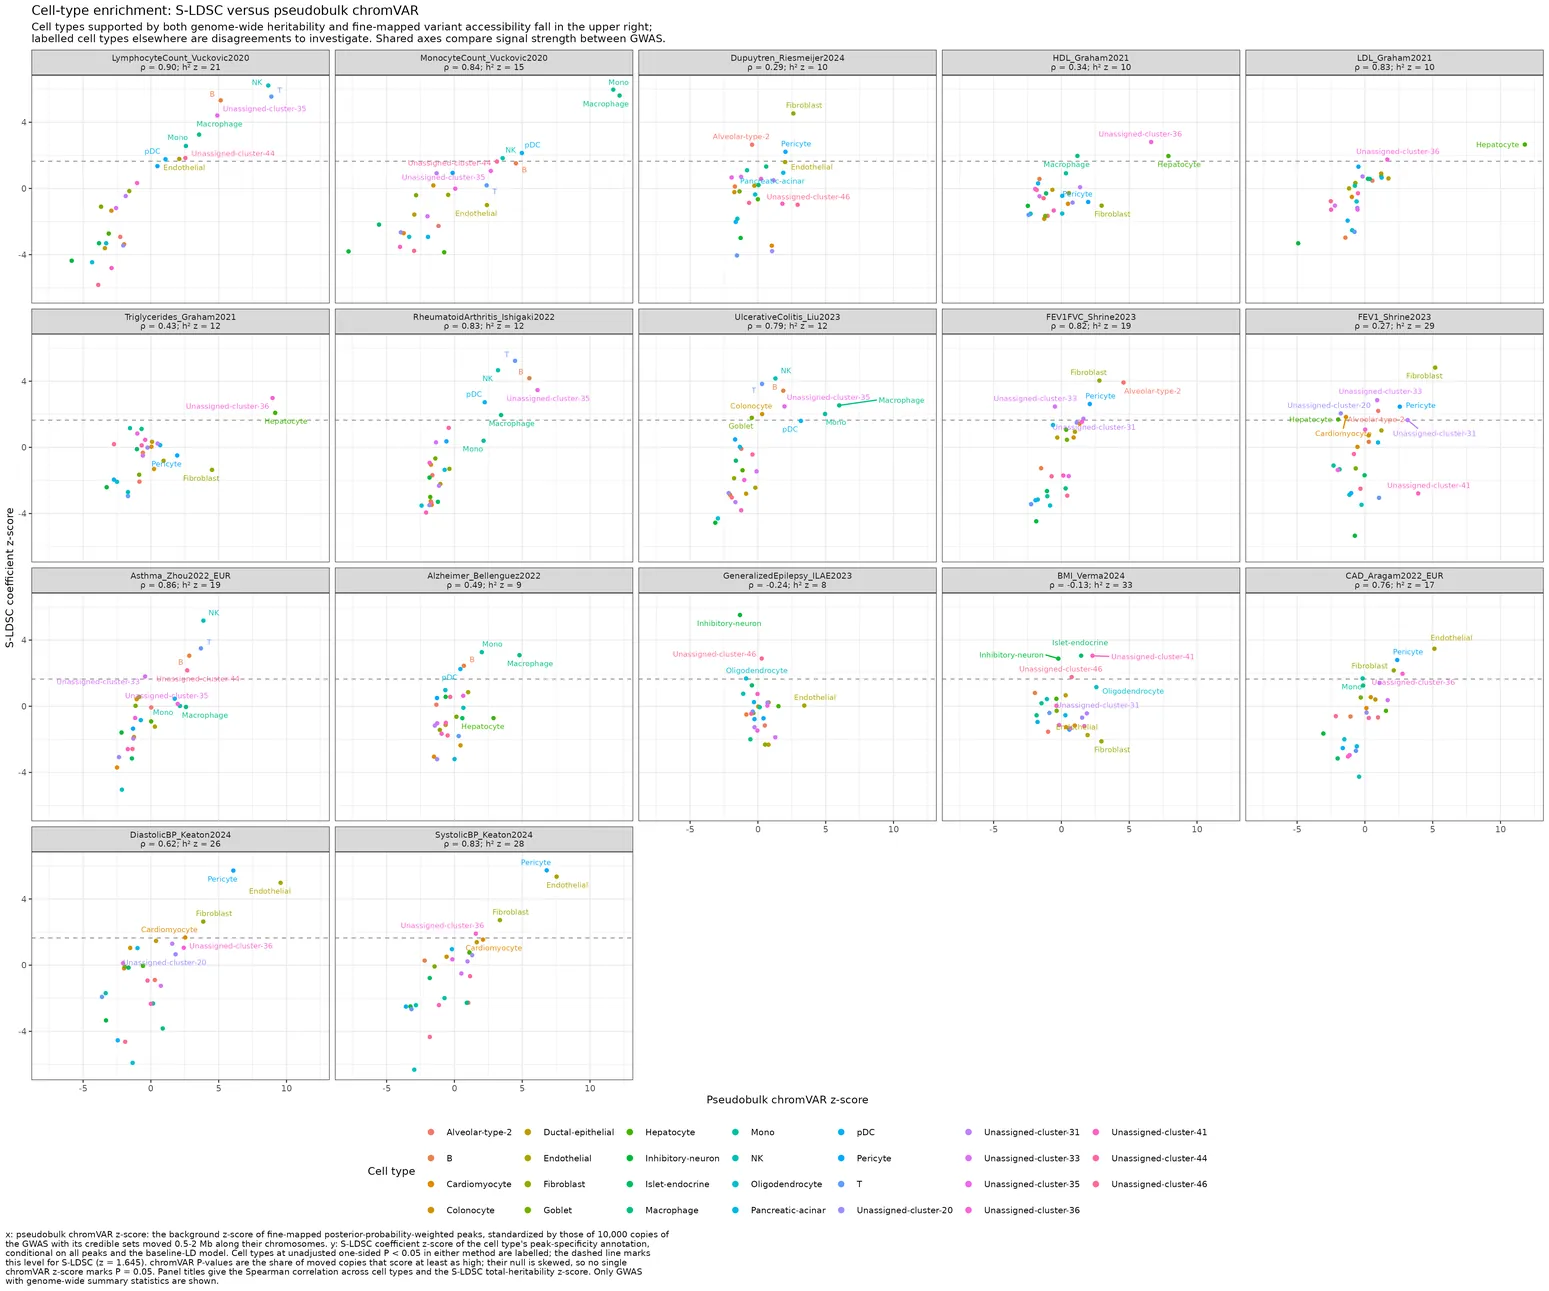
Save an overview of S-LDSC and pseudobulk chromVAR agreement per GWAS and per cell type against GWAS and cell-type predictors. SLDSC_chromVAR_agreement_plot.cell_type_pseudobulk.genetic_enrichment
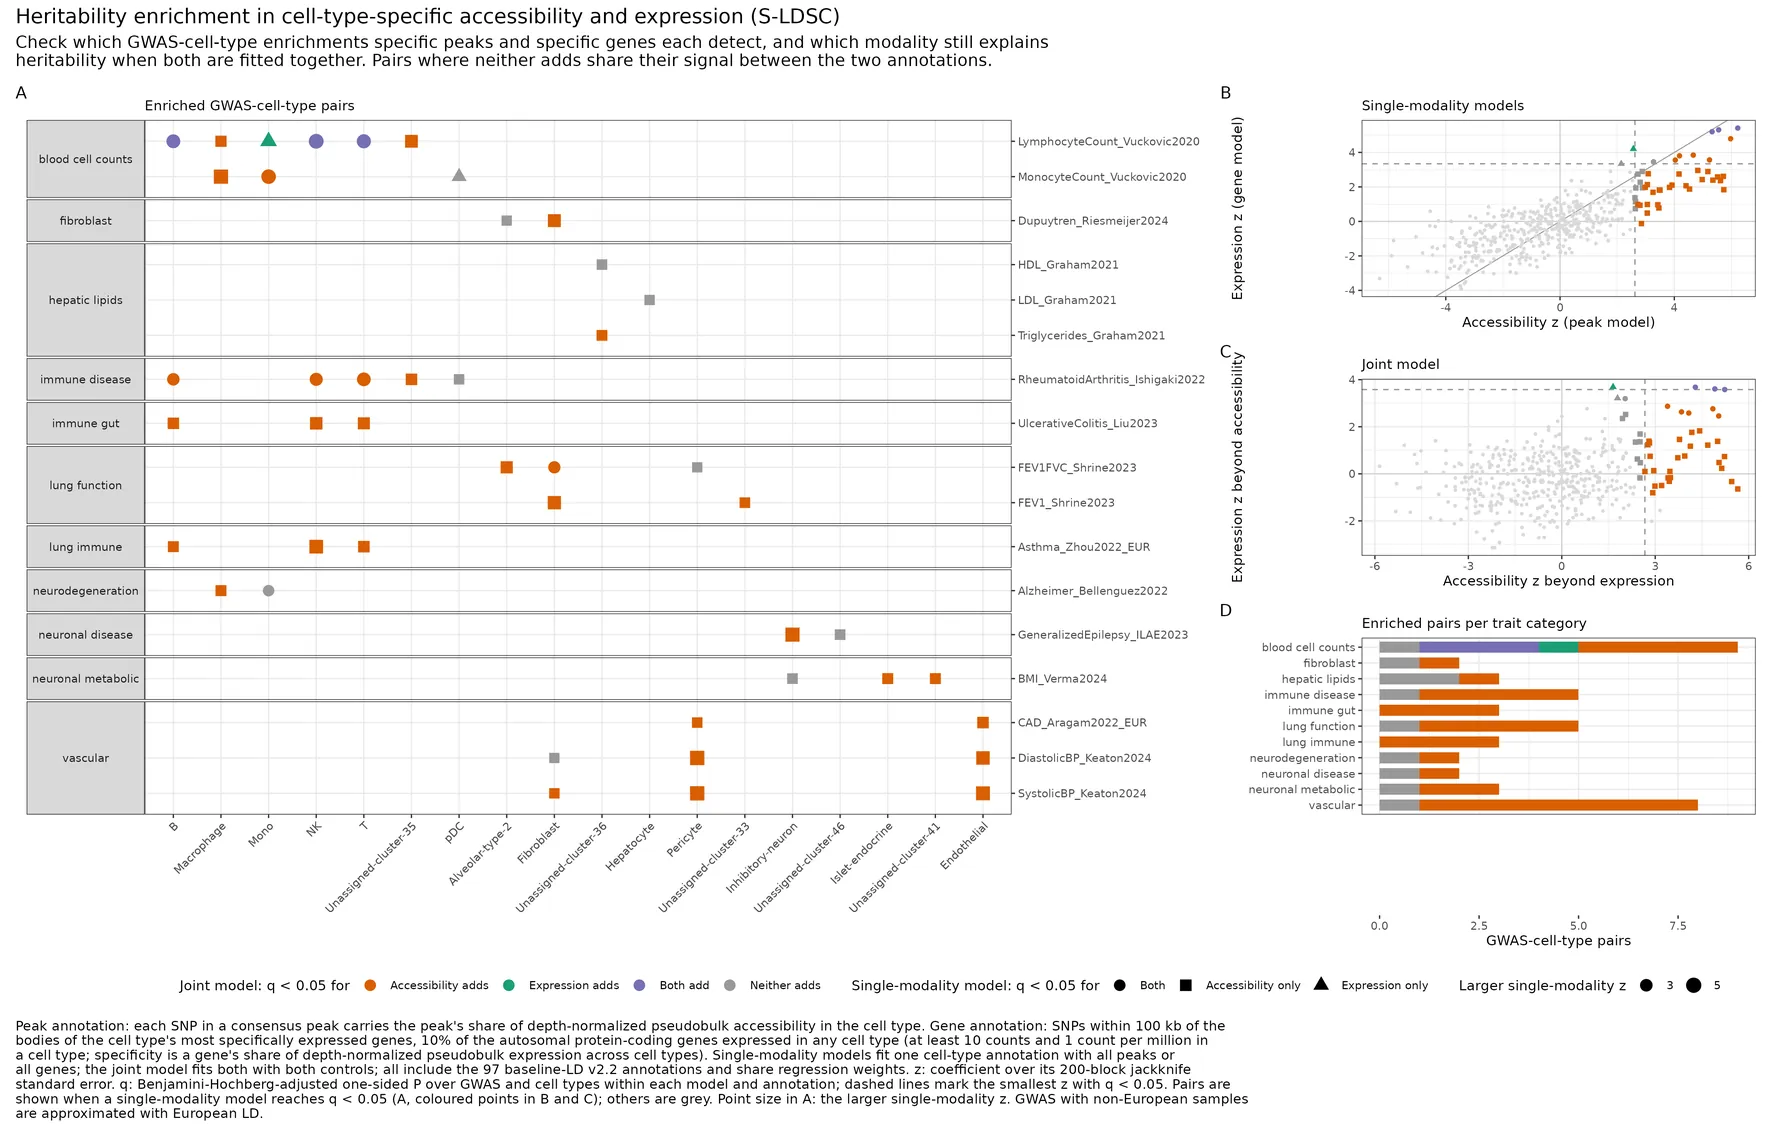
Save which enriched GWAS-cell-type pairs cell-type-specific accessibility and expression explain, alone and jointly, in S-LDSC. SLDSC_modality_comparison_plot.cell_type_pseudobulk.genetic_enrichment
Save per-GWAS scatter plots comparing S-LDSC and pseudobulk chromVAR cell-type z-scores. SLDSC_chromVAR_comparison_plot.cell_type_pseudobulk.genetic_enrichment
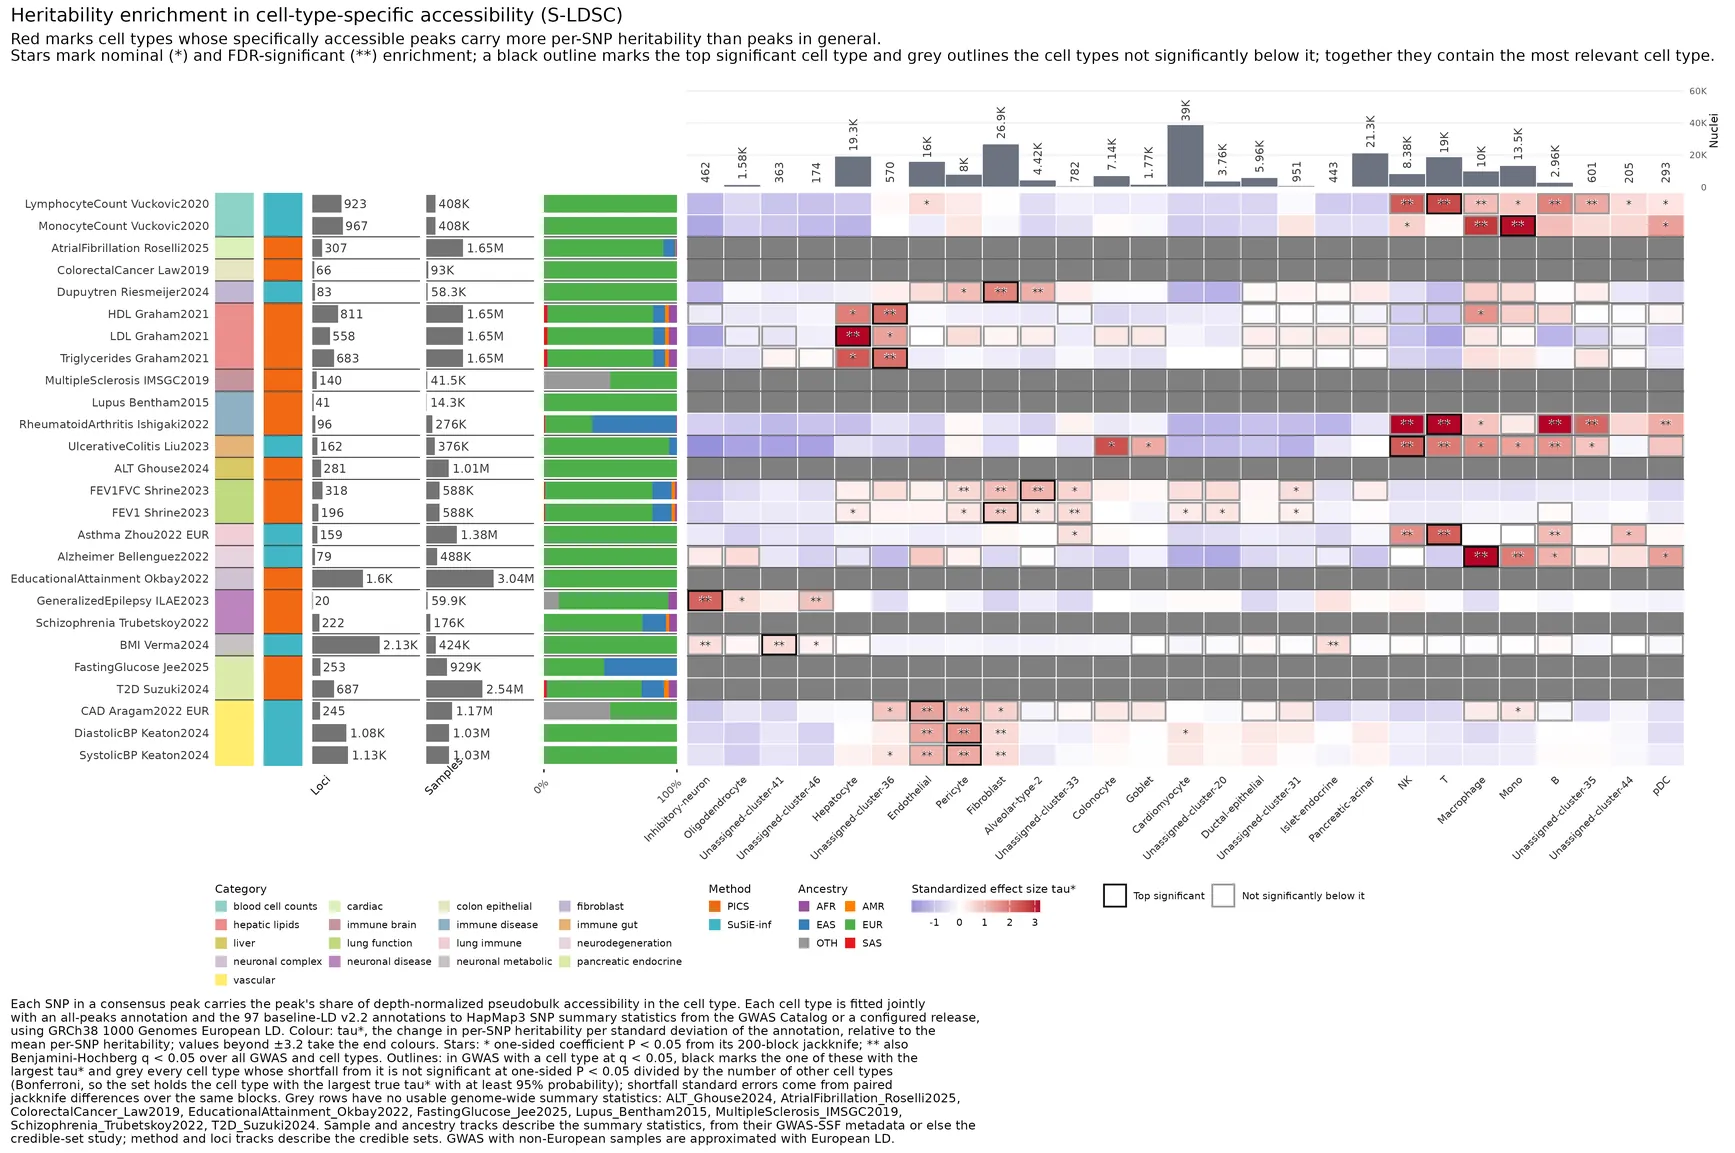
Save the cell-type-by-GWAS S-LDSC heritability enrichment heatmap with each GWAS’s top set of cell types. SLDSC_heatmap.cell_type_pseudobulk.genetic_enrichment
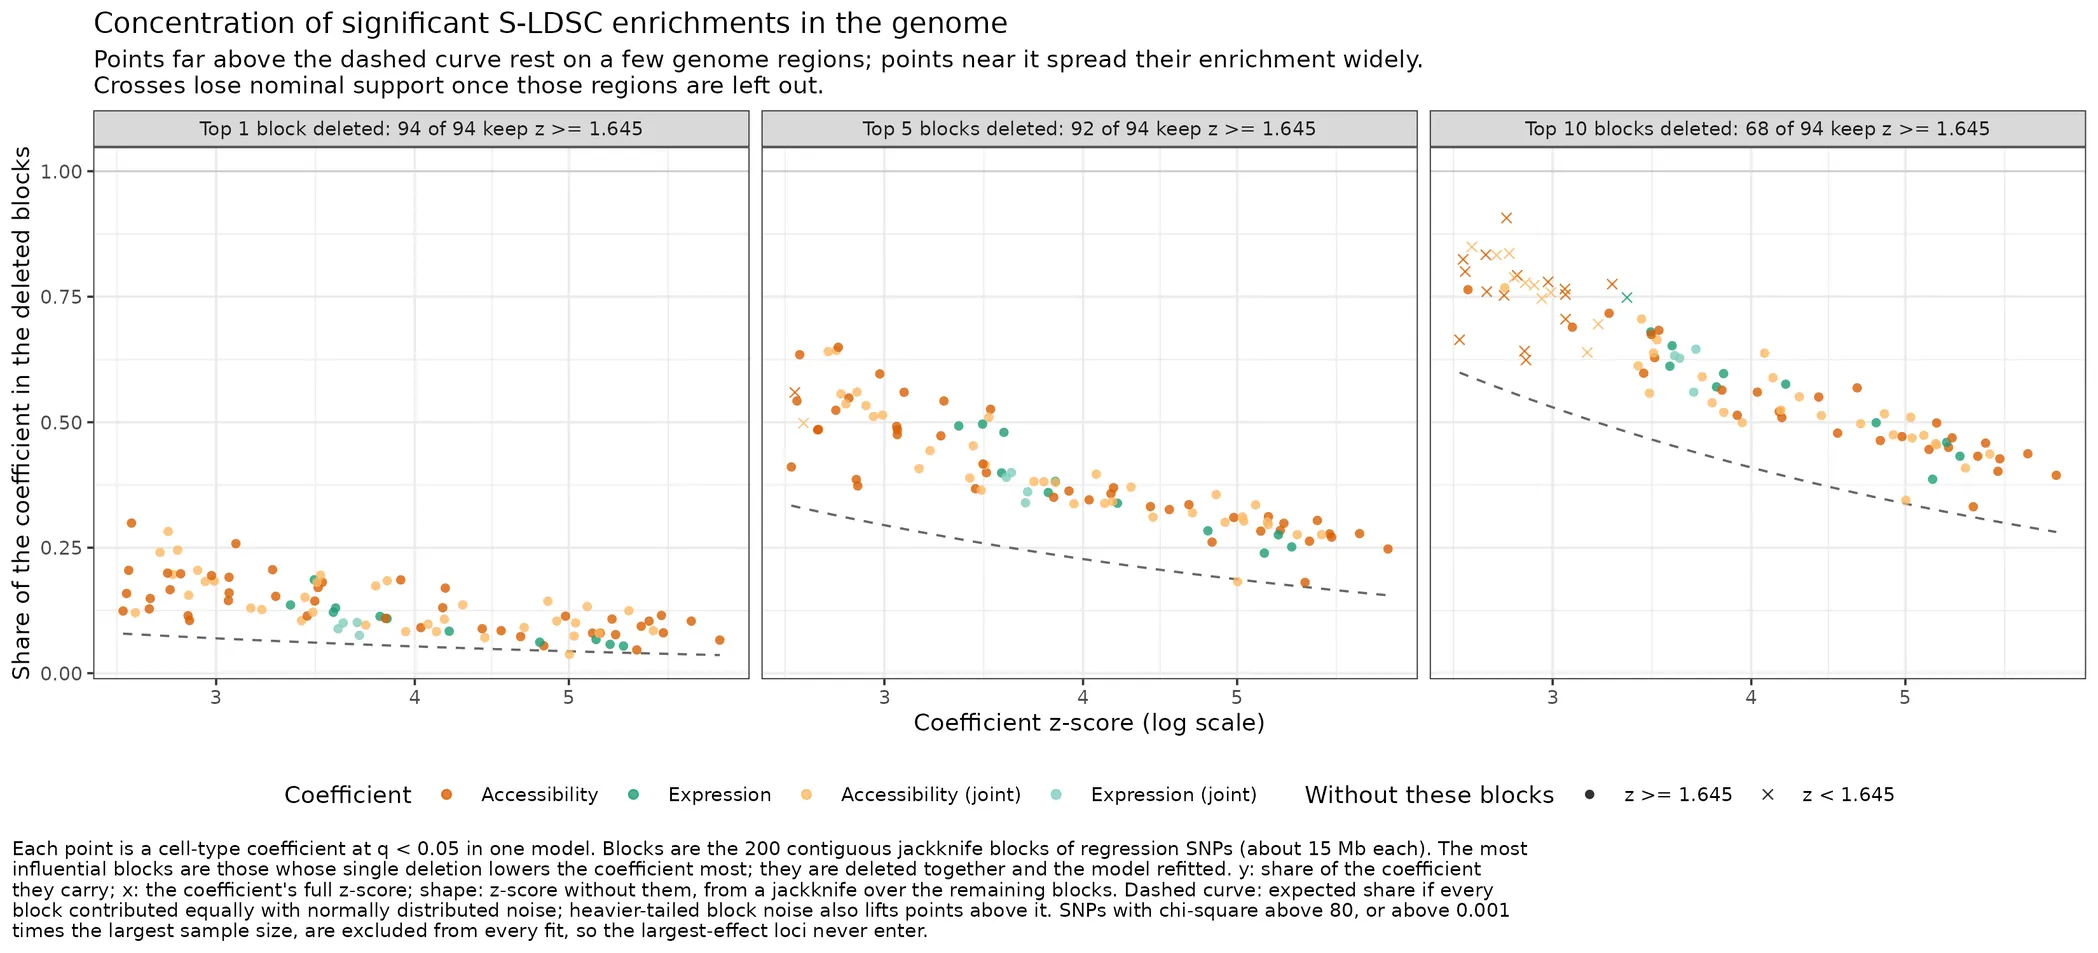
Save how much of each S-LDSC coefficient at q < 0.05 its most influential jackknife blocks carry, and whether it holds without them. SLDSC_block_influence_plot.cell_type_pseudobulk.genetic_enrichment
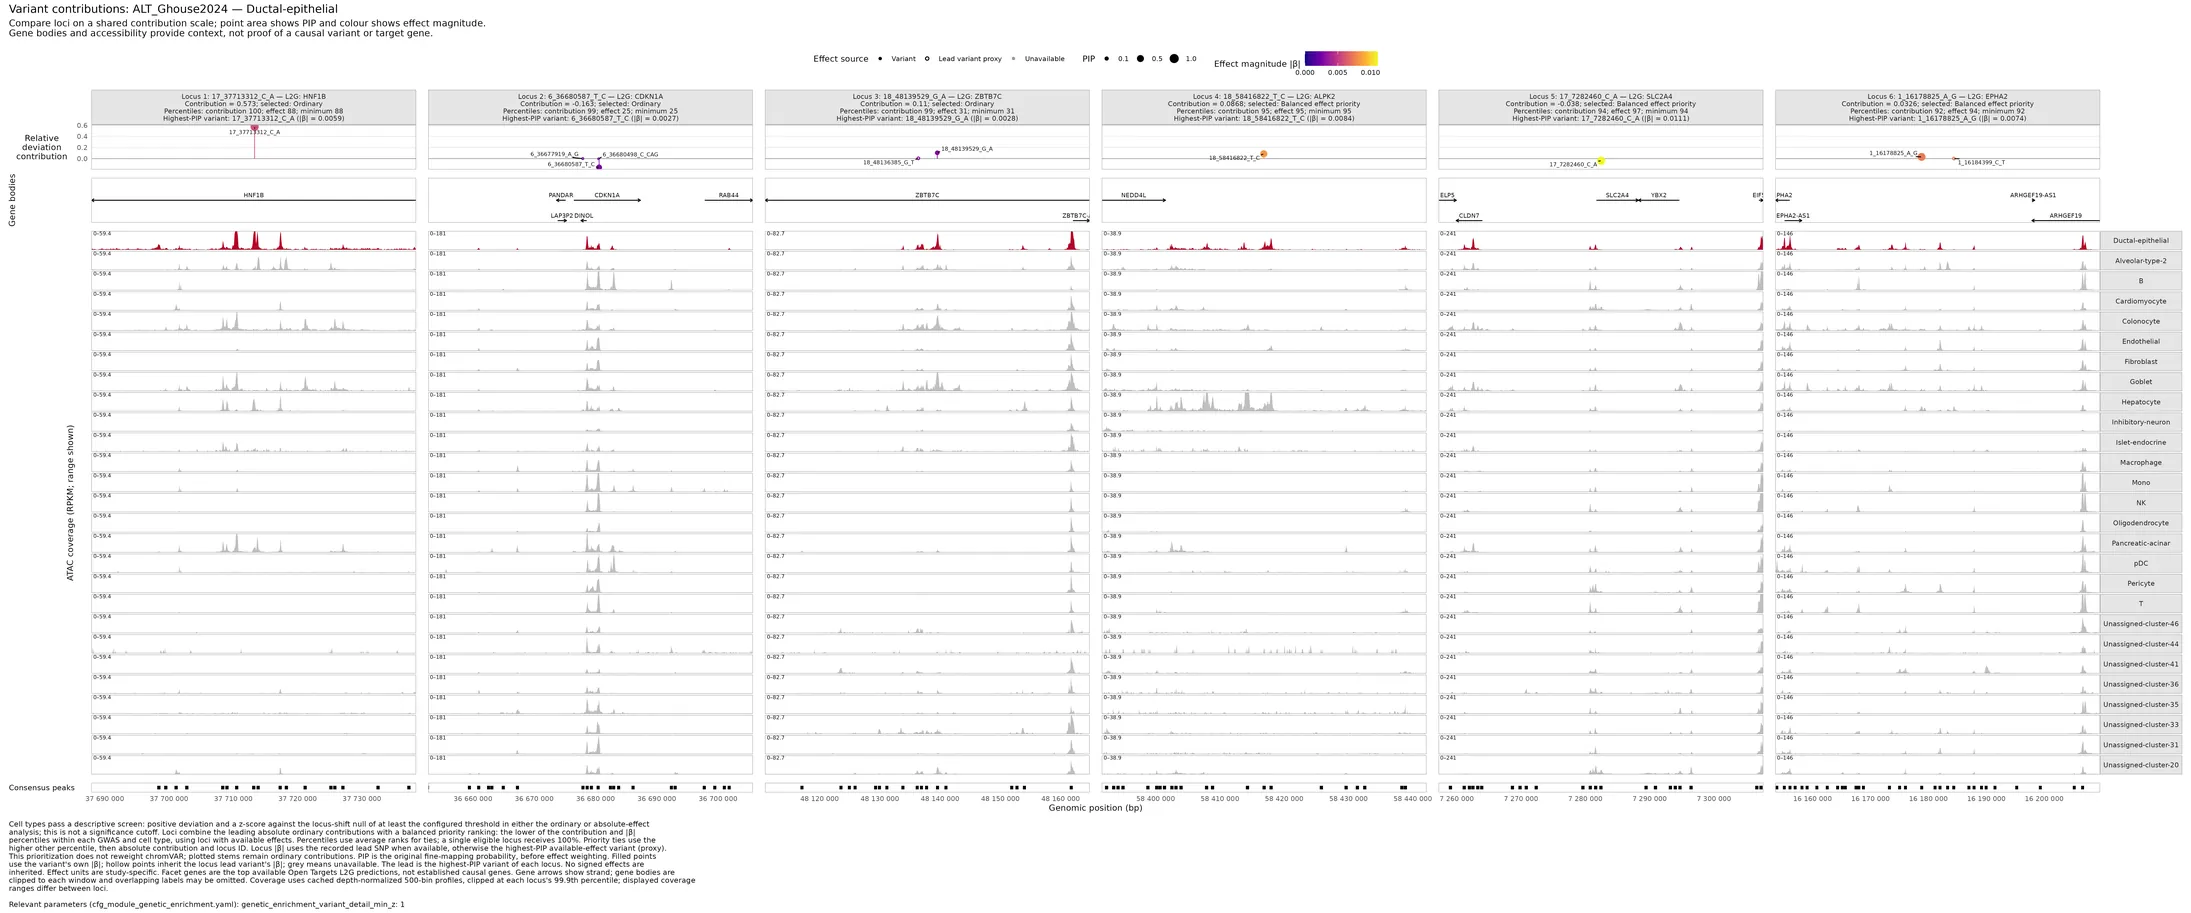
Save aligned locus facets with variant effects, gene bodies, ATAC coverage, and peaks per GWAS and focal cell type. chromVAR_variant_contribution_detail_plots.cell_type_pseudobulk.genetic_enrichment
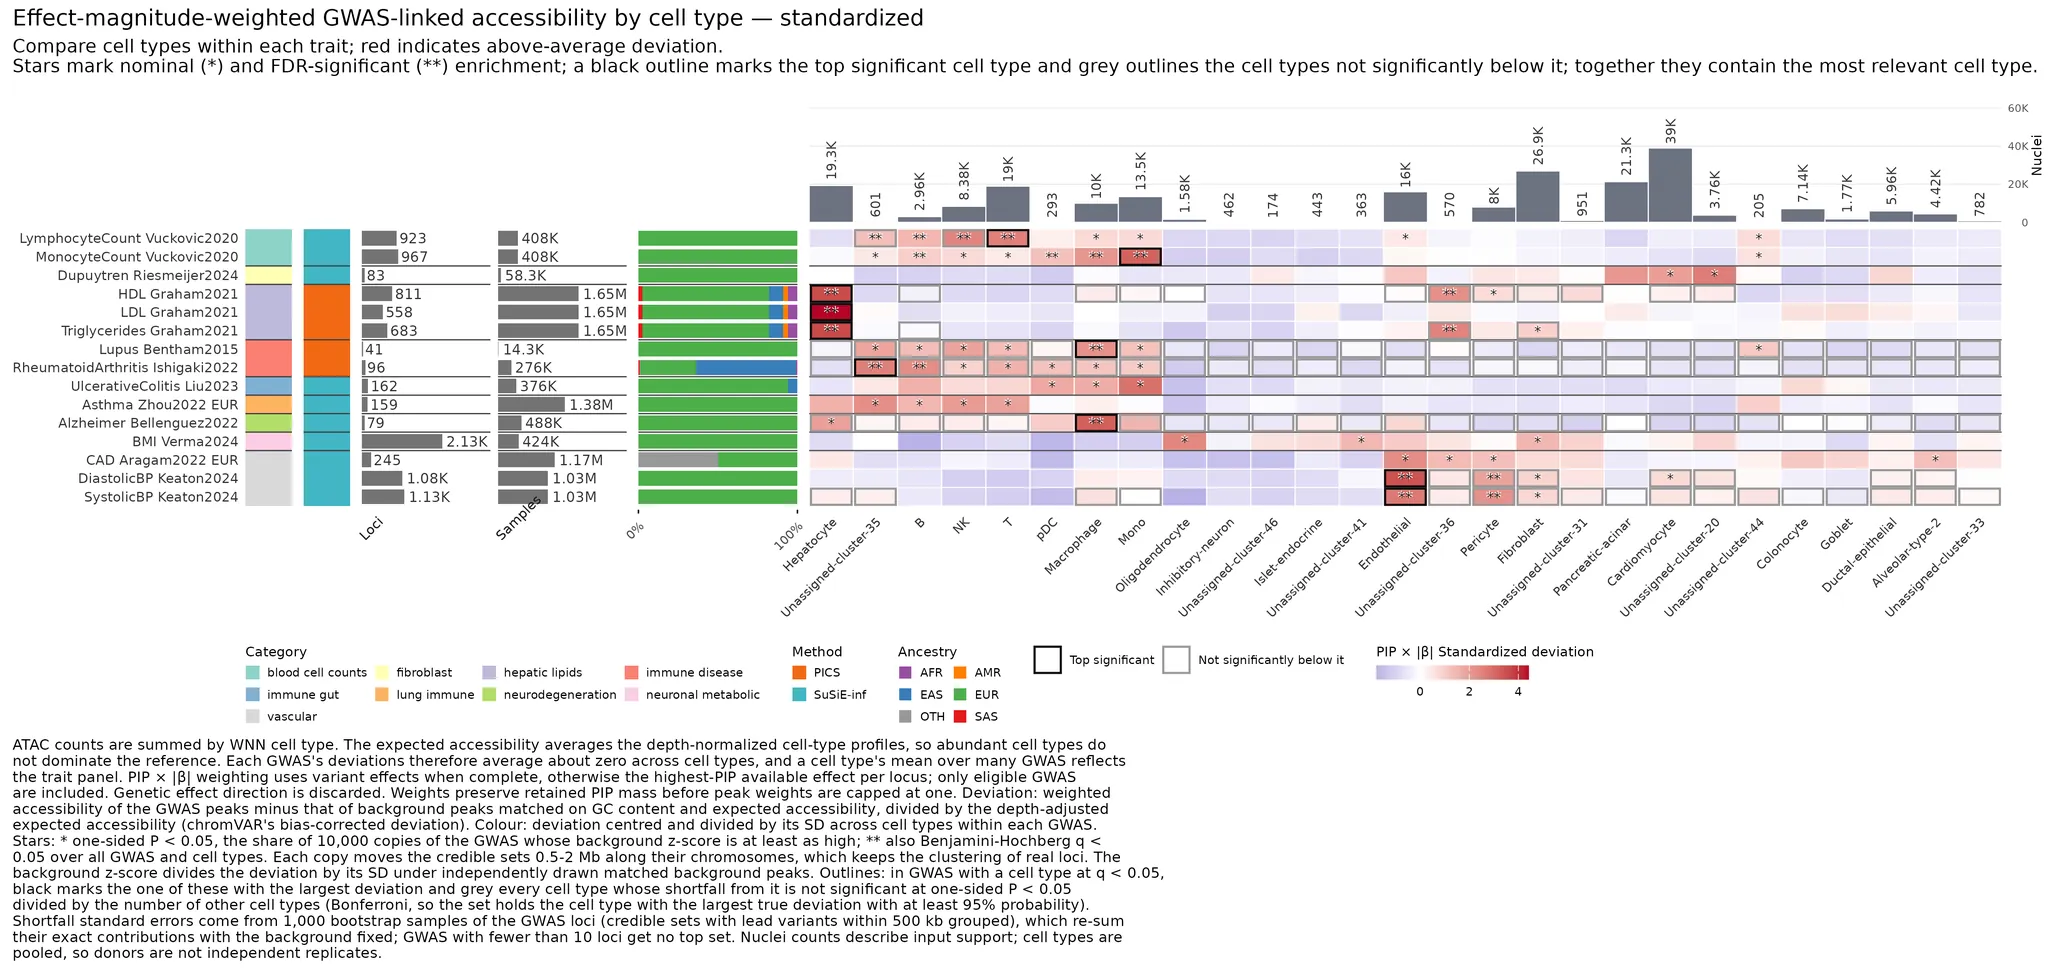
Save absolute-effect-weighted GWAS deviations standardized within each GWAS. beta_weighted_scaled.chromVAR_deviation_heatmaps.cell_type_pseudobulk.genetic_enrichment
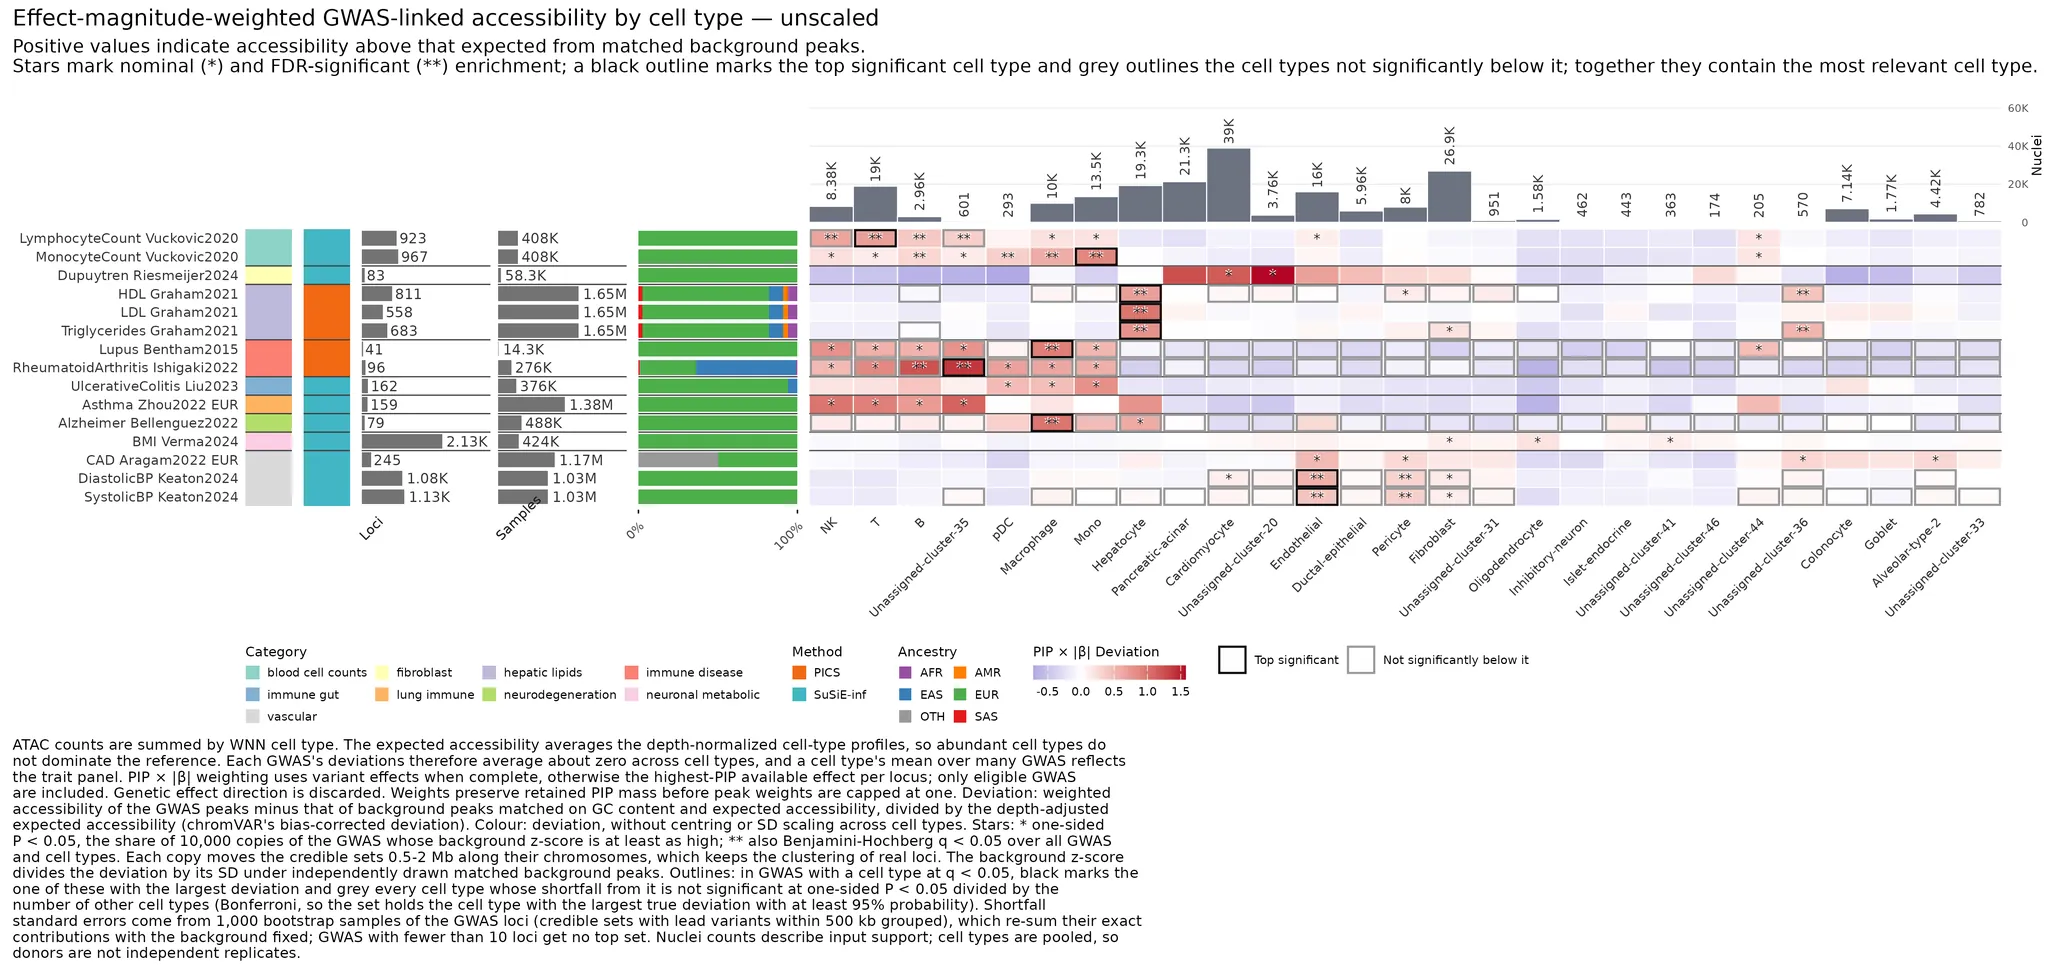
Save absolute-effect-weighted GWAS deviations without within-GWAS scaling. beta_weighted_unscaled.chromVAR_deviation_heatmaps.cell_type_pseudobulk.genetic_enrichment
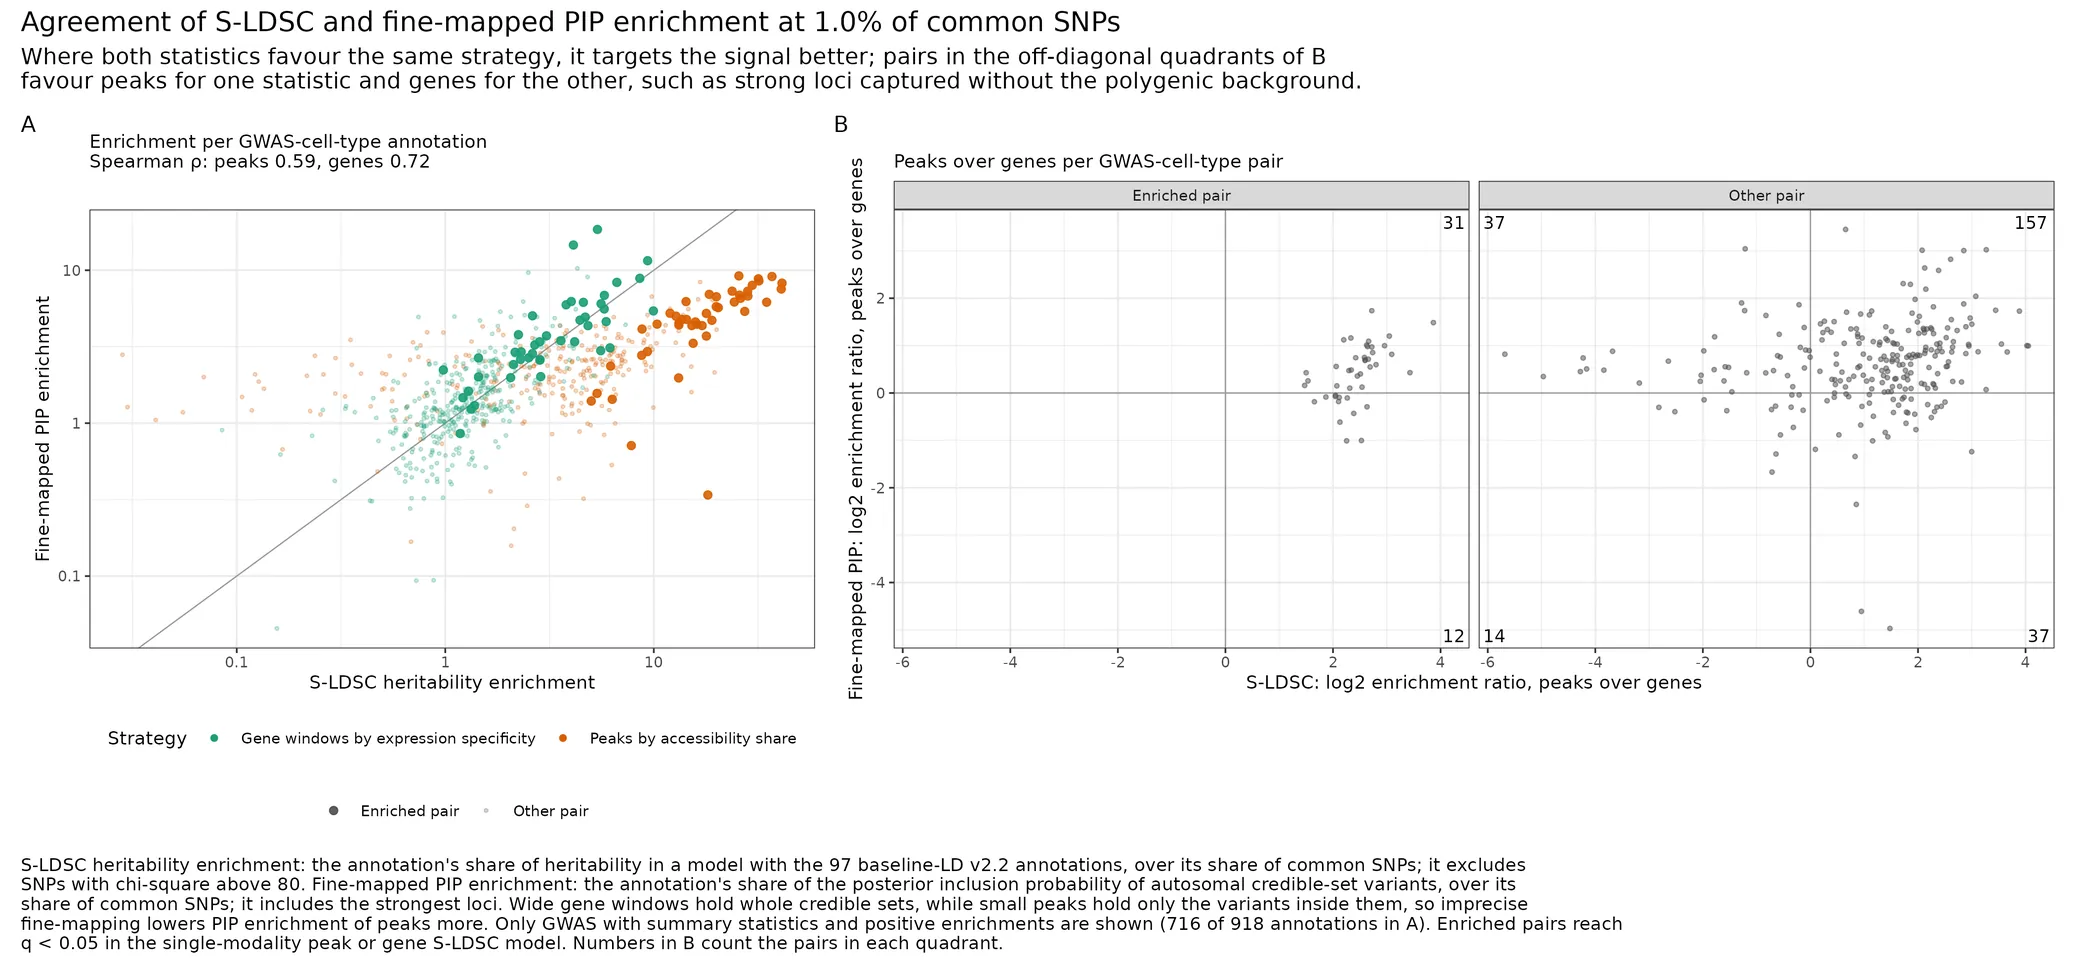
Save the agreement of S-LDSC heritability and fine-mapped PIP enrichment in matched-size annotations. SLDSC_matched_enrichment_agreement_plot.cell_type_pseudobulk.genetic_enrichment
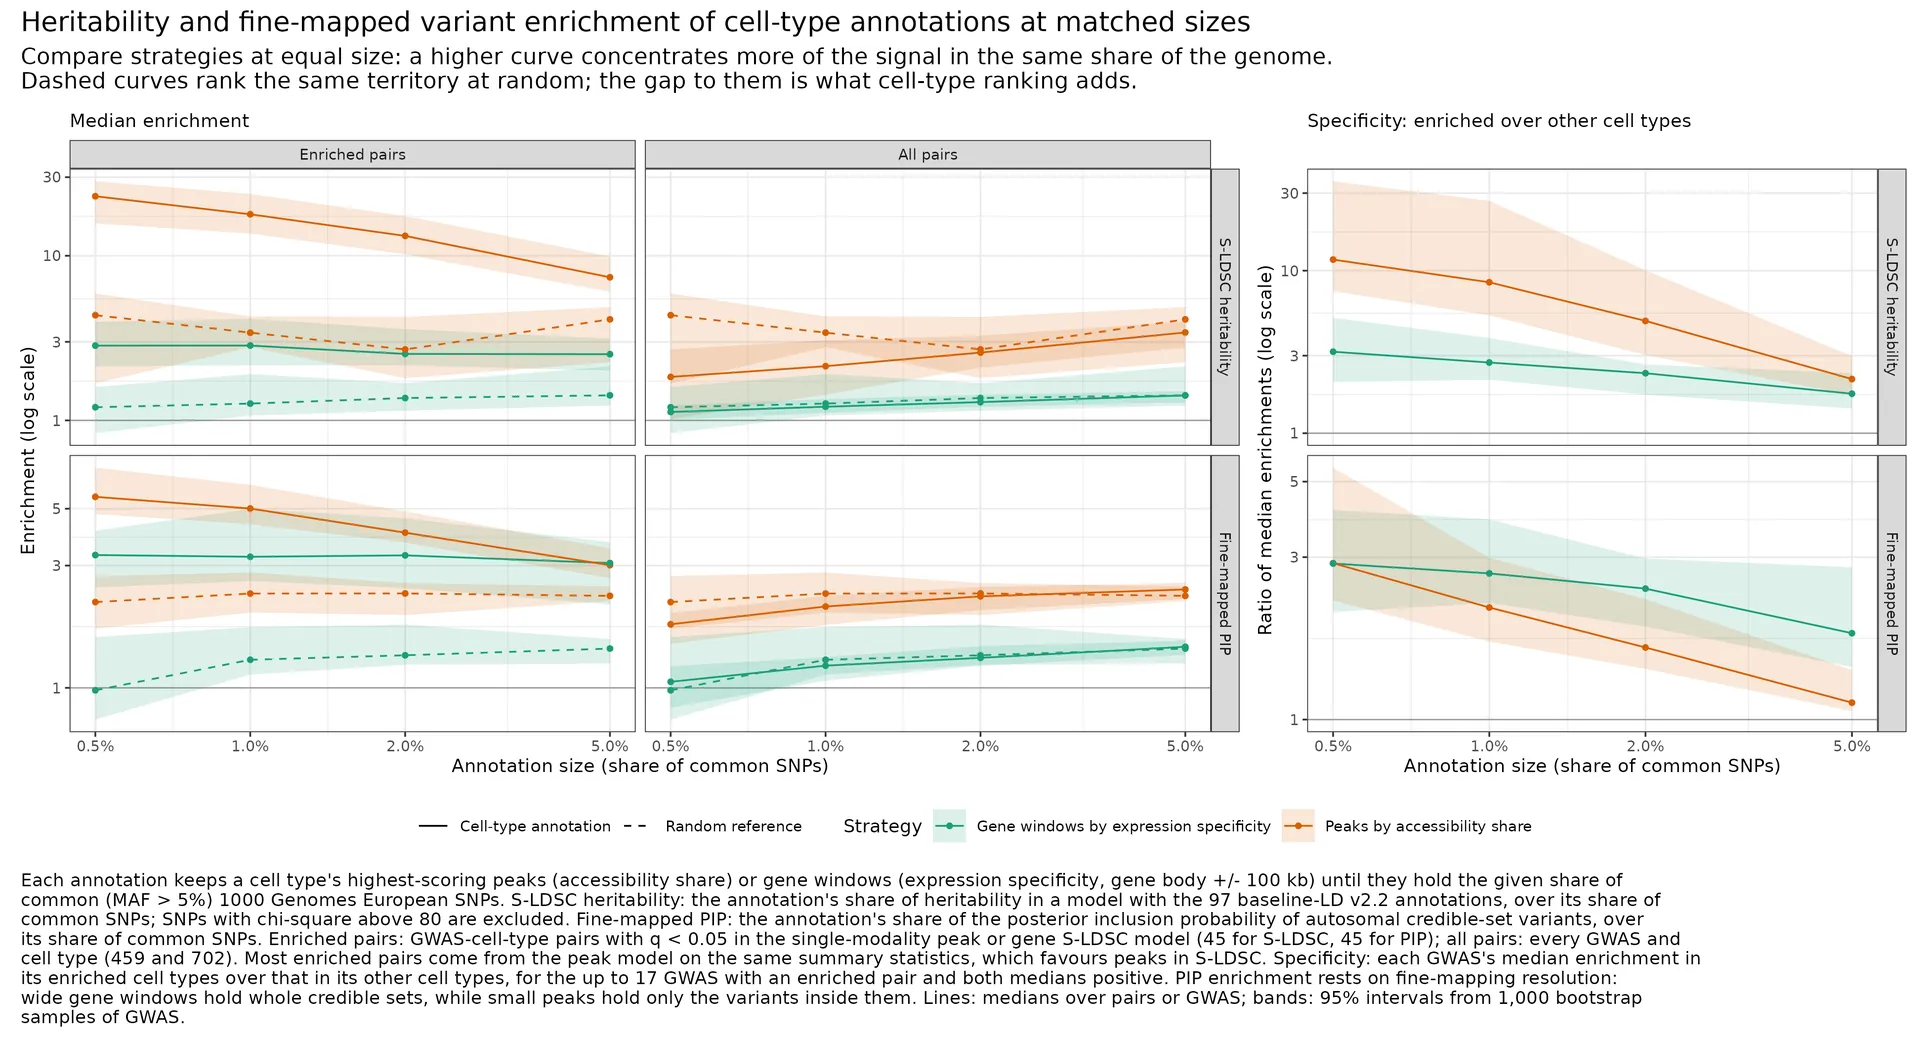
Save S-LDSC heritability and fine-mapped PIP enrichment of peak and gene annotations against annotation size. SLDSC_matched_enrichment_curves_plot.cell_type_pseudobulk.genetic_enrichment
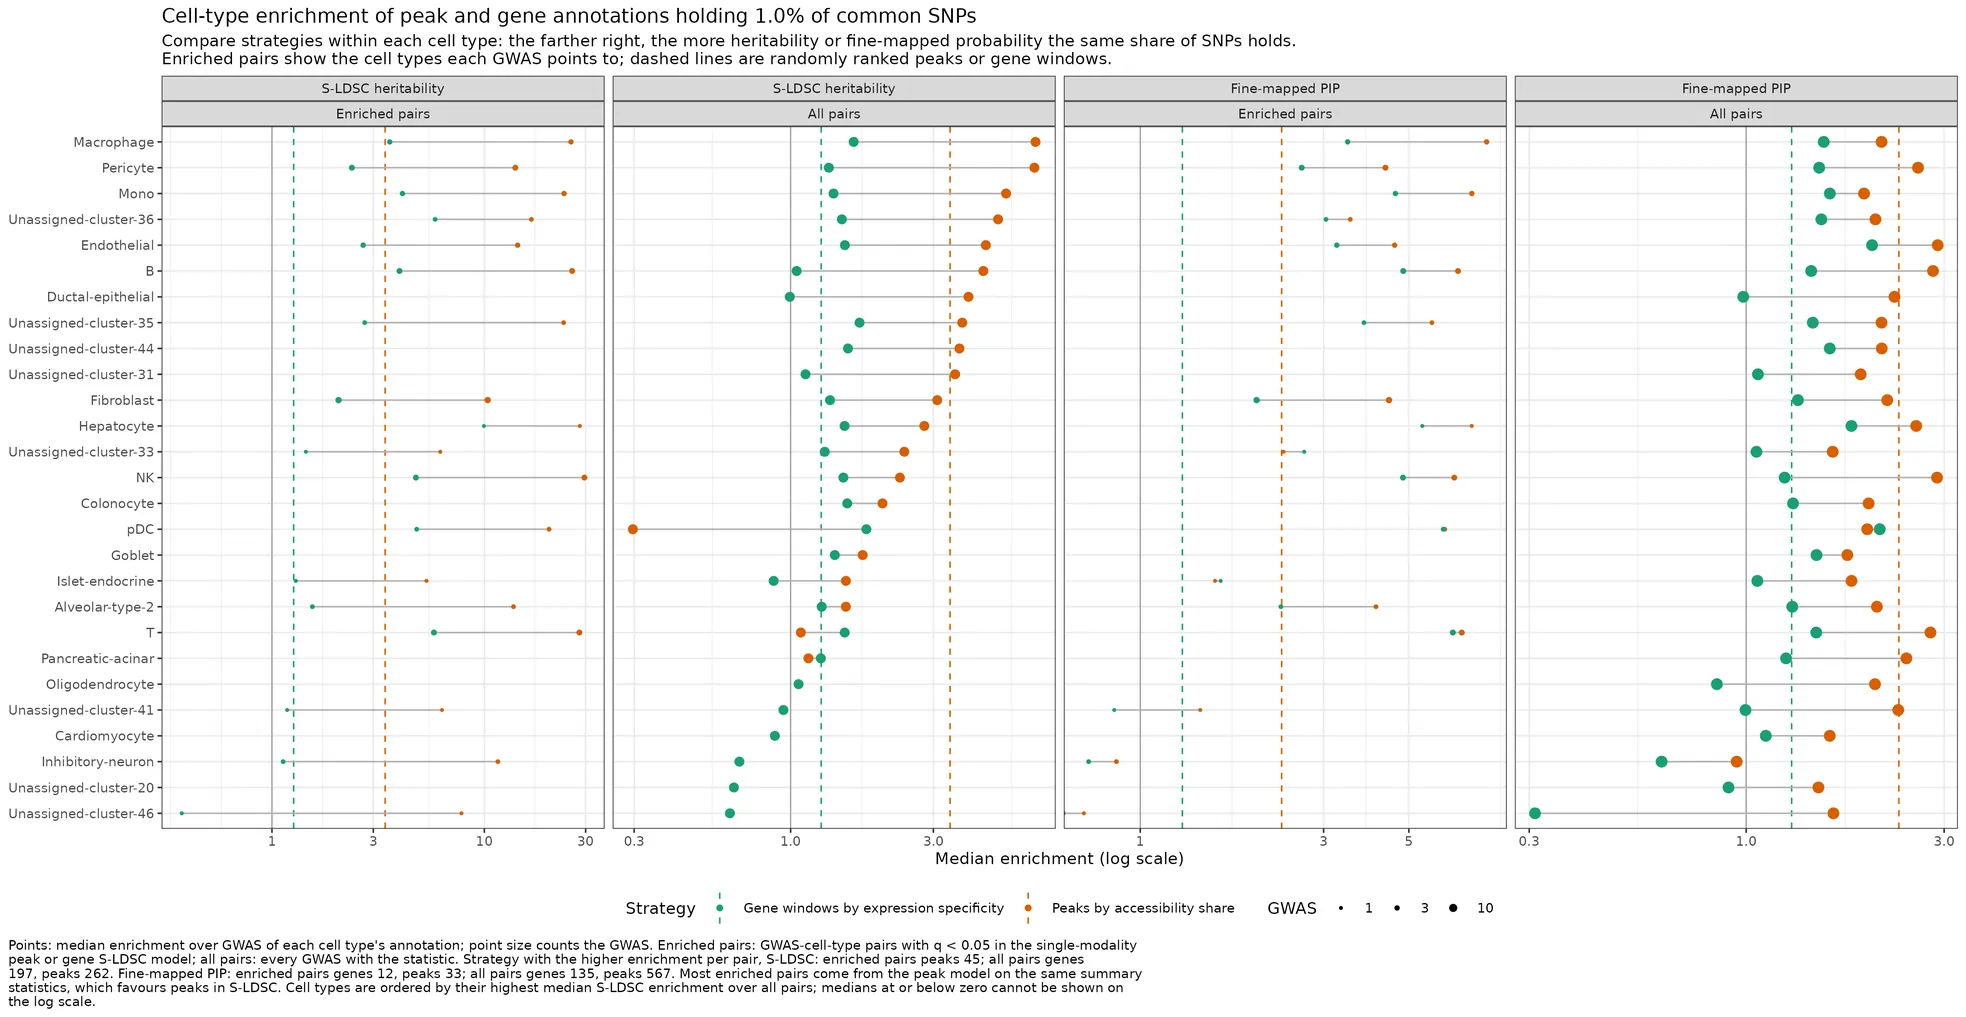
Save each cell type’s enrichment in peak and gene annotations of matched size. SLDSC_matched_size_comparison_plot.cell_type_pseudobulk.genetic_enrichment
Peak–gene correlation
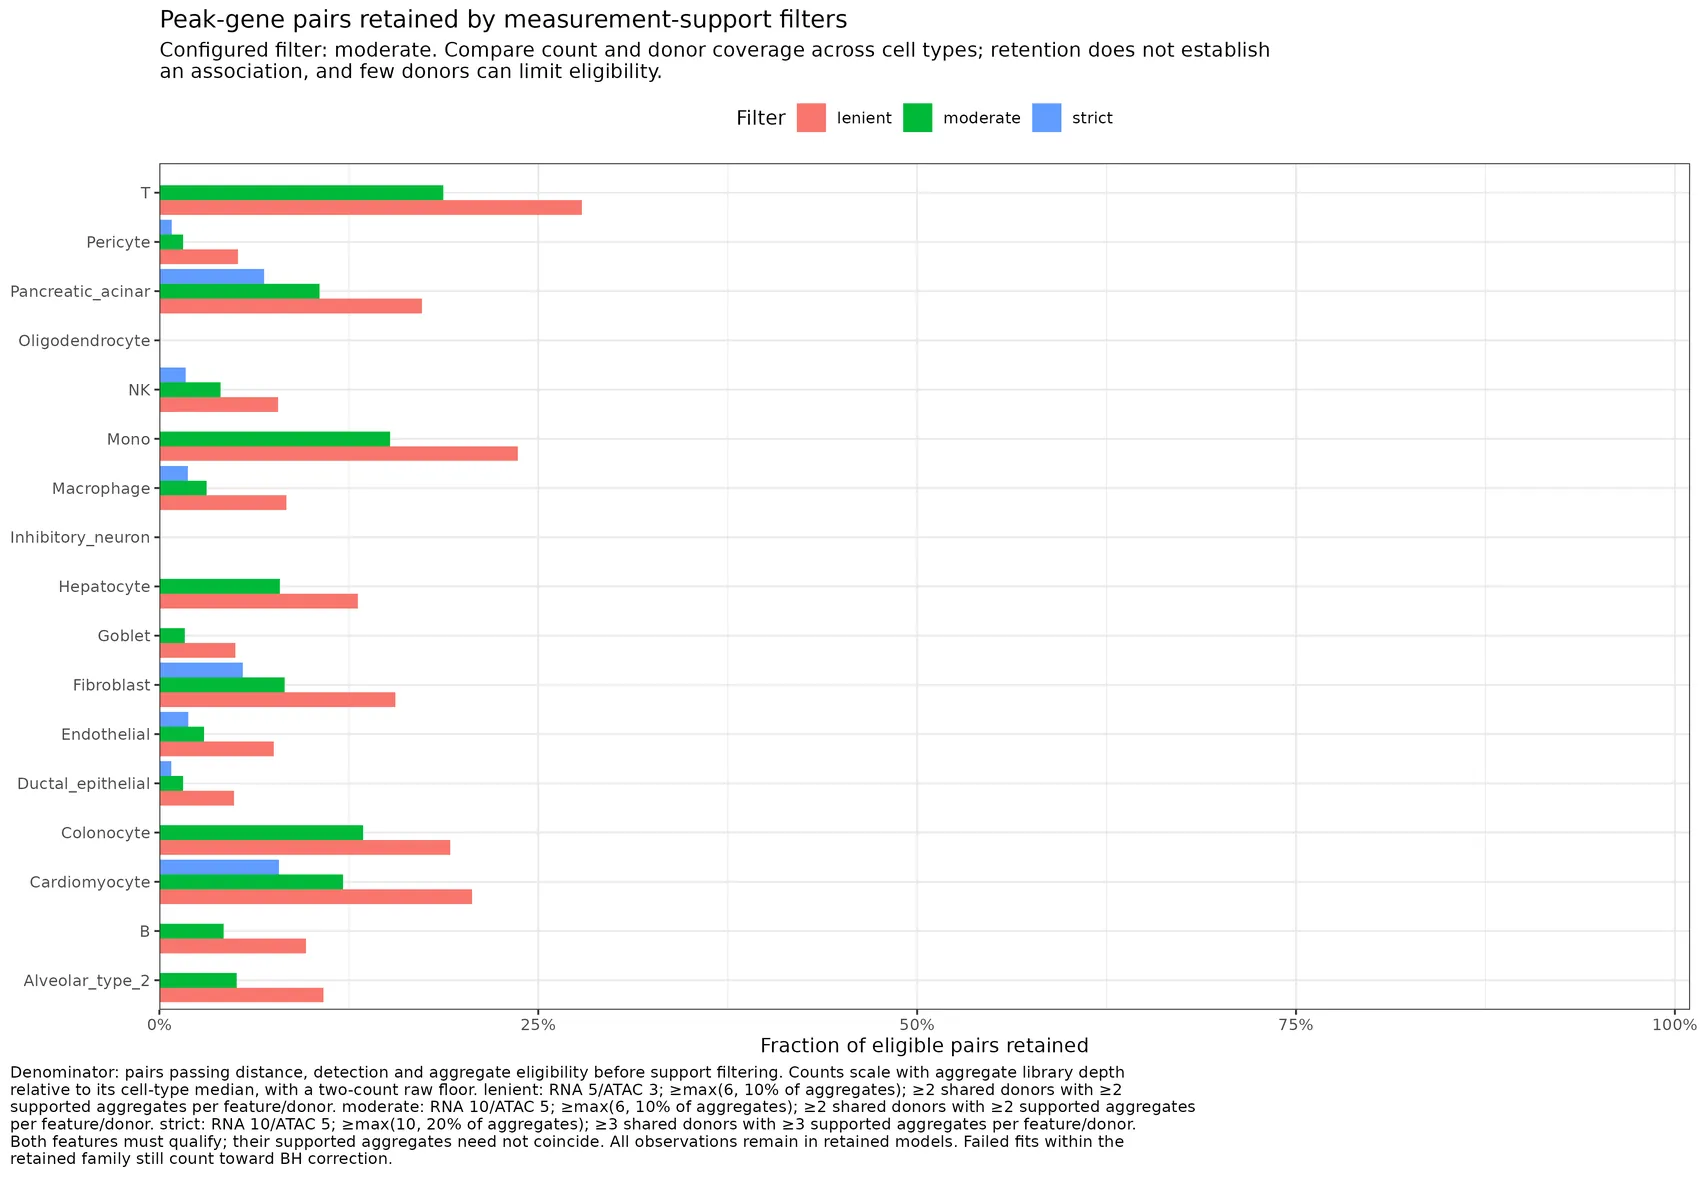
Compare candidate retention across measurement-support filters by cell type filter_retention_plot.peak_gene_correlation
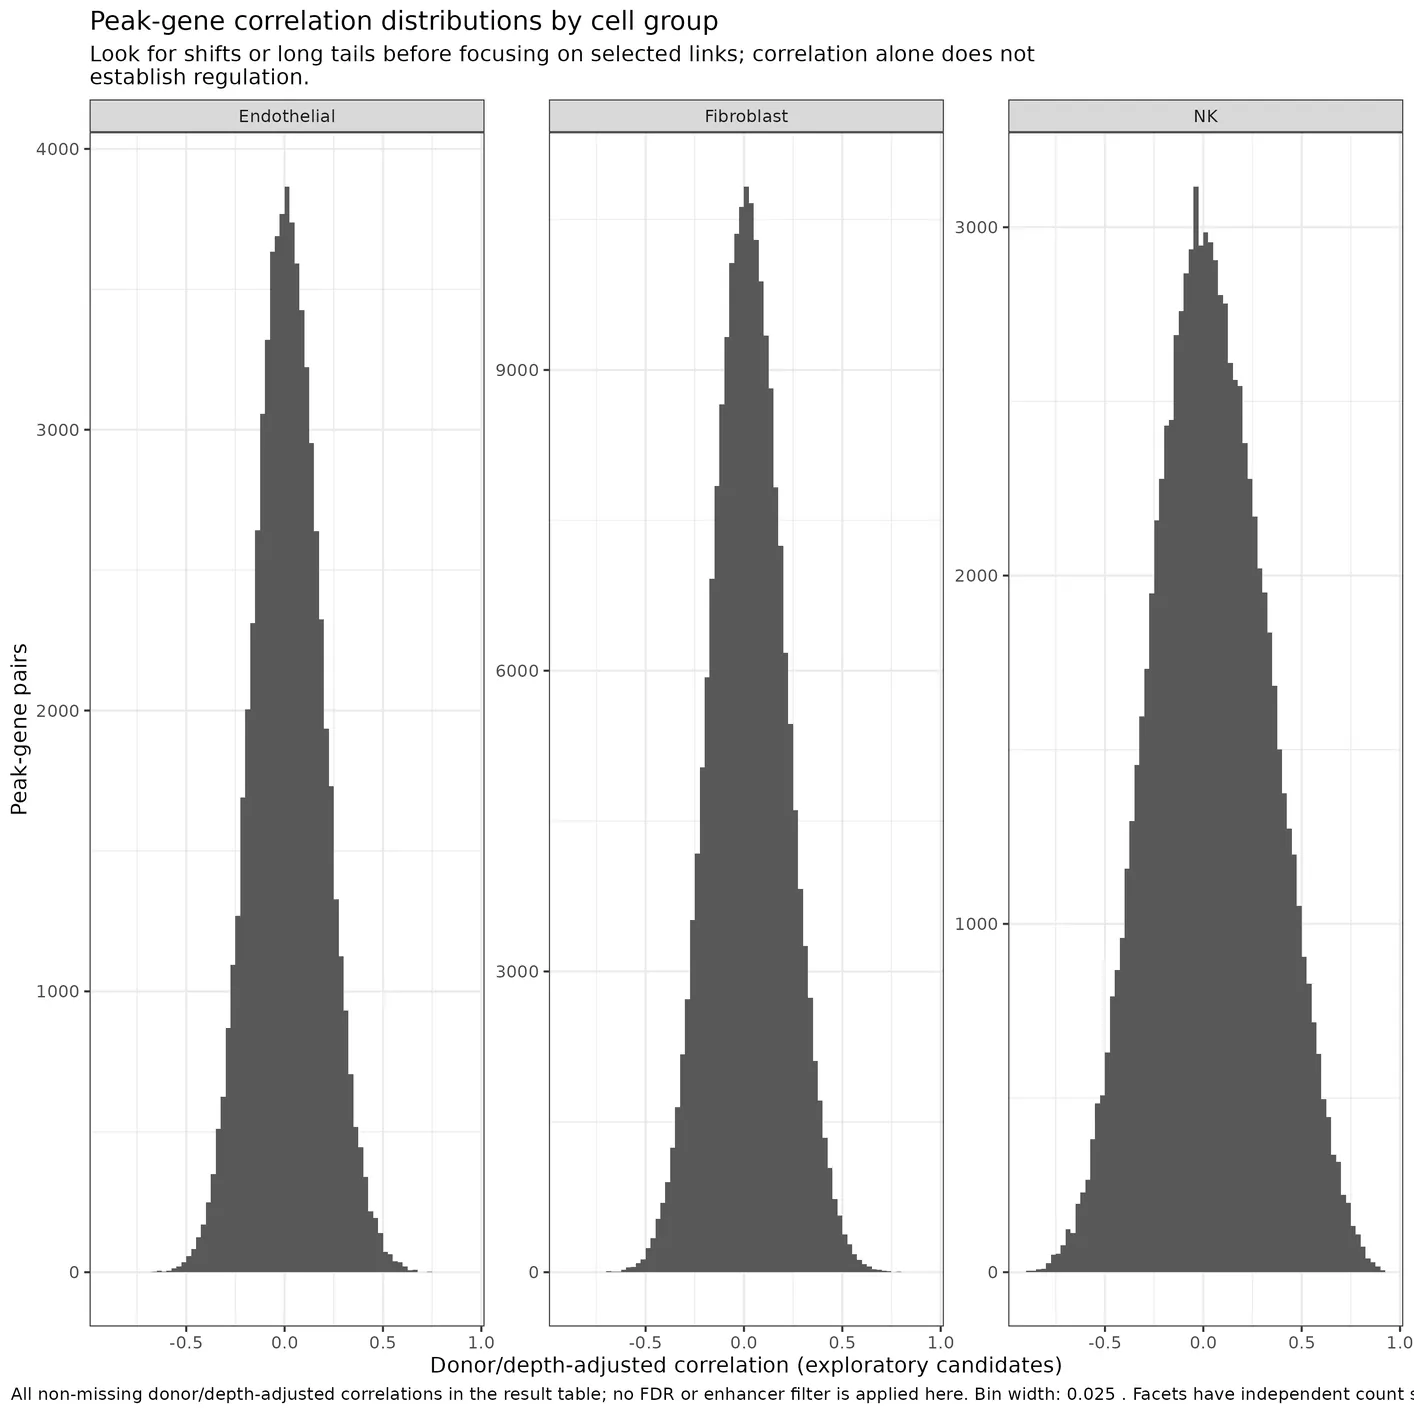
Save a facetted histogram of peak-gene correlations by cell group correlation_histogram_plot.peak_gene_correlation
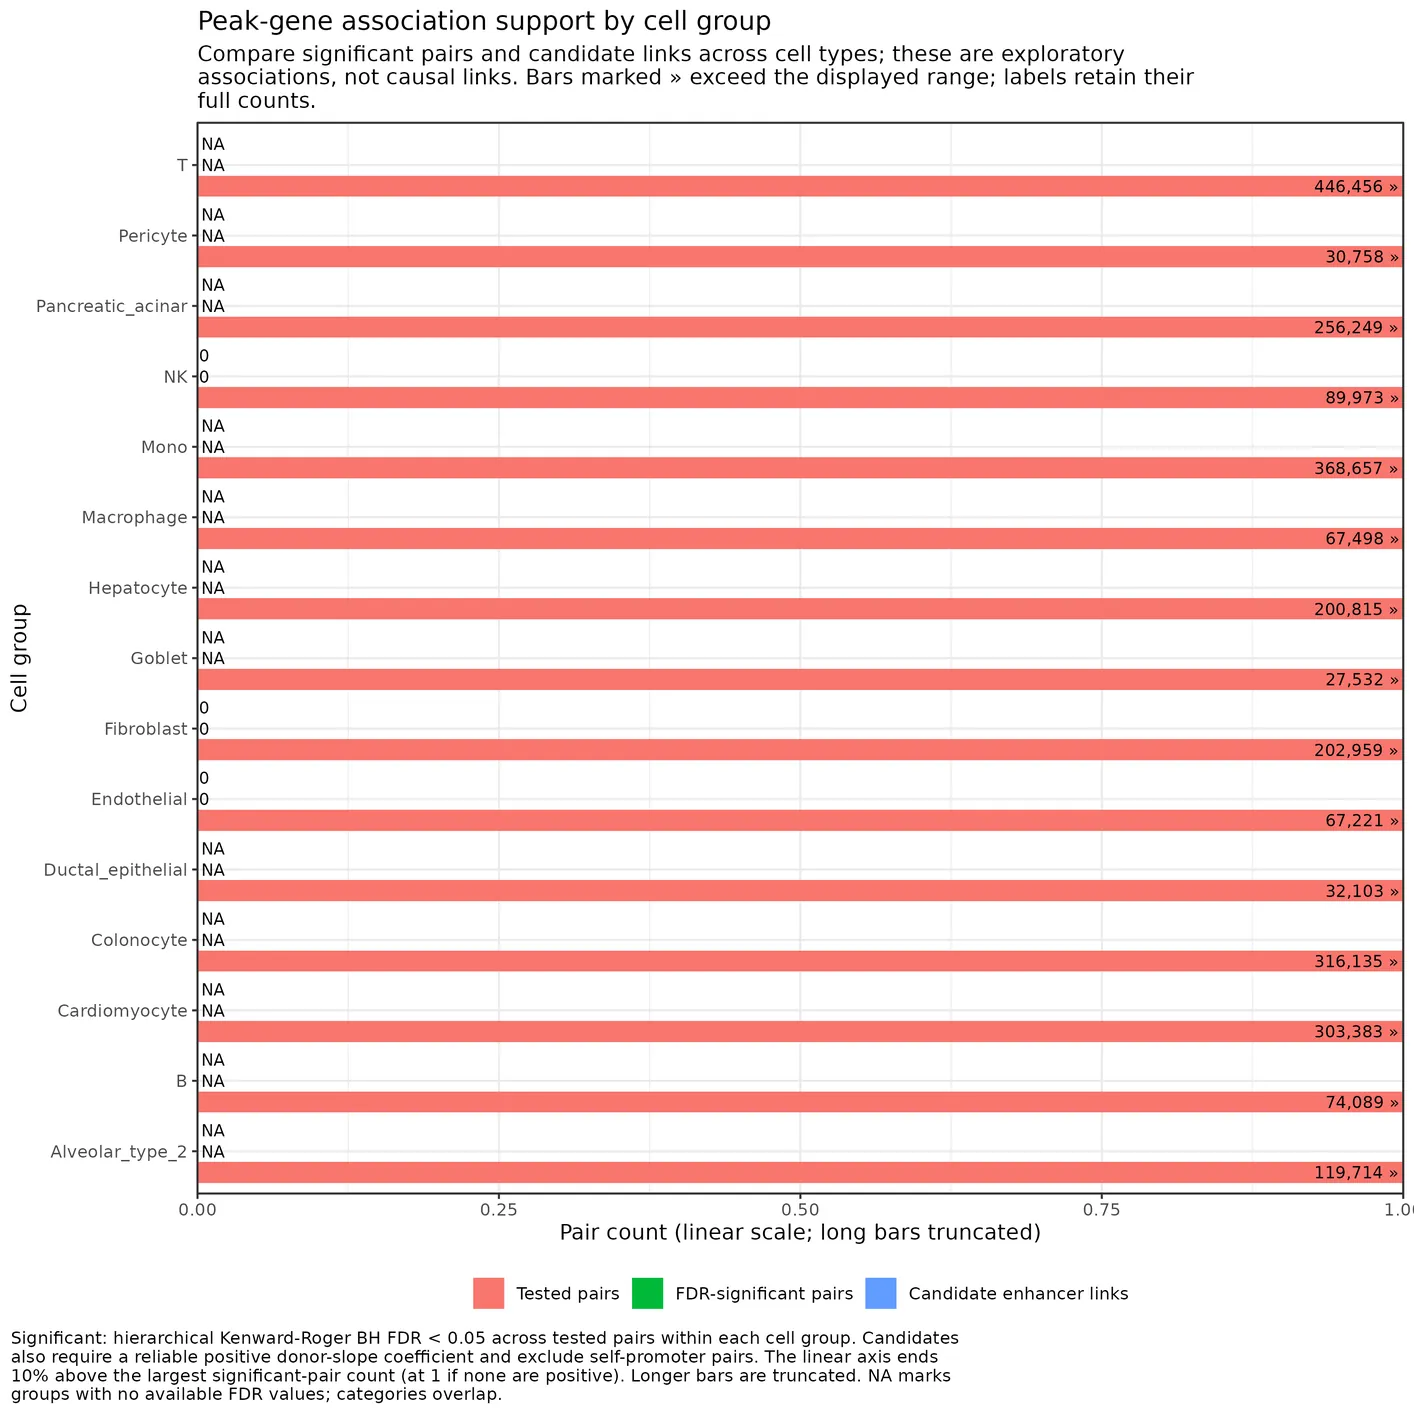
Save peak-gene correlation tested, significant, and linked pair counts by cell group support_counts_plot.peak_gene_correlation
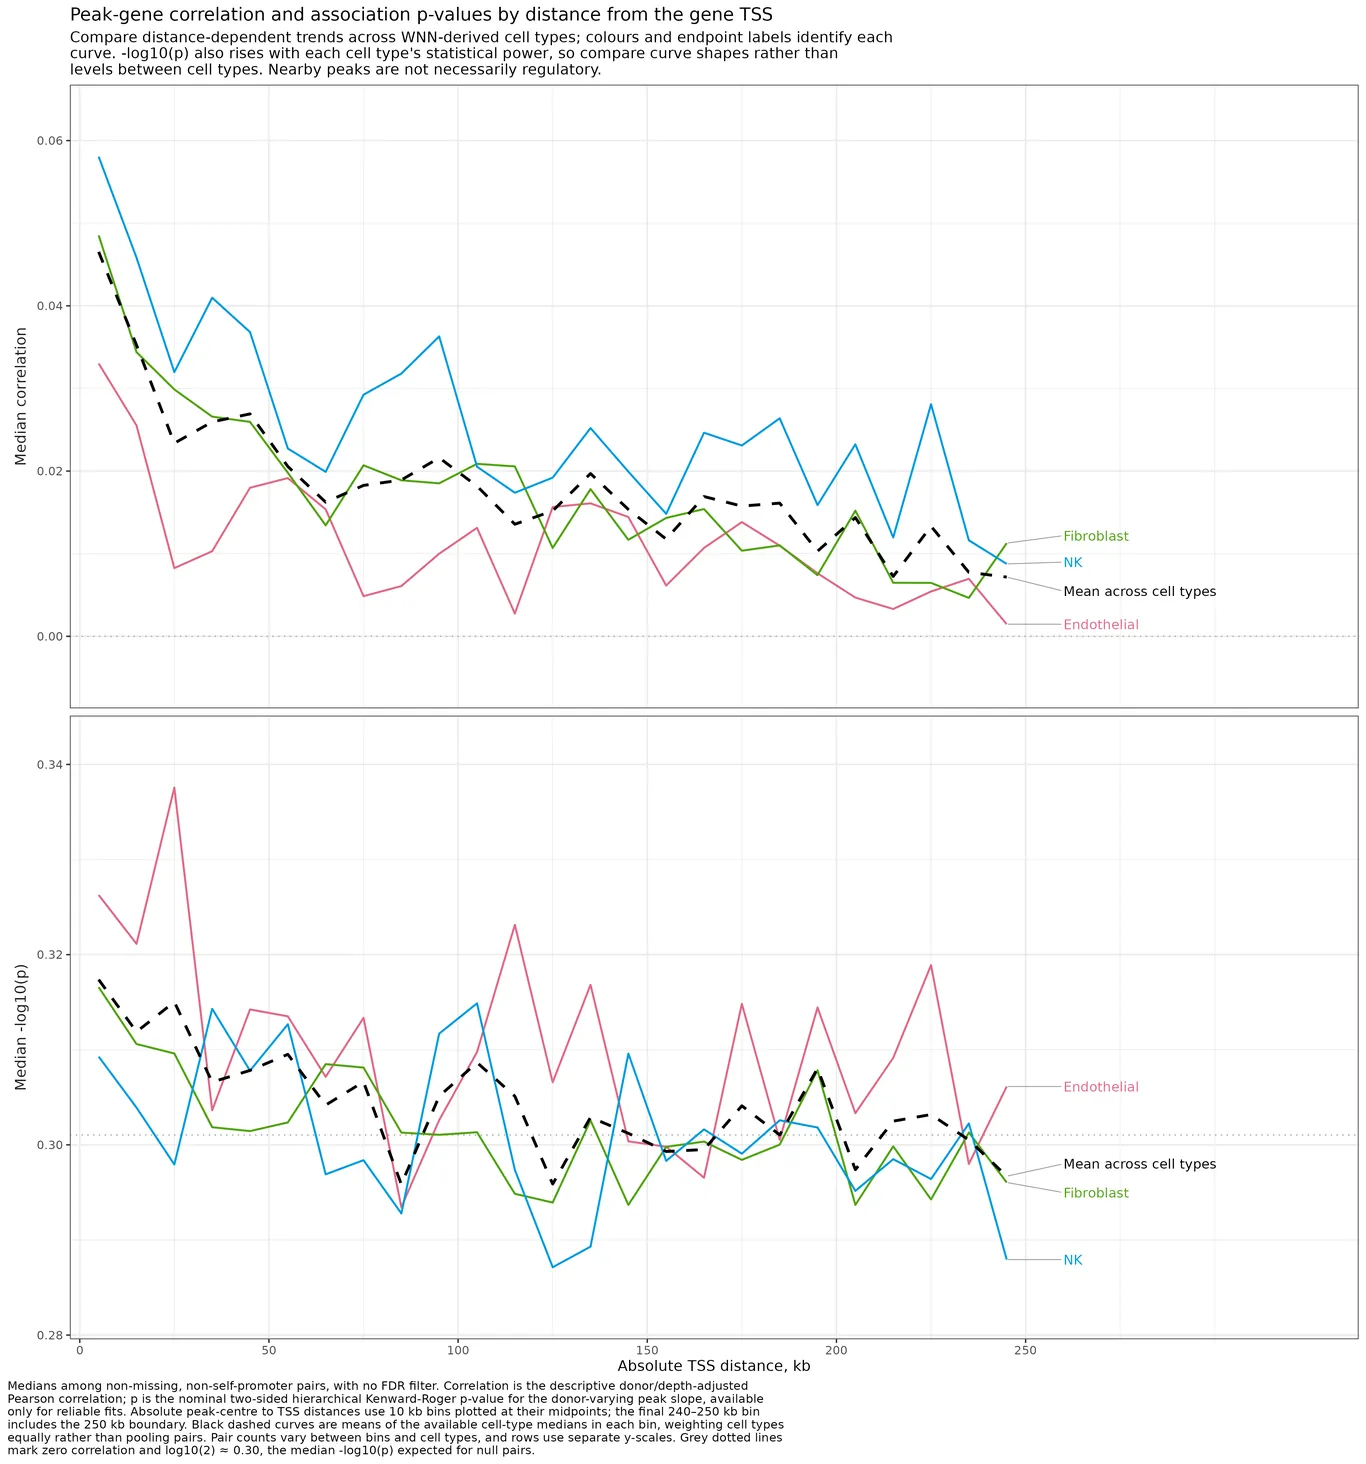
Save median peak-gene correlation and -log10(p) by absolute TSS distance and cell group distance_correlation_plot.peak_gene_correlation
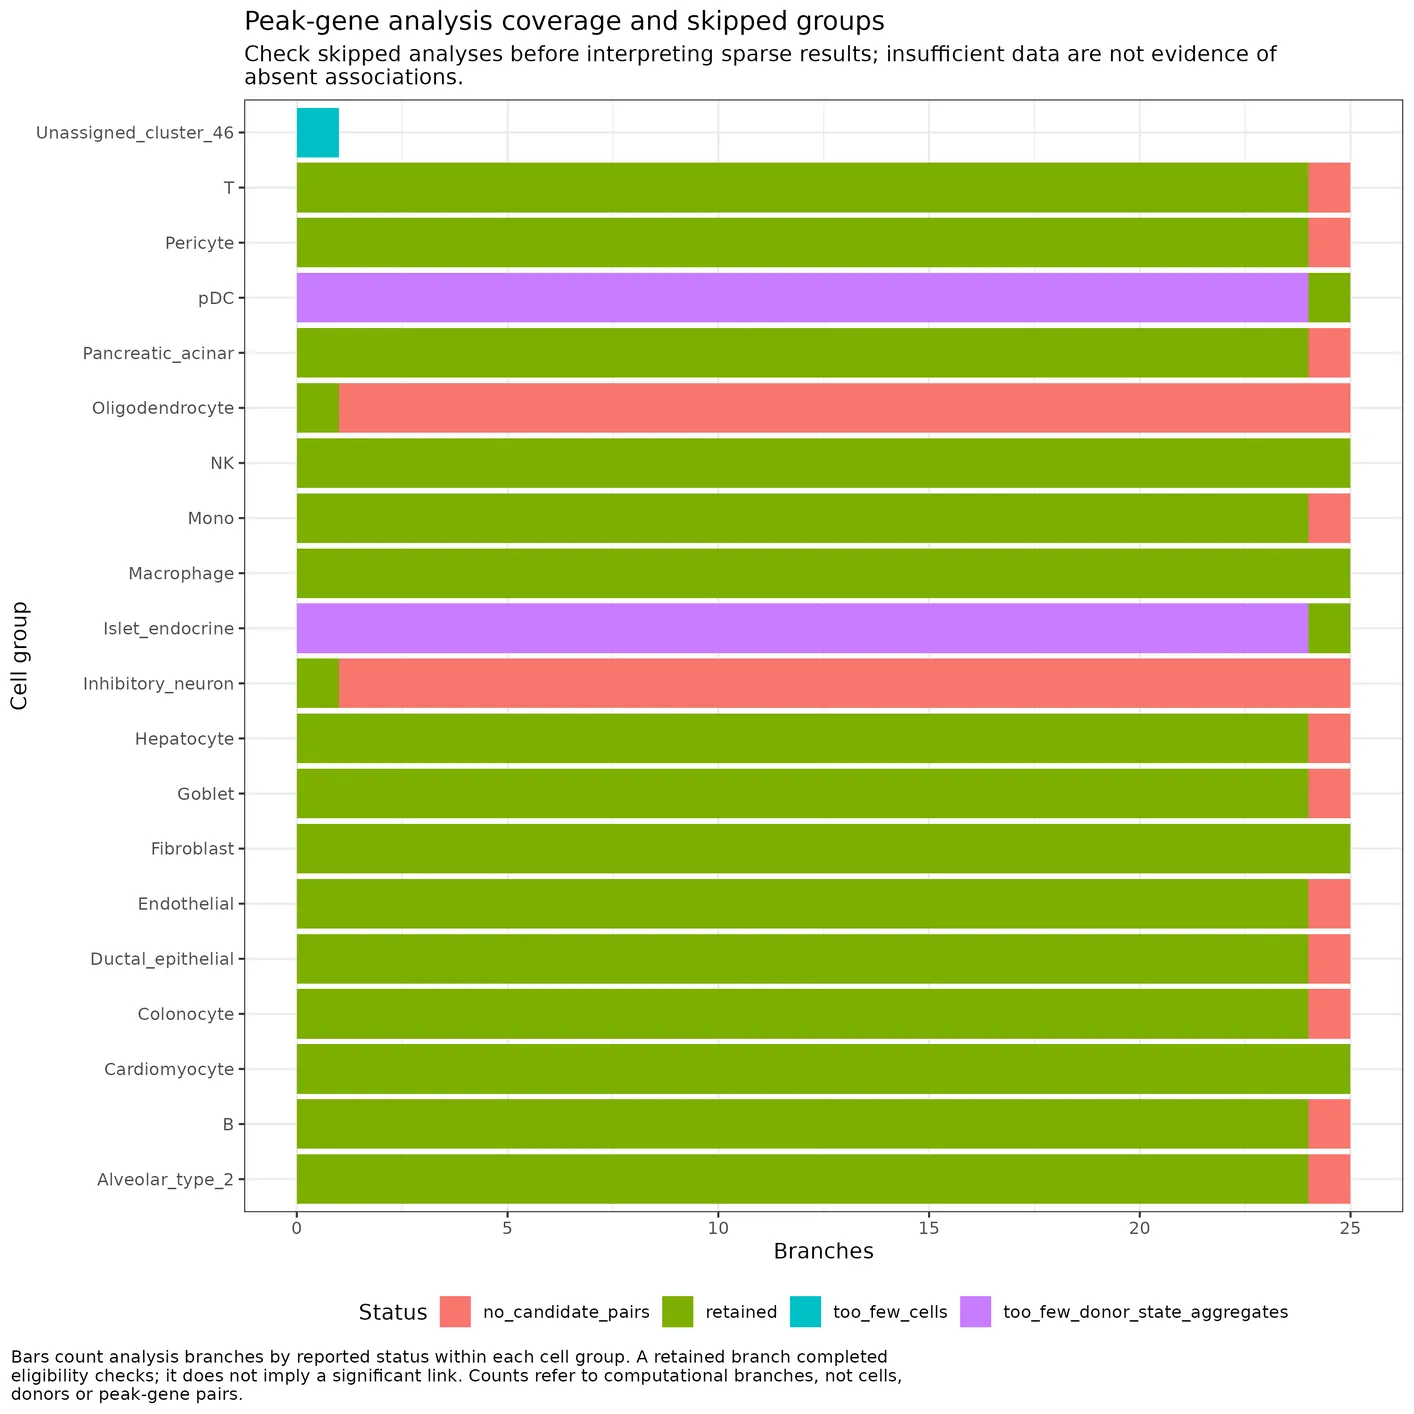
Save peak-gene correlation retained and skipped branch diagnostics by cell group diagnostics_plot.peak_gene_correlation
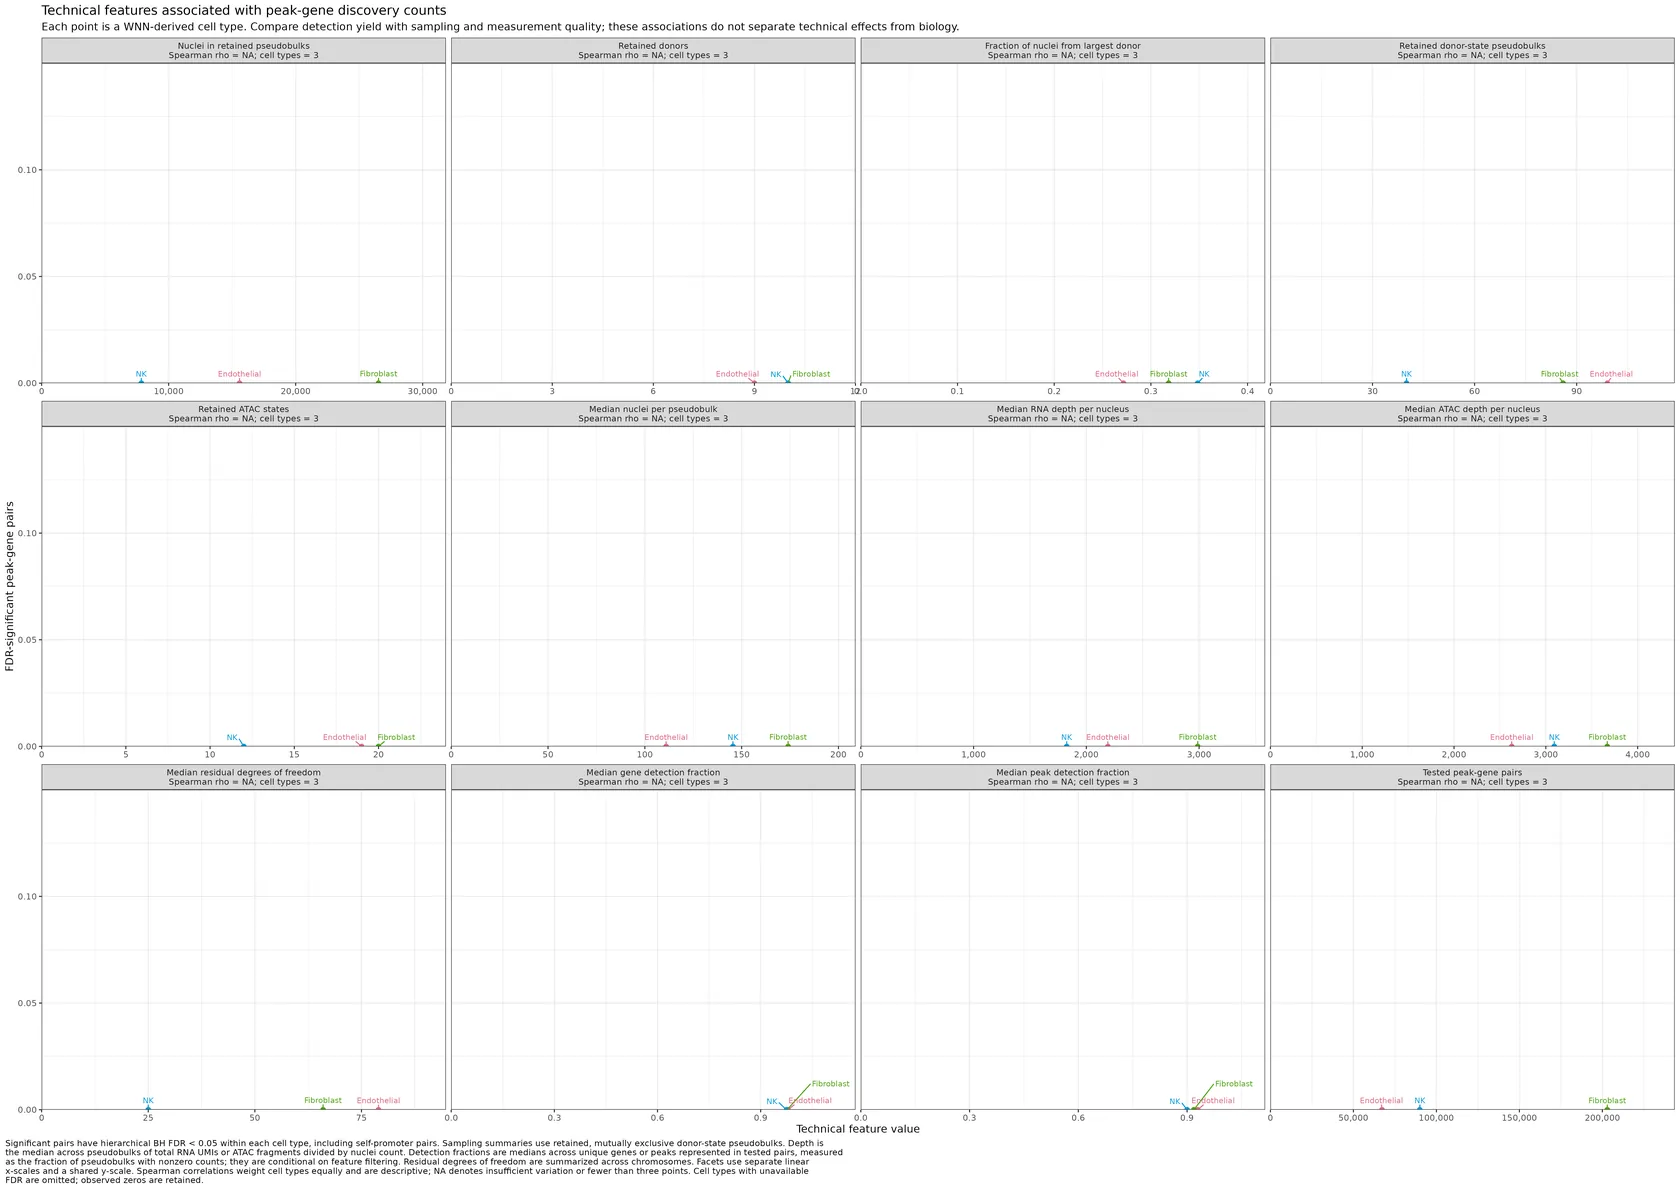
Compare FDR-significant peak-gene pairs with sampling and measurement features across WNN cell types significant_pairs_vs_technical_features_plot.peak_gene_correlation
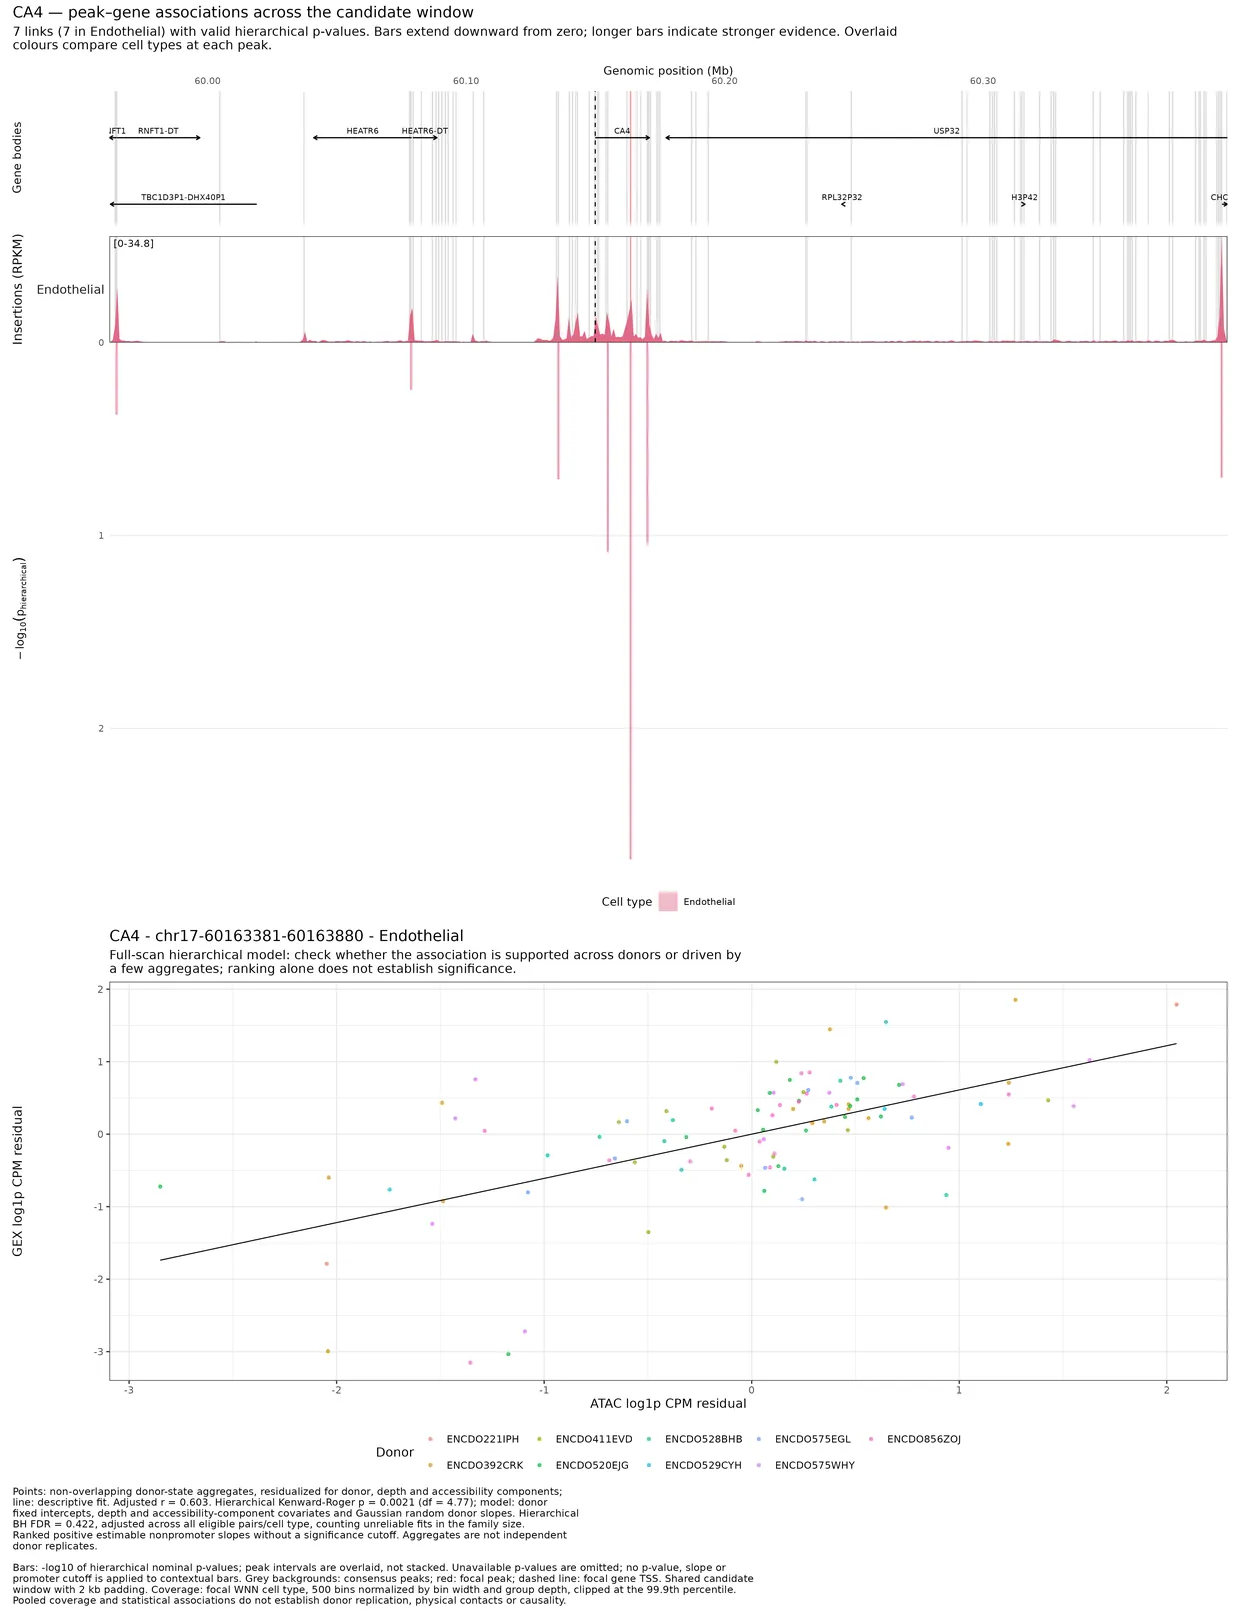
Save hierarchical genomic evidence and donor-residual scatter for each top link top_link_aggregate_scatter_plots.peak_gene_correlation